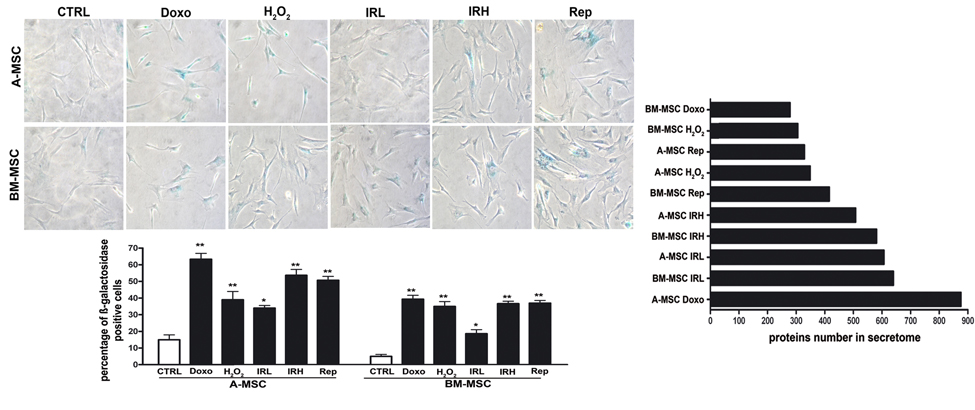
Figure 1.Induction of senescence in MSC culturesLeft: Representative microscopic fields of acid beta-galactosidase (blue) in treated and control cells are shown. The histogram shows mean percentage value of senescent cells (± SD, n = 3, *p < 0.05; p**<0.01). Right: The graph shows the number of proteins found in secretomes of senescent A MSC and BM MSC. DOXO and H2O2 indicate the doxorubicin- and peroxide-treated MSCs Low (40 mGy) and high (2000 mGy) dose irradiated cells were indicated as IRL and IRH, respectively. Replicative senescent MSCs were called REPs.