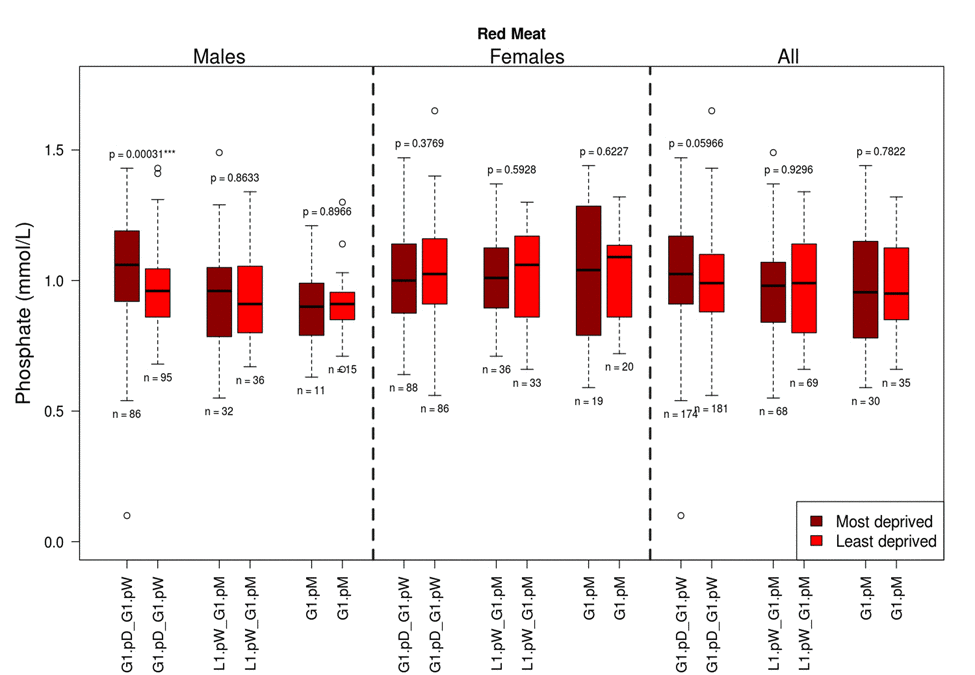
Figure 2.The influence of red meat consumption frequency on phosphate levels split by gender and deprivation presented as quartiles with rangesG1.pD-G1.pW =greater than once per day –greater than once per week; L1.pW - L1.pM = less than once per week – no greater than once per month; * G1.pM = greater than once per month.