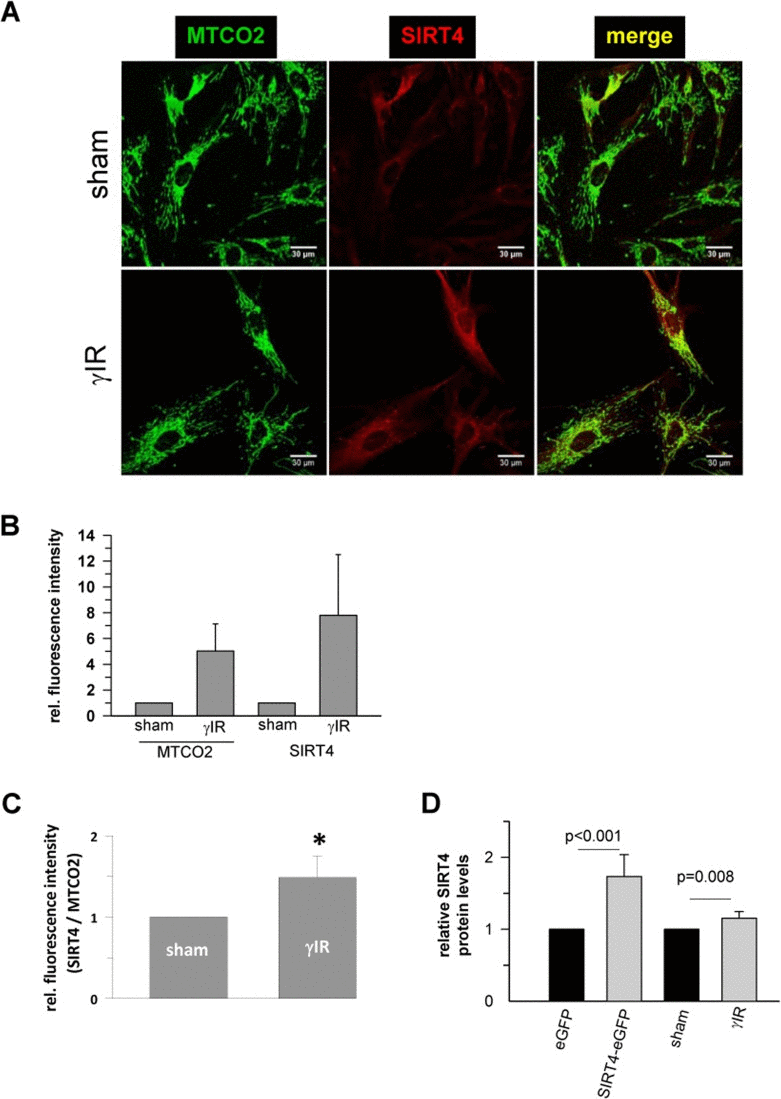
Figure 3.Confocal microscopy based analysis of the expression and colocalization of SIRT4 with the mitochondrial marker MTCO2 (mitochondrially encoded cytochrome C oxidase II) in γ-irradiated human dermal fibroblasts(A) Subcellular visualization of MTCO2 (green) and SIRT4 (red) in γ-irradiated (20 Gy) fibroblasts as compared to control (sham treated) cells. (B) Relative quantification of total MTCO2 and SIRT4 signal intensities in γ-irradiated cells as compared to control (sham treated) cells using the ImageJ software. (C) Total SIRT4 signal intensities were normalized to MTCO2 signals in γ-irradiated cells as compared to control (sham treated) cells. Mean ± s.d. from four independent experiments. Thirty to fifty cells were analysed per experiment and condition. To evaluate statistical significance, Mann-Whitney rank sum test was performed (*p<0.05). (D) ELISA-based quantification of relative SIRT4 protein levels (suppl. Material & Methods) in γ-irradiated fibroblasts as compared to sham treated cells. As comparison, relative SIRT4 levels were determined in HEK293 cells stably expressing SIRT4-eGFP vs. eGFP expressing control cells. To evaluate statistical significance, Mann-Whitney rank sum test was performed (n=5 independent experiments, mean ± s.d).