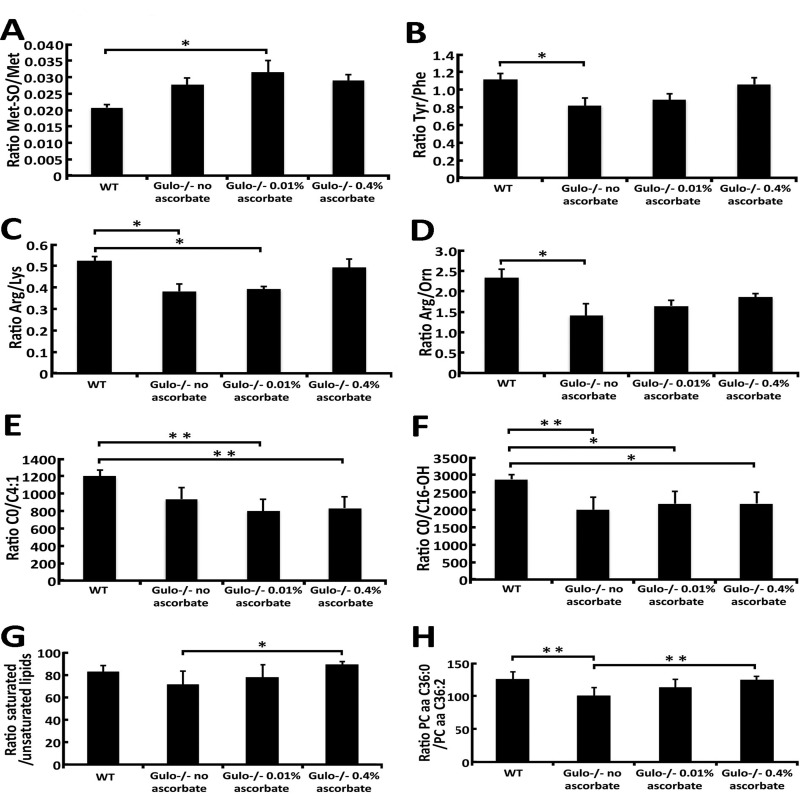
Figure 6.Ratios of metabolites demonstrating significant differences between Gulo−/− mice treated with different concentrations of ascorbate(A) Graph showing the Met-SO/Met ratio in the different groups of mice. Tukey post ANOVA test *P-value < 0.05. (B) Graph showing the Tyr/Phe ratio in the different groups of mice. Tukey post ANOVA test *P-value < 0.05. (C) Graph showing the Arg/Lys ratio in the different groups of mice. Tukey post ANOVA test *P-value < 0.05. (D) Graph showing the Arg/Orn ratio in the different groups of mice. Tukey post ANOVA test *P-value < 0.05. (E) Graph showing the C0/C4:1 ratio in the different groups of mice. Tukey post ANOVA test **P-value < 0.01. (F) Graph showing the C0/C16-OH ratio in the different groups of mice. Tukey post ANOVA test P-values are shown (*P < 0.05 and **P < 0.01). (G) Graph showing the ratio of saturated/unsaturated phosphatidylcholine species from the Figure 2. Tukey post ANOVA test *P-value < 0.05. (H) Graph showing the PC aa C36:0/PC aa C36:2 ratio in the different groups of mice. Tukey post ANOVA test **P-value < 0.01.