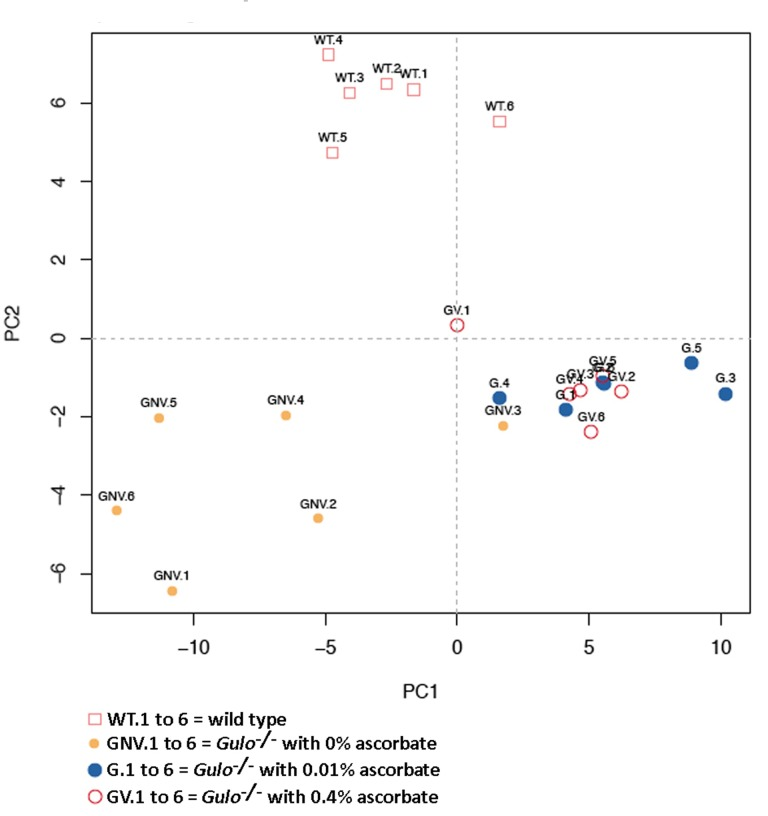
Figure 3.Principal component analysis (PCA) graph demonstrating the differentiation effect of ascorbate on the metabolomic profiles of wild type and Gulo−/− mice treated with different amounts of ascorbateX axis: Principal component 1, Y axis: Principal component 2. Wild type animals are labeled WT.1 to WT.6. Gulo−/− mice treated with 0.4% ascorbate in drinking water are labeled GV.1 to GV.6. Gulo−/− mice treated with 0.01% ascorbate are labeled G.1 to G.6. Gulo−/− mice treated with 0% ascorbate in drinking water from the age of three to four months are labeled GNV.1 to GNV.6.