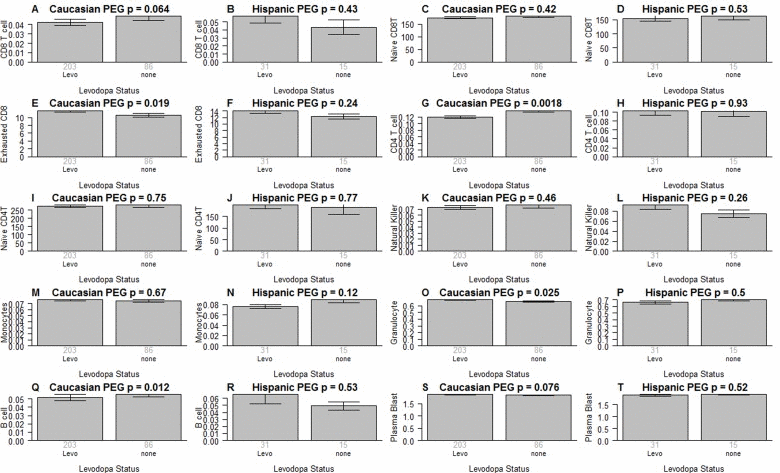
Figure 6.Medication status versus blood cell counts in PD patientsAs indicated in the heading of each panel, the panels alternate between the two data sets. Levodopa medication status (x-axis) versus (A,B) proportion of CD8+ T cells, (C,D) naïve CD8+ T cell count, (E,F) exhausted CD+T cell counts (defined as CD8+CD28-CD45RA-), (G,H) proportion of CD4+ T cells, (I,J) naïve CD4+ T cell count, (K,L) proportion of natural killer cells, (M,N) proportion of monocytes, (O,P) granulocytes, (Q,R)B cells, (S,T) plasma blasts (activated B cells). All cell types were estimated based on DNA methylation levels as described in Methods. Each bar plot depicts the mean value (y-axis), 1 standard error, and the group size (underneath the bar). The p-value results from a non-parametric group comparison test (Kruskal Wallis).