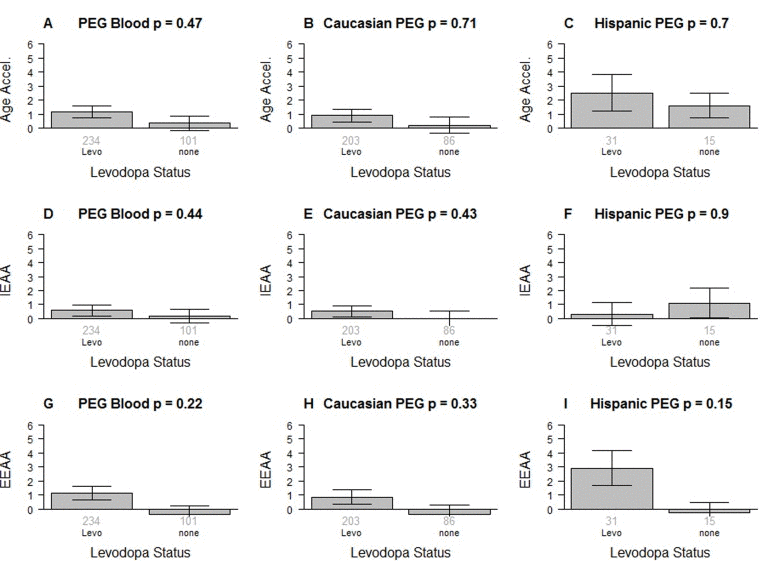
Figure 3.Levodopa medication status versus epigenetic age acceleration in PD patientsThe first, second, and third column correspond to all subjects, Caucasians only, and Hispanics only, respectively. Levodopa medication status versus (A,B,C) universal epigenetic age acceleration, (D,E,F) intrinsic epigenetic age acceleration (G,H,I), extrinsic epigenetic age acceleration. Each bar plot depicts the mean value (y-axis), 1 standard error, and the group size (underneath the bar). The p-value results from a non-parametric group comparison test (Kruskal Wallis).