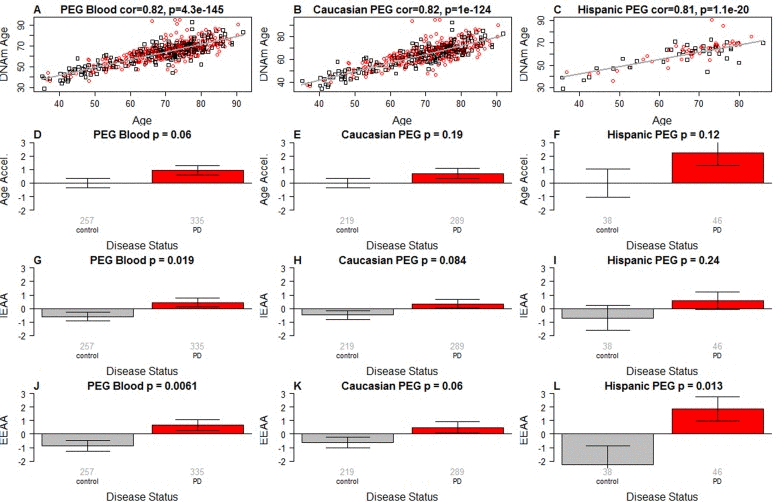
Figure 1.Epigenetic age analysis of PD(A-C) DNA methylation age (y-axis) versus chronological age (x-axis) in (A) all subjects, (B) Caucasians only, and (C) Hispanics only. Dots corresponds to subjects and are colored by PD disease status (red=PD, black=control). We define three measures of epigenetic age acceleration. (D-F) presents results for the “universal” measure of epigenetic age acceleration, which is defined as residual to a regression line through the control samples, i.e. the vertical distance of a point from the line. By definition, the mean age acceleration in controls is zero. (G-I) The bar plots relate measures of intrinsic epigenetic age acceleration to PD status. This measure is independent of blood cell counts. The fourth row (panels J-L) reports findings for the measure of extrinsic epigenetic age acceleration, which does relate to changes in cell composition. Each bar plot depicts the mean value (y-axis), 1 standard error, and the group size (underneath the bar). The p-value results from a Student T-test.