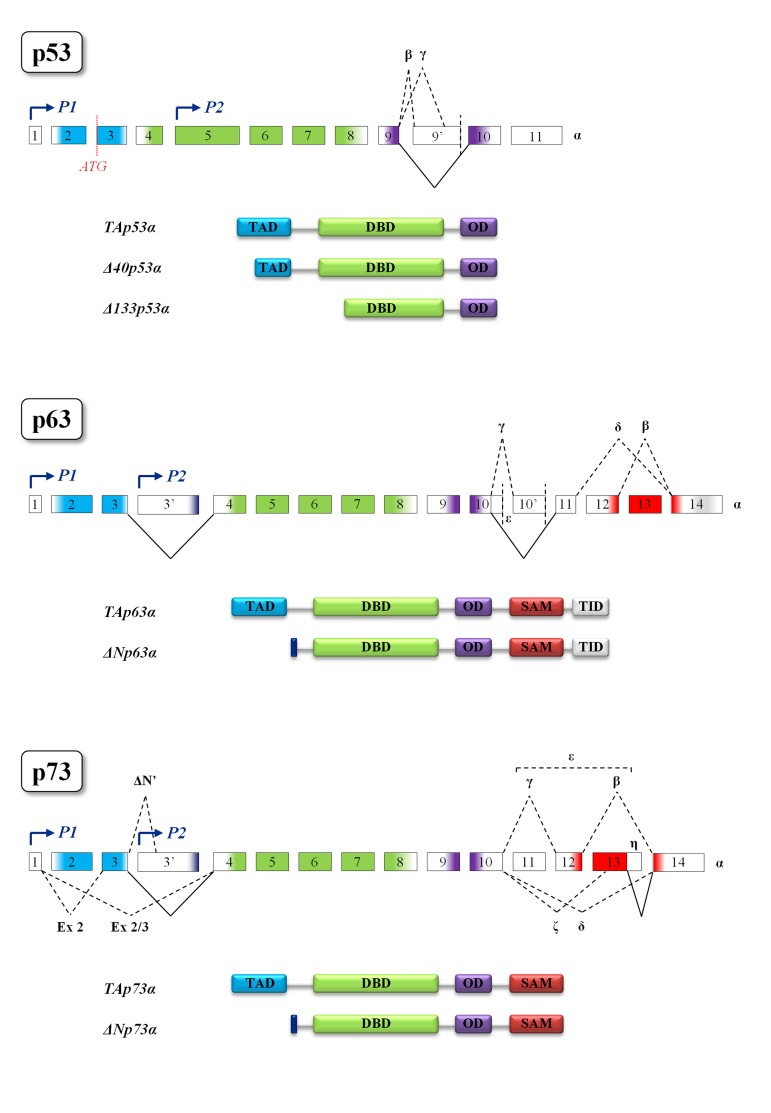
Figure 3.Structural motifs of p53 family membersGene and protein structures of p53 (top), p63 (middle) and p73 (bottom). Colors indicate protein domains encoded by the exons. The different transcription start sites P1 and P2 (indicated by blue arrows) give rise, respectively, to the TA and ∆N isoforms in both p63 and p73. In p53 gene the existence of an alternative translation start site (shown in red) generates the ∆40 isoform, while the ∆133 is transcribed by the P2 promoter. The multiple alternative splicing events leading to the different protein isoforms are represented by black dotted lines. Black solid lines represent splicing events leading to the formation of α proteins, the longest isoforms of each family member. Splicing of consecutive exons is omitted for simplicity. TAD, transactivation domain; DBD, DNA-binding domain; OD, oligomerization domain; SAM, sterile α-motif domain; TID, transcription inhibitory domain.