Submit an Article
Navigate
Home
Editorial Board
Editorial Policies
Current Volume
Archive
Scientific Integrity
Publication Ethics Statements
Interviews with Outstanding Authors
Newsroom
Sponsored Conferences
Podcast
Contact
Special Collections
Submit an Article
Online ISSN: 1945-4589
Research Paper
|
Volume 7, Issue 12
|
pp. 1077–1085
A shortened interval between vaccinations with the trivalent inactivated influenza vaccine increases responsiveness in the aged
Back to article
Figure 2
(2 of 3)
−
100%
+
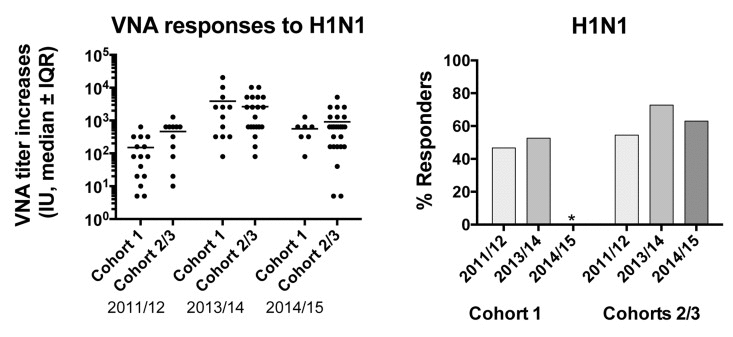
Figure 2.
Graph on the left shows increases of VNA titers to H1N1 between d0 and 14 after vaccination for the cohorts tested in different seasons
Graph on the right shows responsiveness of the cohorts in the different years.