Submit an Article
Navigate
Home
Editorial Board
Editorial Policies
Current Volume
Archive
Scientific Integrity
Publication Ethics Statements
Interviews with Outstanding Authors
Newsroom
Sponsored Conferences
Podcast
Contact
Special Collections
Submit an Article
Online ISSN: 1945-4589
Research Paper
|
Volume 7, Issue 4
|
pp. 269–279
Coronary artery calcifications predict long term cardiovascular events in non diabetic Caucasian hemodialysis patients
Back to article
Figure 2
(2 of 2)
−
100%
+
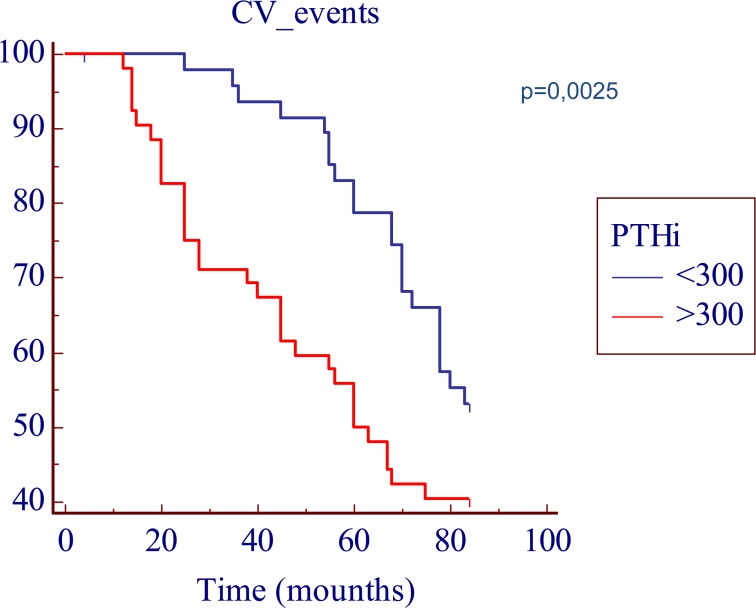
Figure 2.
Kaplan-Meier survival plot in function of the iPTH cut-off levels. The time is expressed as months.