Submit an Article
Navigate
Home
Editorial Board
Editorial Policies
Current Volume
Archive
Scientific Integrity
Publication Ethics Statements
Interviews with Outstanding Authors
Newsroom
Sponsored Conferences
Podcast
Contact
Special Collections
Submit an Article
Online ISSN: 1945-4589
Research Paper
|
Volume 6, Issue 6
|
pp. 511–521
The Dynamic Exome: acquired variants as individuals age
Back to article
Figure 2
(2 of 3)
−
100%
+
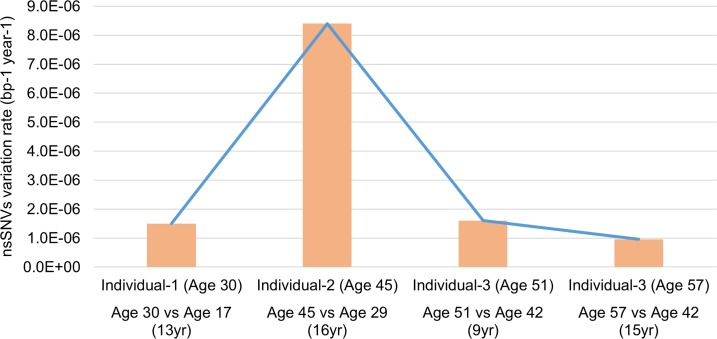
Figure 2.
Comparison of nsSNVs variation rate at different ages in three individuals
The variation rate varies dramatically between three individuals in our study. This indicates the individual specific genome dynamic of samples in our study.