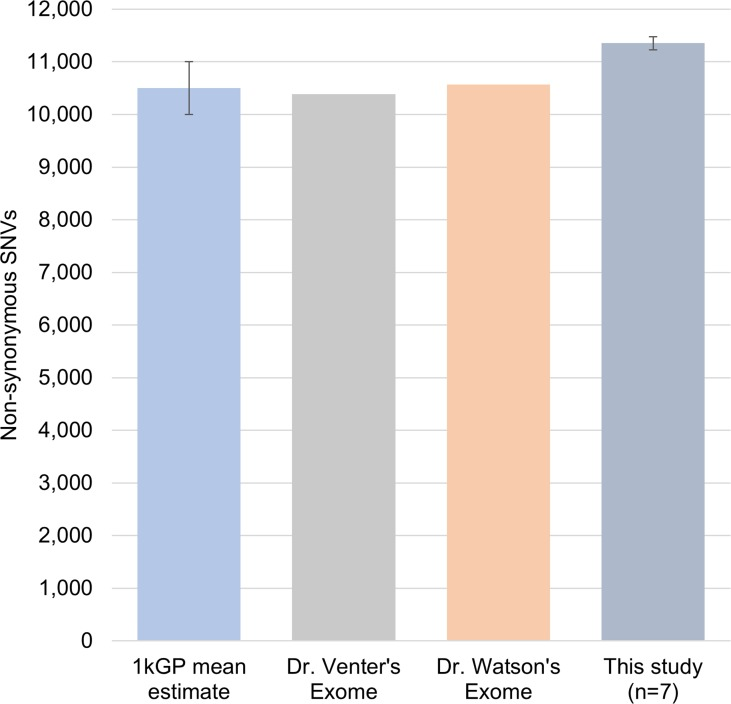
Figure 1.Comparison of number of non-synonymous SNVsNumber of non-synonymous SNVs found in samples in our study were comparable with the 1kGP average 10500 ± 500 (n=882), Dr.Venter, and Dr. Watson's exomes. This indicates that the amount of variation identified in the individuals for our study is comparable to previously reported population scale studies.