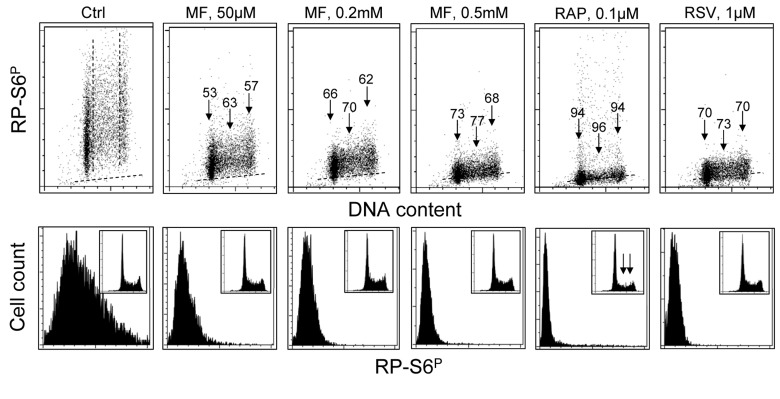
Figure 3.Effect of treatment of TK6 cells with MF, RAP or RSV for 24 h on the level of constitutive phosphorylation of S6 proteinTK6 cells were untreated (Ctrl) or treated with different concentrations of MF as well as with RAP or RSV for 24 h. Phosphorylation status of S6 was assessed as described in legend to Fig. 2. Top panels: The percent decrease in mean fluorescence intensity of the drug-treated cells in particular phases of the cell cycle is shown above the arrows. Bottom panels: Frequency histograms showing expression of RP-S6P in all cells of the respective cultures. Insets show cellular DNA content histograms of cells in these cultures.