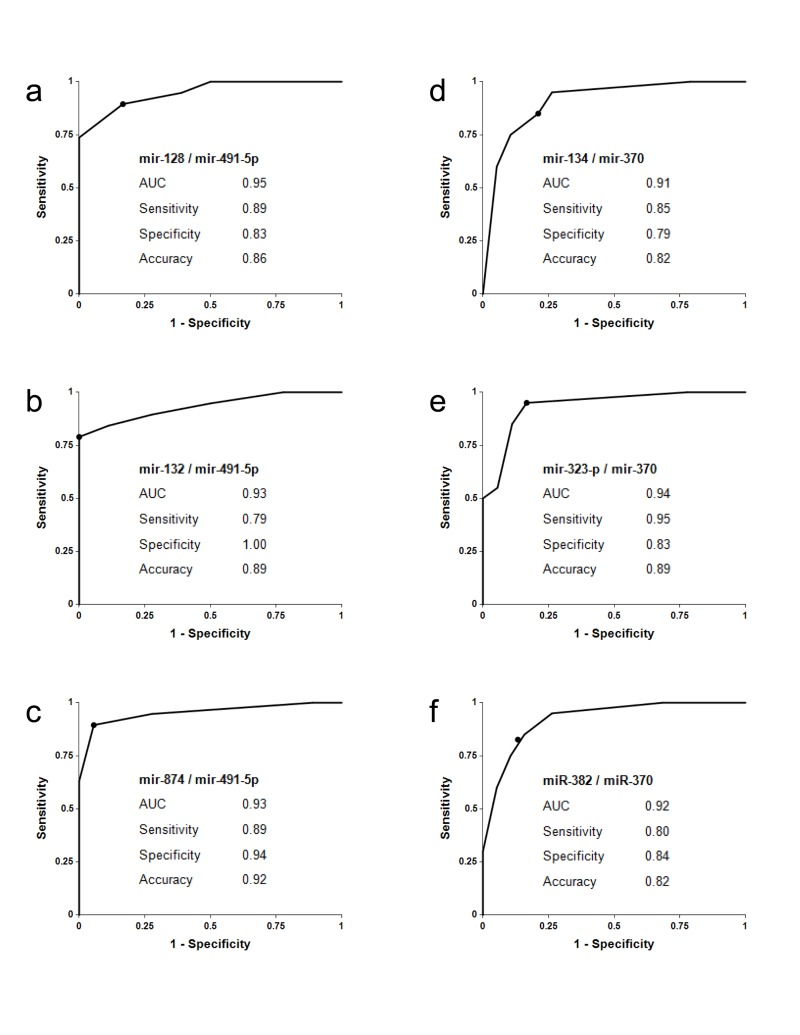
Figure 2.Receiver-Operating Characteristic (ROC) curve analysis of differentiation between MCI patients and age-matched controls obtained with different biomarker pairsThe areas under the ROC curve (AUC) are reported. Sensitivity, specificity and accuracy for each biomarker/normalizer pair are calculated for the “cutoff” point (indicated as a dot on each plot); the cutoff point is the ratio of paired miRNA, at which a sample is equally likely to belong to the AMC and the MCI groups (see Supplementary materials for more details).