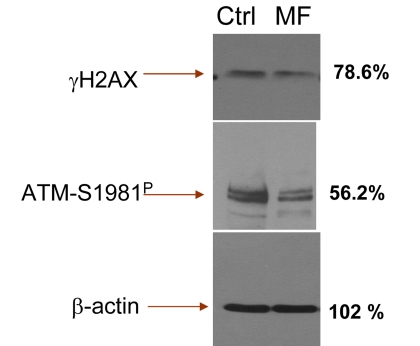
Figure 7.Detection of γH2AX and ATM-S1981P in TK6 cells untreated (Ctrl) and treated with 5 mM metformin (MF) for 48 h, by immunoblottingThe figures on right side of the blot represent the percent intensity of the scanned protein bands of the metformin-treated cells (UN-SCAN-IT gel 6.1) as that of the intensity of the respective protein bands of the untreated (Ctrl) cells.