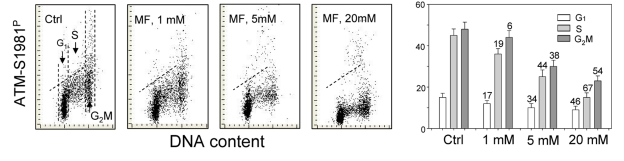
Figure 2.Effect of metformin (MF) on the level of constitutive ATM phosphorylation on Ser1981 in A549 cellsSimilar as in Figure 1, the cells were treated with 1, 5 or 20 mM MF for 48 h. Left panels present bivariate distributions of cellular DNA content vs intensity of ATM-S1981P IF. The mean values of ATM-S1981P for cells in G1, S, and G2M were obtained by gating analysis and are shown (+SD) as the bar plots (right panel). The skewed dash line shows the upper level of ATM-S198P IF intensity for 97% of G1- and S- phase cells in Ctrl.
Figure 2 — Genome protective effect of metformin as revealed by reduced level of constitutive DNA damage signaling | Aging