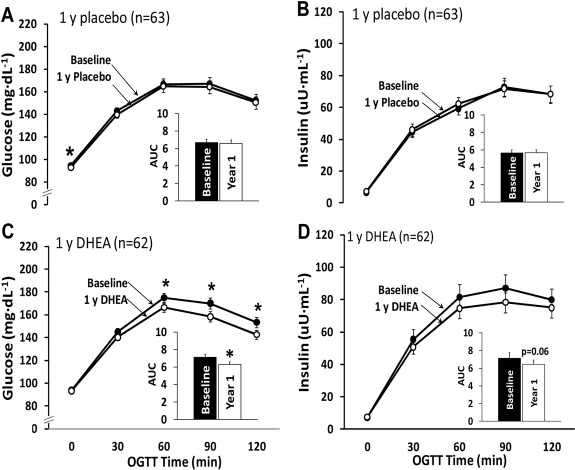
Figure 2.Oral glucose tolerance test results from the 1-yr randomized placebo-controlled trial. Changes in the areas under the curve for glucose and insulin did not differ significantly between the placebo group (panels A and B) and the DHEA group (panels C and D) (glucose, p=0.09; insulin, p=0.52). *p<0.05 for baseline to 1-yr change within group. AUC, area under the curve.