Submit an Article
Navigate
Home
Editorial Board
Editorial Policies
Current Volume
Archive
Scientific Integrity
Publication Ethics Statements
Interviews with Outstanding Authors
Newsroom
Sponsored Conferences
Podcast
Contact
Special Collections
Submit an Article
Online ISSN: 1945-4589
Research Paper
|
Volume 3, Issue 5
|
pp. 533–542
Dehydroepiandrosterone (DHEA) replacement decreases insulin resistance and lowers inflammatory cytokines in aging humans
Back to article
Figure 1
(1 of 3)
−
100%
+
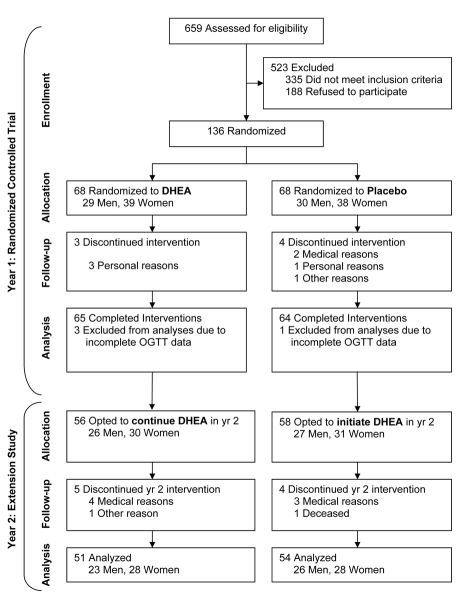
Figure 1.
Consort diagram indicating sample sizes at each stage during the study