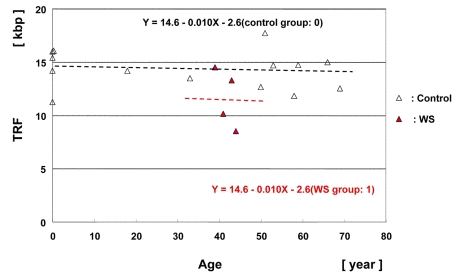
Figure 4.Scatter plot analysis of TRF lengths in muscle samples from WS patients and controlsMultiple regression analysis yielded a regression line for the 4 WS patients (Y = 14.6 − 0.010X (age) − 2.6 (WS group: 1); in red) and a regression line for the non-WS control subjects (n = 14), (Y = 14.6 − 0.010X (age) − 2.6 (control group: 0); control line in black).