Submit an Article
Navigate
Home
Editorial Board
Editorial Policies
Current Volume
Archive
Scientific Integrity
Publication Ethics Statements
Interviews with Outstanding Authors
Newsroom
Sponsored Conferences
Podcast
Contact
Special Collections
Submit an Article
Online ISSN: 1945-4589
Research Paper
|
Volume 2, Issue 12
|
pp. 945–958
Gender differences in metformin effect on aging, life span and spontaneous tumorigenesis in 129/Sv mice
Back to article
Figure 5
(5 of 5)
−
100%
+
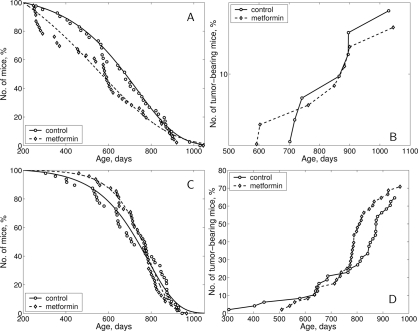
Figure 5.
Survival curves and tumor yield curves of 129/Sv mice treated or non-treated with metformin
(
A
) - survival curves, males; (
B
) - tumor yield curves, males; (
C
) - survival curves, females; D - tumor yield curves, females.
Figure 5 — Gender differences in metformin effect on aging, life span and spontaneous tumorigenesis in 129/Sv mice | Aging