Submit an Article
Navigate
Home
Editorial Board
Editorial Policies
Current Volume
Archive
Scientific Integrity
Publication Ethics Statements
Interviews with Outstanding Authors
Newsroom
Sponsored Conferences
Podcast
Contact
Special Collections
Submit an Article
Online ISSN: 1945-4589
Clinical Research Paper
|
Volume 3, Issue 1
|
pp. 63–76
Health and function of participants in the Long Life Family Study: A comparison with other cohorts
Back to article
Figure 2
(2 of 3)
−
100%
+
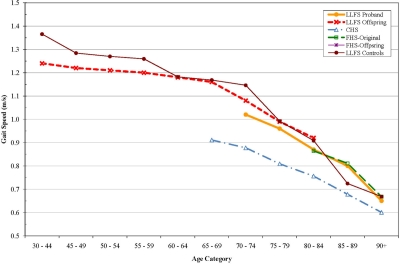
Figure 2.
Gait Speed (m/s) by age, adjusted for sex.
Figure 2 — Health and function of participants in the Long Life Family Study: A comparison with other cohorts | Aging