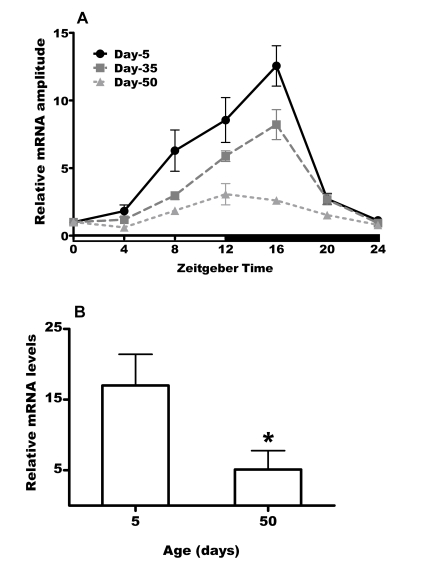
Figure 5.Expression of per mRNA declines with with age in heads of CSp
flies.
(A) Daily mRNA expression profiles of per in day 5, 35 and 50
male heads. White and black horizontal bars mark periods of light and
darkness respectively. Values were normalized to rp49 and calibrated
against ZT0 (taken as 1) for each age and represented as mean ± SEM of 3
bioreplicates. (B) The peak levels of per mRNA are
significantly reduced (* = p<0.05) in 50 day old males compared to young
control males. Values are mean ± SEM of 3 bioreplicates.