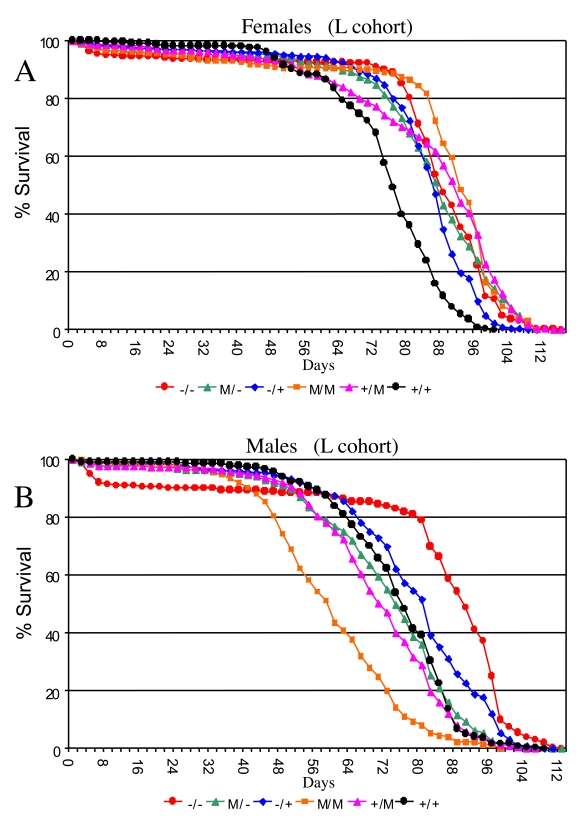
Figure 3.Effect of p53 mutations on life span. Cumulative survival
curves for L cohort. A key of p53 genotypes is presented below the graphs.
Males are indicated with solid symbols and females are indicated with open
symbols. (A) Females. (B) Males.
Figure 3 — Drosophila melanogaster p53 has developmental stage-specific and sex-specific effects on
adult life span indicative of sexual antagonistic pleiotropy | Aging