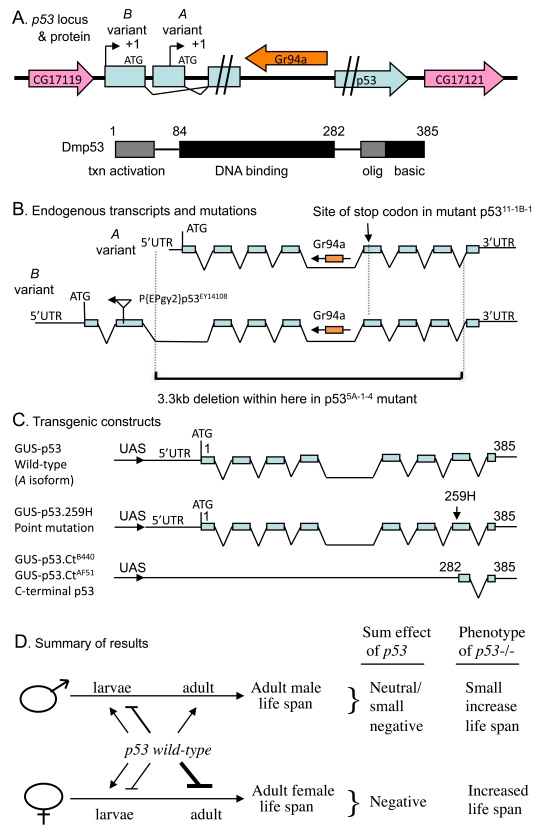
Figure 1.Summaryof Drosophila p53 locus, mutations, transgenes and life span effects. (A) Diagram of p53
locus and major protein product Dmp53. The p53 gene is indicated in
blue, including the two promoters, indicated by black arrows. The internal
intron/exon structure of p53 is omitted here for clarity, but is
shown below in (B). The pink arrows in indicate the genes that
flank p53 on the 5' and 3' side, genes CG17119 and CG17121,
respectively. The orange arrow indicates the gustatory receptor gene Gr94a,
located in the p53 intron. The 385 aa Dmp53 protein is diagrammed
using black and gray boxes, including the N-terminal transcriptional
activation domain, the central DNA binding domain, and the C-terminal
oligomerization domain and basic region. (B) Diagram of endogenous p53
transcripts and mutations. The intron/exon structure of the A and B variant
transcripts is indicated. The Gr94a gene is indicated in orange with an
arrow indicating orientation. The location of insertion of the P element P{EPgy2}p53EY14108
in the second exon of the B isoform is indicated by a triangle, with an
arrow indicating the orientation of the insert. The lower black bracket
indicates the breakpoints of the 3.3kb deletion in the p53[5A-1-4]
mutation. (C) Diagram of transgenic p53 constructs. (D)
Summary of p53 effects on adult life span. The effect on adult life
span of p53 wild type (A variant) over-expression during
larval development and in adults is diagrammed: Bars represent negative
effects of p53 wild-type on adult life span, while arrows represent
positive effects on adult life span; thickness of the lines indicates
relative strength of the effect. "Sum effect of p53" is the expected
summation of effects of p53 on adult life span, which is consistent
with the life span phenotype of p53 null mutation (p53-/-),
as indicated.