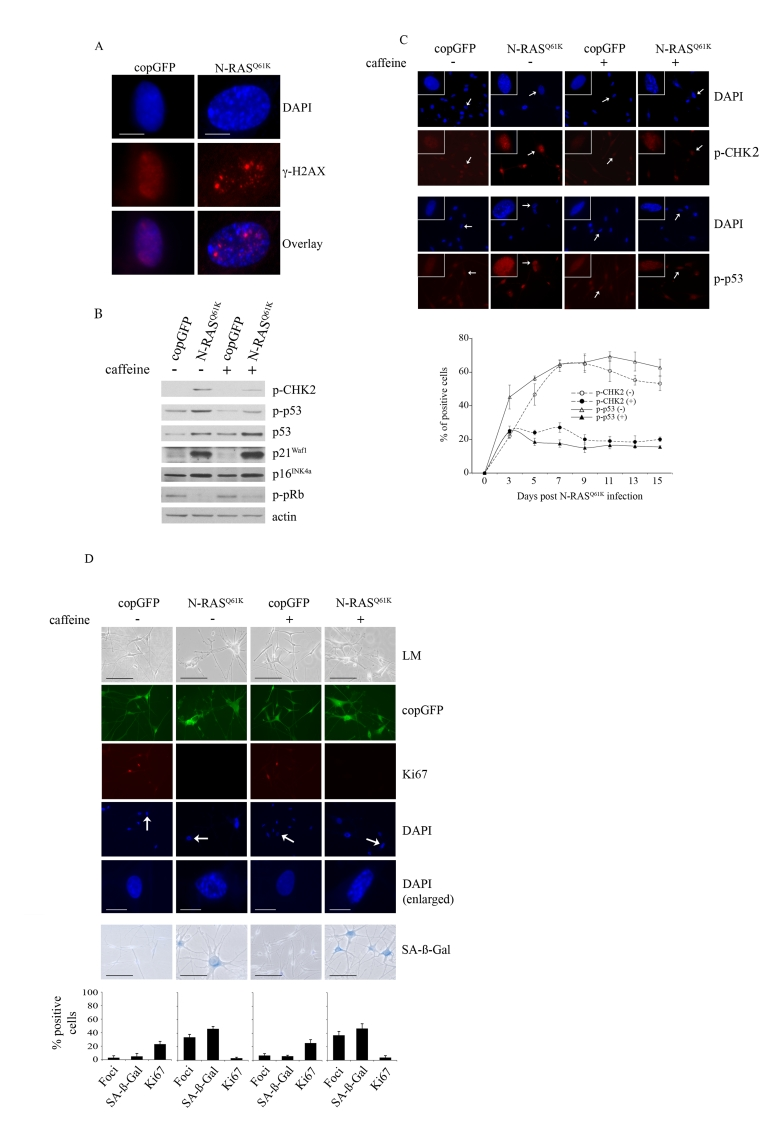
Figure 2.Oncogenic N-RAS Q61K induces DNA damage response in human melanocytes.
(A) Human
epidermal melanocytes infected with lentiviruses expressing N-RASQ61K
or copGFP were stained with DAPI and antibodies to the DNA damage marker γ-H2AX, 15 days post transduction
(bar =10 μm). (B) Human melanocytes were
transduced with lentiviruses expressing N-RASQ61K
or copGFP and cultured for 15 days in the presence (+) or absence (-) of
4mM caffeine. Expression of the indicated proteins was determined by
western blot analysis 15 days after infection.
(C)
Melanocytes transduced with lentivirus expressing N-RASQ61K or
copGFP and cultured for 15 days in the presence (+) or absence (-) of 4mM
caffeine were stained with DAPI and antibodies against the phosphorylated
forms of p53 (p-p53) or CHK2 (p-CHK2) (bar=100μm). Enlarged images of
representative cells (marked with arrow) are also shown. The percentage of
transduced melanocytes positive for p-p53 and p-CHK2 expression was
quantitated from at least two independent transduction experiments from a
total of at least 300 cells. The graph corresponds to the mean percentage
of transduced cells treated with caffeine (+) or left untreated (-) ± s.d.
(D)
Human melanocytes were transduced with
lentiviruses expressing N-RASQ61K or copGFP and cultured for 15
days in presence (+) or absence (-) of 4mM caffeine. The efficiency
of transduction was controlled with the co-expression of copGFP and was
consistently above 90%. Cell proliferation (Ki67), chromatin condensation
(DAPI), and the appearance of increased SA-β-Gal activity were analyzed and
quantitated 15 days after infection. Percentage of cells positive for the
indicated marker is shown in histograms, which correspond to the mean ±
s.d. of at least two independent transduction experiments from a total of
at least 300 cells. Cells enlarged to show DAPI-stained chromatin foci are
indicated with arrows (bar =10 μm). LM, light
microscopy (bar=100μm).