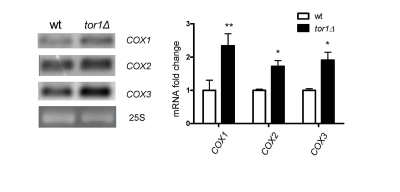
Figure 3.Increase of mitochondrial transcript abundance in tor1Δ strains.
Northern analysis of the mtDNA-encoded mRNA transcripts COX1-COX3 from wild-type (wt) and tor1Δ
strains is shown, along with ethidium bromide-stained nuclear 25S rRNA as a loading control.
Graphed on the right is the mean fold difference in COX1, COX2, and COX3 abundance normalized
to 25S rRNA +/- one standard deviation (* designates a p-value <0.05 and ** designates a p-value
<0.01 based on a student's t-test).