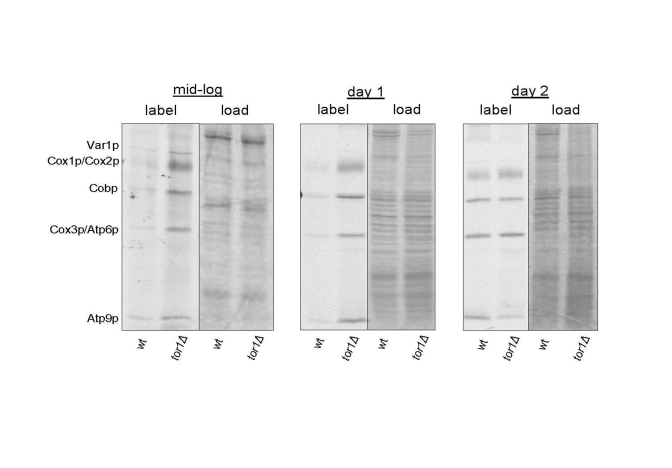
Figure 1.Elevated mitochondrial translation rates in tor1Δ strains during the exponential and early stationary growth phases. Results of an in vivo-labeling experiment in which
the mtDNA-encoded gene products are labeled specifically and visualized by autoradiography
after separation by SDS-PAGE (see Materials and Methods). Wild-type (wt) and tor1 null
(tor1Δ) strains labeled at mid-log, early stationary (day 1) and later stationary (day 2) are shown.
The left-half panel under each time point is the autoradiogram showing the labeled mitochondrial
gene products (with each product indicated on the left) and the right-hand panel is the respective
Coomassie blue-stained gel as a control for total protein loading.