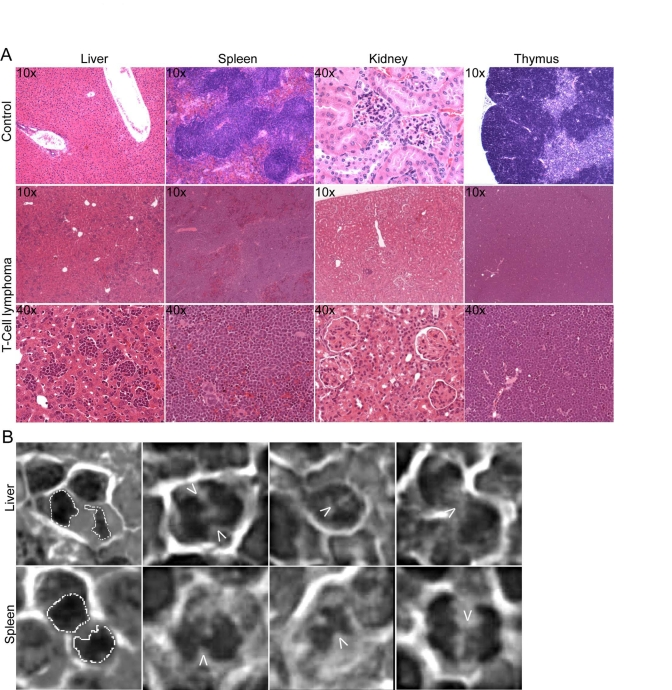
Figure 3.Development of genetically unstable T cell lymphoma in TRF2 overexpressing mice.(A) H&E staining of
tumor tissue. Tissue samples from a secondary recipient mouse, which
developed a blastic T cell lymphoma, involving liver, spleen and thymus.
10x and 40x magnifications are shown. The upper panels show sections of
control tissue from a healthy C57BL/6J mouse. (B) Anaphase bridges
in H&E stained liver and spleen sections from a secondary recipient
mouse carrying a CD4/CD8+/+ T cell lymphoma. The arrows point to the
chromatin bridges between the separating chromosomes. A dashed line
outlines normal anaphases displayed in the images to the very left.