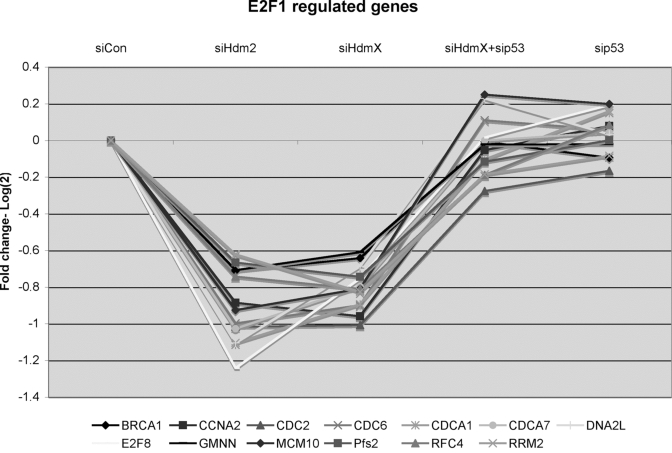
Figure 6.GeneChip expression of 13 reported E2F1-regulated genes that were repressed by knockdown of either siHdmX or siHdm2.
Y-axis represents the average fold change (log2) for each of the
genes in the indicated siRNA transfections relative to siCon (X-axis,
conditions labeled at the top of the chart).