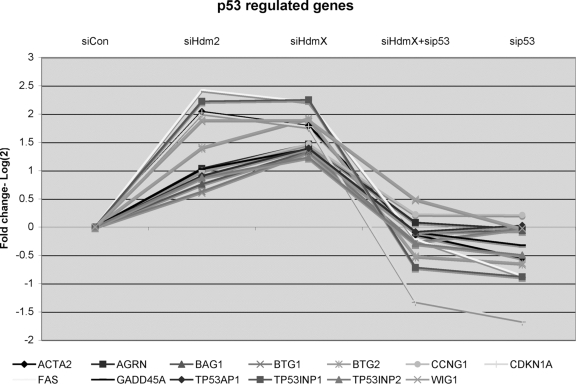
Figure 4.GeneChip expression of 13 known p53-regulated genes that were induced by knockdown of either siHdmX or siHdm2. Y-axis represents the average
fold change (log2) for each of the genes in the indicated siRNA
transfections relative to siCon (X-axis, conditions labeled at the top of
the chart).