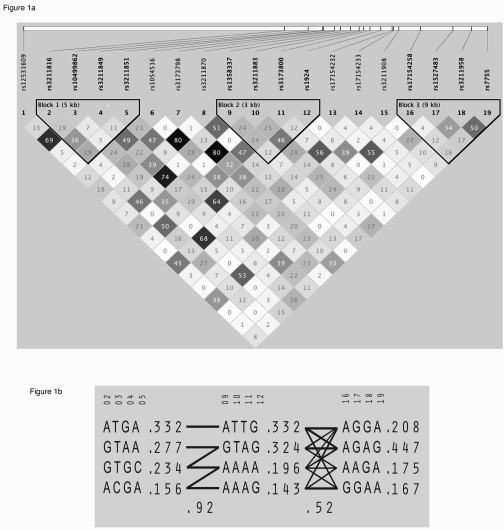
Figure 1.Linkage disequilibrium structure and haplo-typic architecture in CD36. (A) Haploview plot
defining haplotype block structure of the CD36 region. Linkage disequilibrium
(LD) was measured using data from all subjects in the present study. The
haplotype blocks were determined using the criteria described by Gabriel et al. [33]. The physical
position of each SNP is presented in the upper diagram. Each box provides
estimated statistics of the coefficient of determination (r2),
with darker shades representing stronger LD. (B) Haplotypes in the
haplotype blocks across the CD36 region. There are three haplotype
blocks across the region. The haplotype frequencies are shown to the right
of each haplotype. Only haplotypes having a frequency greater than 1% are
shown. The SNP numbers across the top of the haplotypes correspond to those
in the Haploview plot. A multiallelic D′ statistic, which indicates the level of recombination between two
blocks, is shown in the crossing area. Connections from one block to the
next were shown for haplotypes of greater than 10% frequency with thick
lines and greater than 1% frequency with thin lines.