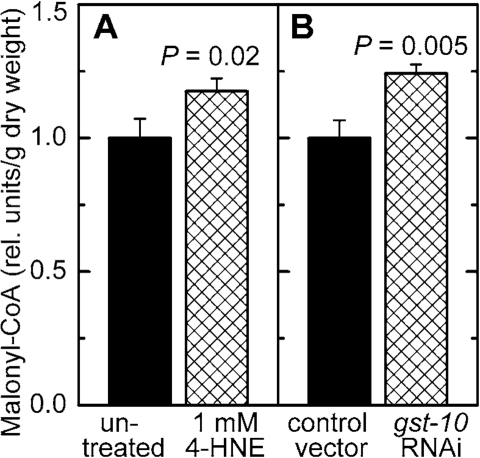
Figure 6.Effect of increased 4‑HNE levels on malonyl-CoA concentration.C. elegans were either treated with 1 mM 4‑HNE according to the protocol
described in the legend of Figure 5(A) or subjected to RNAi
to gst‑10(B)). The results were normalized to the
respective control and are shown as mean ± S.D. of 3 independently grown
worm populations. In (A), the control (C. elegans Bristol-N2 in liquid culture in the presence of E. coli OP50 but
without 4‑HNE) contained 16.5 ± 1.2 ng malonyl-CoA/mg dry weight;
in (B), the level of malonyl-CoA in the control (C. elegans Bristol-N2 grown on plates seeded with E. coli HT115(DE3)
transformed with insert-free L4440 feeding vector) was 12.2 ± 0.8 ng/mg dry
weight.