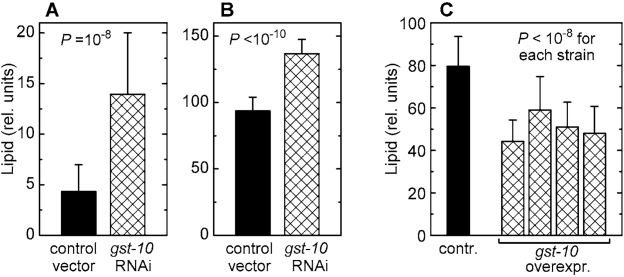
Figure 2.Lipid content of C. elegans with altered expression of gst‑10.(A) and (B): worms
fed bacteria carrying the insert-free L4440 feeding vector (control) and
worms subjected to RNAi against gst‑10. Lipid content was
measured by Nile red fluorescence (A) and by Sudan black staining (B).
(C): lipid content (by Sudan black) in worms
transformed with the insert-free pPD49.26 vector (control) and in four
transgenic C. elegans lines that overexpress gst‑10.
Bars represent means ± S.D. (n = 50 worms per group) of pixel intensities
integrated on worm micrographs.