Submit an Article
Navigate
Home
Editorial Board
Editorial Policies
Current Volume
Archive
Scientific Integrity
Publication Ethics Statements
Interviews with Outstanding Authors
Newsroom
Sponsored Conferences
Podcast
Contact
Special Collections
Submit an Article
Online ISSN: 1945-4589
Research Paper
|
Volume 1, Issue 1
|
pp. 58–67
Dual regulation of TERT activity through transcription and splicing by ΔNP63α
Back to article
Figure 6
(6 of 6)
−
100%
+
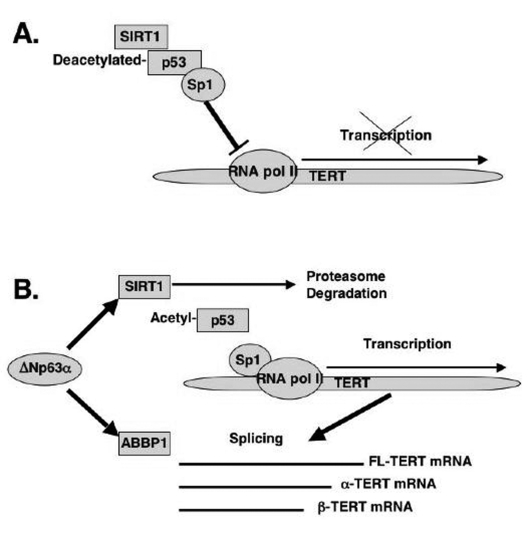
Figure 6.
Schematic representation of regulation of TERT transcription and splicing by ΔNp63α.
(A) mTERT transcription. (B) mTERT splicing.
Figure 6 — Dual regulation of TERT activity through transcription and splicing by ΔNP63α | Aging