


Introduction
Aging is the most influential risk factor for many disease states [1]. Developing interventions in the aging process will require building a systematic understanding of the underlying causal factors and associated biomarkers and epigenetic markers that lead to biological and cellular deterioration. The nine hallmarks of aging are key frameworks for describing such phenomena [2]. Epigenetic alterations, one of the nine hallmarks, can be accurately measured using DNA methylation (DNAm) levels [3, 39]. DNAm is the process in which a methyl group is added to the 5’ position on cytosines in cystine guanine dinucleotides, or CpGs [4]. Epigenetic clocks predict one’s cellular age by measuring this process of epigenetic deterioration using methylation data [5] and have been shown to predict chronological age with a correlation of 0.96 or higher [6]. Since then, many other comparable epigenetic clocks have been proposed using varying CpG sites, cohorts, and algorithmic approaches.
Phenotypic clocks are an alternative approach to measuring age-related deterioration and mortality. Phenotypic clocks use easily measurable biological and physiological clinical biomarkers to quantify aging and disease-related mortality (i.e., “aging scores”) and have been shown to predict mortality more accurately than chronological age [7–14]. Phenotypic clocks are easier to model when compared to epigenetic clocks because they use readily available measurements collected in a standard clinical setting. Additionally, they may provide insights into intracellular phenomena, while epigenetic clocks only measure at the cellular level. Further, changes in lifestyle, such as diet or exercise, are more readily manifested in alterations in these clinical biomarkers, providing valuable feedback that may be actionable.
This study aims to comprehensively survey existing research on epigenetic and phenotypic clocks. This survey extends previous systematic reviews and meta-analyses on epigenetic clocks [15, 16] by including recent epigenetic clocks using artificial neural networks, as well as providing greater focus on phenotypic clocks. To achieve these goals, this study conducted an extensive systematic review of all epigenetic and phenotypic age measurement literature, the first study of its kind. This study fills a critical gap in the literature by synthesizing studies on epigenetic clocks and phenotypic clocks, with a focus on the clinical utility of each.
Methods
This systematic review was designed in accordance with the Preferred Reporting Items for Systematic Reviews and Meta-Analyses (PRISMA) guidelines for protocol, search strategy, and risk of bias assessment [17].
Search strategy
A comprehensive literature search was performed on June 8, 2023, and was conducted using the PubMed online database. Additionally, a grey literature (i.e., citation tracing) and Google Scholar search were conducted to ensure optimal coverage of other journals and preprint publications. PubMed search terms included ‘epigenetic clock’ OR ‘biomarker clock’ AND aging, cellular (MeSH Terms) OR dna methylation (MeSH Terms) OR methylation, dna (MeSH Terms) OR longevity (MeSH Terms) AND biomarkers (MeSH Terms) OR ‘phenotypic’. After the search was complete, resources were screened according to the inclusion criteria outlined in the following section. A visual representation of the search strategy is shown in Figure 1.
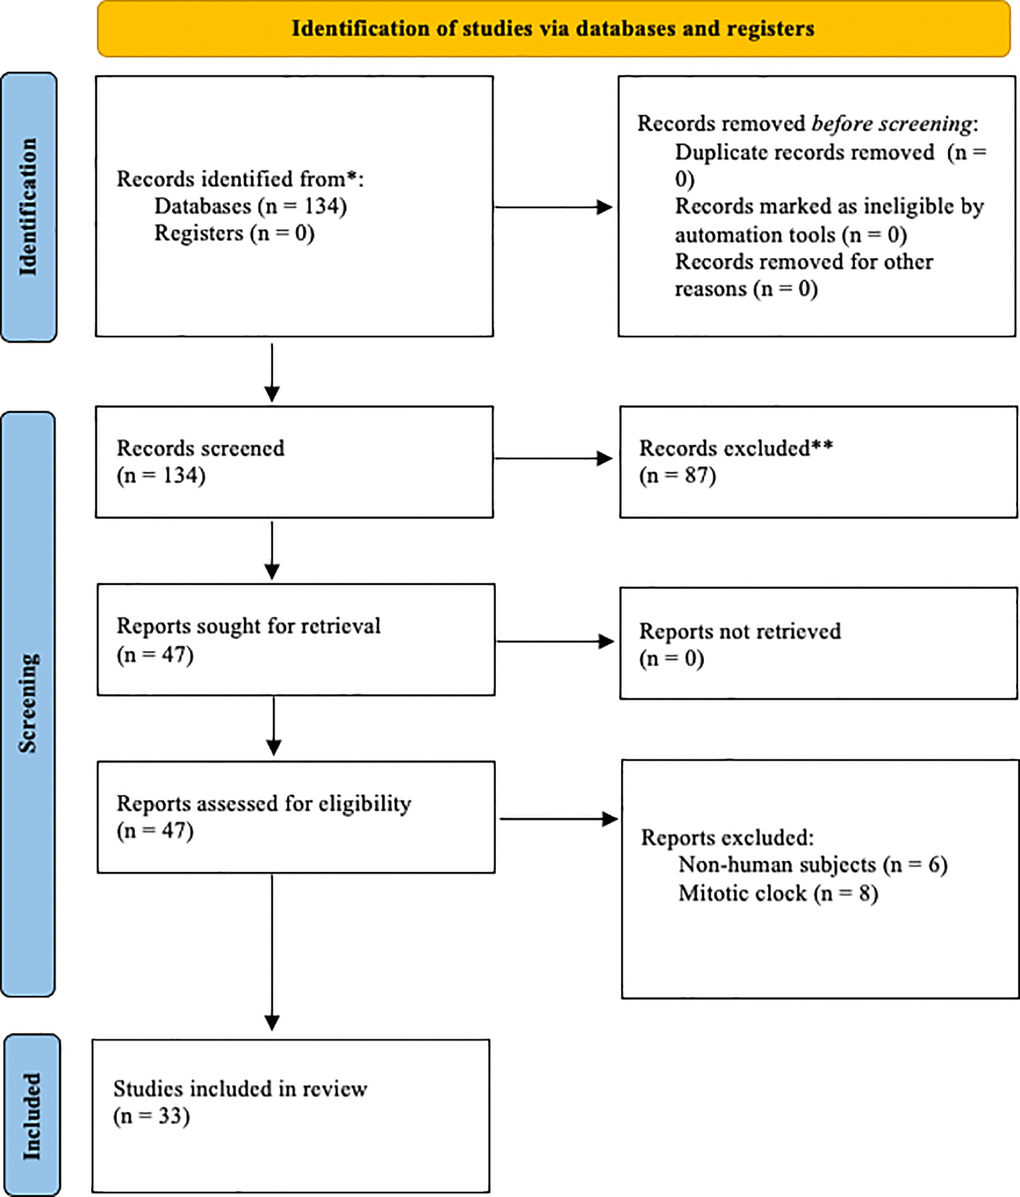
Figure 1. Prisma diagram illustrating the search process and exclusion criteria.
Inclusion and exclusion criteria
The included articles were limited to primary studies (i.e., non-reviews) available in the English language that concerned human subjects. We included clocks that used human blood or saliva samples to predict chronological age, phenotypic age, or mortality risk. We did not include mitotic clocks used to predict cancer risk and progression since this is outside the scope of this review. Furthermore, we excluded papers that were not primary studies (i.e., papers that reproduced and compared already published clocks).
Data extraction
Studies that fit the inclusion criteria were analyzed according to various descriptive statistics provided in the original literature. These included the publication year, type of clock, number of CpGs or blood biomarkers used, number of subjects, and accuracy of prediction (r). Additionally, we extracted model coefficients for the most influential plasma biomarkers used in phenotypic clocks.
Results
Study selection
The initial search resulted in 134 articles. After abstract screening, 87 articles were excluded. After full-text screening, 14 articles were removed. This yielded 33 included studies. Included studies featured a variety of biological clocks, including methylation-based clocks, mortality clocks, and phenotypic clocks. Table 1 presents the characteristics and performance of all the included clocks in our study.
Table 1. Descriptive statistics of all included first-generation epigenetic clocks.
| References | # of CpGs | n subjects | Performance (r) | ||||||||||||||||||||||||||||||||||||||||||||||||||||||||||||||||||||||||||||||||||||||||||||||||
| Horvath et al. (2020) [18] | 36,000 | 850 | 0.990 | ||||||||||||||||||||||||||||||||||||||||||||||||||||||||||||||||||||||||||||||||||||||||||||||||
| Q. Zhang et al. (2019) [19] | 514 | 13,566 | 0.990 | ||||||||||||||||||||||||||||||||||||||||||||||||||||||||||||||||||||||||||||||||||||||||||||||||
| de Lima Camillo et al. (2022) [20] | 20,318 | 8,050 | 0.980 | ||||||||||||||||||||||||||||||||||||||||||||||||||||||||||||||||||||||||||||||||||||||||||||||||
| Galkin et al. (2021) [21] | 24,538 | 1,293 | 0.980 | ||||||||||||||||||||||||||||||||||||||||||||||||||||||||||||||||||||||||||||||||||||||||||||||||
| Vidaki et al. (2017) [22] | 16 | 1156 | 0.980 | ||||||||||||||||||||||||||||||||||||||||||||||||||||||||||||||||||||||||||||||||||||||||||||||||
| Correia Dias et al. (2020) [23] | 4 | 53 | 0.977 | ||||||||||||||||||||||||||||||||||||||||||||||||||||||||||||||||||||||||||||||||||||||||||||||||
| Bekaert et al. (2015) [24] | 4 | 206 | 0.973 | ||||||||||||||||||||||||||||||||||||||||||||||||||||||||||||||||||||||||||||||||||||||||||||||||
| Lee et al. 2020) [25] | 1791 | 2,227 | 0.970 | ||||||||||||||||||||||||||||||||||||||||||||||||||||||||||||||||||||||||||||||||||||||||||||||||
| Thong et al. (2021) [26] | 3 | 196 | 0.969 | ||||||||||||||||||||||||||||||||||||||||||||||||||||||||||||||||||||||||||||||||||||||||||||||||
| Levy et al. (2020) [27] | 300,000 | 503 | 0.960 | ||||||||||||||||||||||||||||||||||||||||||||||||||||||||||||||||||||||||||||||||||||||||||||||||
| X. Li et al. (2018) [28] | 6 | 539 | 0.960 | ||||||||||||||||||||||||||||||||||||||||||||||||||||||||||||||||||||||||||||||||||||||||||||||||
| Horvath et al. (2018) [29] | 391 | 3931 | 0.960 | ||||||||||||||||||||||||||||||||||||||||||||||||||||||||||||||||||||||||||||||||||||||||||||||||
| Horvath, (2013) [30] | 353 | 3,931 | 0.960 | ||||||||||||||||||||||||||||||||||||||||||||||||||||||||||||||||||||||||||||||||||||||||||||||||
| Han et al. (2020) [31] | 9 | 973 | 0.943 | ||||||||||||||||||||||||||||||||||||||||||||||||||||||||||||||||||||||||||||||||||||||||||||||||
| Weidner et al. (2014) [32] | 99 | 656 | 0.933 | ||||||||||||||||||||||||||||||||||||||||||||||||||||||||||||||||||||||||||||||||||||||||||||||||
| Garagnani et al. (2012) [33] | 1 | 64 | 0.920 | ||||||||||||||||||||||||||||||||||||||||||||||||||||||||||||||||||||||||||||||||||||||||||||||||
| Hannum et al. (2013) [34] | 71 | 482 | 0.905 | ||||||||||||||||||||||||||||||||||||||||||||||||||||||||||||||||||||||||||||||||||||||||||||||||
| Freire-Aradas et al. (2018) [35] | 6 | 180 | 0.893 | ||||||||||||||||||||||||||||||||||||||||||||||||||||||||||||||||||||||||||||||||||||||||||||||||
| Florath et al. (2014) [36] | 17 | 249 | 0.880 | ||||||||||||||||||||||||||||||||||||||||||||||||||||||||||||||||||||||||||||||||||||||||||||||||
| Koch and Wagner (2011) [37] | 5 | 130 | 0.825 | ||||||||||||||||||||||||||||||||||||||||||||||||||||||||||||||||||||||||||||||||||||||||||||||||
| Vidal-Bralo et al. (2016) [38] | 8 | 390 | 0.775 | ||||||||||||||||||||||||||||||||||||||||||||||||||||||||||||||||||||||||||||||||||||||||||||||||
| Naue et al. (2017) [43] | 13 | 208 | NR | ||||||||||||||||||||||||||||||||||||||||||||||||||||||||||||||||||||||||||||||||||||||||||||||||
| Accuracy (r) represents the Pearson’s correlation coefficient of the predicted ages with the true ages in the validation set. NR stands for ‘not reported.’ Clocks are sorted by performance in descending order. | |||||||||||||||||||||||||||||||||||||||||||||||||||||||||||||||||||||||||||||||||||||||||||||||||||
Epigenetic clocks
Epigenetic clocks generally follow the standard protocol for regression problems. After data acquisition, one may conduct feature (i.e., CpG) selection and/or dimensionality reduction approaches in hopes of optimizing the prediction of the output (in this case, chronological age). The Pearson correlation coefficient of the predicted age and the “true” chronological age is the most common metric used in the literature to measure such performance. Below, we outline the performance of all included epigenetic clocks along with their respective modeling statistics, including the number of CpGs and the number of subjects. In some cases, the authors of the original literature chose a different validation metric. In these cases, we denoted their performance as “not reported” (NR). In the results below, we separate our epigenetic clock findings into three categories: first-generation, second-generation, and third-generation. We do so because each of these types of approaches are fundamentally different from the others and a direct comparison would not be appropriate.
First-generation clocks
Epigenetic clocks may be divided into several distinct generations. First-generation clocks rely on cross-sectional data alone to investigate the association of biomarkers with chronological age. In these approaches, deviations between the true chronological age and the predicted age are treated as indications of accelerated or decelerated aging. Horvath’s first epigenetic clock (Horvath, 2013) inspired a wealth of research into this type of approach and many studies have substantiated this hypothesis by confirming that accelerated epigenetic aging is associated with various deleterious phenotypes, including post-traumatic stress (Boks et al., 2015), obesity (Horvath et al., 2014), and more. Additionally, increased epigenetic age has been shown to predict mortality later in life (Marioni et al., 2015), albeit moderately. We present a collection of characteristics and prediction performances of first-generation clocks below.
Second-generation clocks
While first-generation clocks made great progress in understanding the mechanistic properties of cellular aging, various drawbacks are inherent to the chronological age approach. First, Horvath, and Raj (2018) concluded that first-generation clocks are only able to provide weak associations with physiological measures of dysregulation. Secondly, and perhaps most critical, is the paradox of chronological age. Zhang et al. (2018) found that DNAm levels can, theoretically, provide perfect chronological age predictions if enough data is available, but useful mortality and phenotypic associations attenuate as predictions near perfection. Consequently, second-generation clocks were proposed to address these concerns. Rather than using candidate biomarkers to predict chronological age, second-generation clocks investigate the association of biomarkers with time-to-event data, specifically time-to-mortality. The most influential second-generation clocks include PhenoAge (Levine, 2018), GrimAge (Lu et al., 2018), and MetaboHealth (Deelin et al., 2019). Each of these approaches used very different strategies to predict mortality risk. PhenoAge used calendar age and 9 clinical measurements to predict phenotypic age, which was then used to regress on DNAm levels to identify 513 CpG sites that influence disease and mortality among those of the same calendar age. GrimAge used 12 plasma proteins and smoking pack-years regressed on all-cause mortality, identifying 1030 influential CpG sites. Lastly, MetaboHealth used metabolic predictors to identify 14 biomarkers independently associated with all-cause mortality. Each of these approaches exhibited greater strengths of association with all-cause mortality than first-generation clocks.
Third-generation clocks
Third-generation clocks are characterized by the use of longitudinal data to predict aging rates. The most noteworthy third-generation clock is DunedinPoAm [36], which measured longitudinal changes of 18 clinical biomarkers to predict rates of aging. Like second-generation clocks, DundeinPoAm exhibited superior mortality risk prediction than first-generation clocks. A few other longitudinal studies have been conducted using methylation data [93–95]. As longitudinal data becomes more readily available, third-generation clocks will become more prevalent due to their predictive power.
First-generation clock modelling decisions and performance
Unsurprisingly, there is a wide range in predictive performance of the various clocks due to heterogeneous data sources. The clocks that featured the highest correlation with chronological age were [18, 19], with Pearson correlations of 0.990 with the output. Interestingly, Horvath’s clock used 36,000 CpG sites in the model, significantly more than the number of training samples. The authors did so by employing feature selection methods based on model coefficients extracted from linear models. The Horvath clock [18] used penalized regression models, while the Zhang clock [19] used elastic net regression. [20–22] attained the next best correlated predictions (R = 0.98) and were all based on artificial neural networks (ANNs). [22] built multiple ANNs, including multi-layer perceptrons (MLPs), radial bias functions (RBFs), probabilistic neural networks (PNNs), and generalized regression neural networks (GRNNs). Both [20] and [22] built deep learning models, but [20] paired their model with SHAP (Shapley Additive Explanations) [92] values to provide interpretability.
Phenotypic clocks
While biological clocks have focused more on methylation data in recent years, phenotypic clocks also provide valuable longevity estimations using readily available clinical measurements. To that end, phenotypic clocks have been proven to predict mortality more accurately than chronological age in a variety of scenarios [8–14, 35].
Klemera and Doubal [40] were the first to prove that biological age estimates using purely clinical values provided more robust measurements of mortality than chronological age. Since then, phenotypic models have largely focused on using proportional hazard and survival models such as the Gompertz mortality model [10, 41]. These models often use chronological age along with other biomarkers of aging to predict mortality. [40] were the first to use chronological age as a biomarker and anticipated this would be viewed as controversial due to the heterogeneity of aging processes among different people.
Before Klemera and Doubal’s method, most phenotypic models fell under three categories: multiple linear regression (MLR), principal component analysis (PCA), or Hochschild’s method [42]. MLR models choose biomarkers according to their correlation with chronological age and were established by Hollingsworth [43] and others. MLR models are simple to implement but distort the biological age at the regression edge (i.e., at the youngest and oldest ages). PCA-based biological clocks avoid distortion at the regression edge but cannot avoid the paradox of chronological age [44]. Hochschild’s method solves the paradox of chronological age but is nonstandard and somewhat complex to implement. Klemera and Doubal’s method improves on each of these methods by solving the paradox of aging by minimizing the distance between regression lines for each biomarker point, providing a better estimation of mortality than chronological age. [50] evaluated multiple variations of both the Klemera and Doubal phenotypic clock and frailty indices [78–79] and evaluated their performance both with and without chronological age as an input variable. The authors found that the models without chronological age input captured the most variability of mortality indicators, though more research is needed on this subject.
Unlike epigenetic clocks, phenotypic clocks may be modeled using a variety of approaches. Klemera and Doubal’s popular approach uses chronological age as one of the input biomarkers, along with other standard biomarkers such as blood glucose. However, using chronological age to calculate biological age is a somewhat controversial modeling decision. This can, as expected, lead to a very high correlation, as shown in Table 2.
Table 2. Descriptive statistics of phenotypic clocks that use chronological age as input.
| References | Output variable | # biomarkers | n subjects | Performance (r) | |||||||||||||||||||||||||||||||||||||||||||||||||||||||||||||||||||||||||||||||||||||||||||||||
| Chen et al. (2023) [45] | Chronological | 12 | 12,377 | 0.980 | |||||||||||||||||||||||||||||||||||||||||||||||||||||||||||||||||||||||||||||||||||||||||||||||
| Liu et al. (2018) [41] | Chronological | 13 | 11,432 | 0.960 | |||||||||||||||||||||||||||||||||||||||||||||||||||||||||||||||||||||||||||||||||||||||||||||||
| Levine (2013) [9] | Chronological | 13 | 9,389 | NR | |||||||||||||||||||||||||||||||||||||||||||||||||||||||||||||||||||||||||||||||||||||||||||||||
| Accuracy (r) represents the Pearson’s correlation coefficient of the predicted ages with the true ages in the validation set. NR stands for ‘not reported.’ Clocks are sorted by performance in descending order. | |||||||||||||||||||||||||||||||||||||||||||||||||||||||||||||||||||||||||||||||||||||||||||||||||||
There are, however, phenotypic clocks that do not use chronological age as input to the model. A variety of modeling structures have been employed to calculate phenotypic age in this way. Putin et al. (2016) used an ensemble of deep neural networks, while Husted et al. (2022) and Park et al. (2009) used principal component analysis (PCA) approaches. [14] used a very different approach, employing agglomerative clustering to determine influential biomarkers in aging and mortality processes. The performance and descriptive statistics of each of these models are shown in Table 3.
Table 3. Descriptive statistics of phenotypic clocks that do not use chronological age as input.
| Reference | Output variable | # biomarkers | n subjects | Performance (r) | |||||||||||||||||||||||||||||||||||||||||||||||||||||||||||||||||||||||||||||||||||||||||||||||
| Putin et al. (2016) [47] | Chronological | 41 | 62,419 | 0.910 | |||||||||||||||||||||||||||||||||||||||||||||||||||||||||||||||||||||||||||||||||||||||||||||||
| Husted et al. (2022) [48] | Chronological | 9 | 100 | 0.86 | |||||||||||||||||||||||||||||||||||||||||||||||||||||||||||||||||||||||||||||||||||||||||||||||
| Park et al. (2009) [46] | Chronological | 11 | 1588 | 0.762 | |||||||||||||||||||||||||||||||||||||||||||||||||||||||||||||||||||||||||||||||||||||||||||||||
| Nakamura and Miyao, (2007) [49] | Chronological | 5 | 86 | 0.720 | |||||||||||||||||||||||||||||||||||||||||||||||||||||||||||||||||||||||||||||||||||||||||||||||
| Sebastiani et al. (2017) [14] | N/A (unsupervised clustering) | 19 | 4704 | NR | |||||||||||||||||||||||||||||||||||||||||||||||||||||||||||||||||||||||||||||||||||||||||||||||
| Accuracy (r) represents the Pearson’s correlation coefficient of the predicted ages with the true ages in the validation set. NR stands for ‘not reported.’ Clocks are sorted by performance in descending order. | |||||||||||||||||||||||||||||||||||||||||||||||||||||||||||||||||||||||||||||||||||||||||||||||||||
Despite widespread use in epigenetic clocks, artificial neural networks have, to our knowledge, only been employed in one phenotypic clock. [47] used an ensemble of 21 deep neural networks (DNNs) of varying structure and depth to predict chronological age using physiological biomarkers alone. Furthermore, the authors paired their model with a feature importance wrapper-based strategy called Permutation Feature Importance (PFI), which allowed the authors to ascertain which variables are most influential in the model. The authors attained impressive prediction performance (r = 0.91), but the dataset used in the experiments is not open-source and, thus, is not reproducible.
Biomarker importance in phenotypic clocks
Many phenotypic clocks are modeled using linear models due to their ease of interpretability. Unlike artificial neural networks, information from linear models can be directly extracted from coefficients in the model. These coefficients measure the relative importance of each feature in the model and can be used to better understand the model’s predictions. Many phenotypic clocks identified the same plasma biomarkers as most influential in the aging process. A brief analysis of model coefficients (i.e., feature contribution) used in phenotypic clocks was conducted to identify which plasma biomarkers were consistently found to be influential in primary literature. The varying magnitude of the coefficients can be attributed to the other features included in each of the models. The results of this analysis are reported in Table 4.
Table 4. Clinical plasma biomarkers and their respective regression coefficients.
| Biomarker | Nakamura and Miyao, (2007) [49] | Levine, (2013) [10] | Mitnitski et al., (2017) [50] | Liu et al., (2018) [41] | |||||||||||||||||||||||||||||||||||||||||||||||||||||||||||||||||||||||||||||||||||||||||||||||
| Systolic blood pressure | 0.580 | 0.501 | −0.008 | NR | |||||||||||||||||||||||||||||||||||||||||||||||||||||||||||||||||||||||||||||||||||||||||||||||
| Diastolic blood pressure | 0.405 | 0.047 | −0.130 | NR | |||||||||||||||||||||||||||||||||||||||||||||||||||||||||||||||||||||||||||||||||||||||||||||||
| Forced expiratory volume | −0.626 | −0.535 | NR | NR | |||||||||||||||||||||||||||||||||||||||||||||||||||||||||||||||||||||||||||||||||||||||||||||||
| White blood cell count | −0.115 | −0.020 | 0.021 | NR | |||||||||||||||||||||||||||||||||||||||||||||||||||||||||||||||||||||||||||||||||||||||||||||||
| Red blood cell count | −0.367 | −0.096 | NR | NR | |||||||||||||||||||||||||||||||||||||||||||||||||||||||||||||||||||||||||||||||||||||||||||||||
| Hemoglobin | −0.299 | 0.261 | −0.246 | NR | |||||||||||||||||||||||||||||||||||||||||||||||||||||||||||||||||||||||||||||||||||||||||||||||
| Hematocrit | −0.435 | −0.036 | NR | NR | |||||||||||||||||||||||||||||||||||||||||||||||||||||||||||||||||||||||||||||||||||||||||||||||
| C-reactive protein (log) | NR | 0.122 | NR | 0.0954 | |||||||||||||||||||||||||||||||||||||||||||||||||||||||||||||||||||||||||||||||||||||||||||||||
| Albumin | −0.310 | −0.220 | −0.236 | −0.0336 | |||||||||||||||||||||||||||||||||||||||||||||||||||||||||||||||||||||||||||||||||||||||||||||||
| Lymphocyte (%) | NR | −0.033 | NR | 0.0120 | |||||||||||||||||||||||||||||||||||||||||||||||||||||||||||||||||||||||||||||||||||||||||||||||
| Alkaline phosphatase | −0.333 | 0.218 | 0.081 | 0.00188 | |||||||||||||||||||||||||||||||||||||||||||||||||||||||||||||||||||||||||||||||||||||||||||||||
| Creatinine | 0.181 | 0.148 | 0.142 | 0.0095 | |||||||||||||||||||||||||||||||||||||||||||||||||||||||||||||||||||||||||||||||||||||||||||||||
| Blood glucose | 0.129 | NR | 0.036 | 0.0195 | |||||||||||||||||||||||||||||||||||||||||||||||||||||||||||||||||||||||||||||||||||||||||||||||
| NR was given for biomarkers that were “not reported” in the primary literature. | |||||||||||||||||||||||||||||||||||||||||||||||||||||||||||||||||||||||||||||||||||||||||||||||||||
Discussion
Phenotypic age, health-status, and mortality
Biological aging measurements using clinically observable data (i.e., phenotypes) have produced robust estimations and predictions of aging-related outcomes and mortality [41]. Much of recent biological clock research has focused on methylation data, but phenotypic features also offer powerful mortality and aging predictive power [35]. Phenotypic variables offer benefits at multiple levels in that they provide crucial insights into the physiological state of the subject in addition to providing an aggregate measure, albeit indirect, of the changes in various hallmarks of aging. Perhaps most importantly, changes in these phenotypic biomarkers are mechanistically linked to organ and cellular functions and, by extension, health outcomes and health span. Most of these phenotypic biomarkers are also highly actionable with lifestyle and dietary changes within a reasonably short period of time. Finally, they are much easier to collect than molecular measures due to lower cost and technology barriers. This suggests that phenotypic clocks could be easier to scale than epigenetic clocks since these measures are routinely collected in clinical settings at relatively affordable cost and the health benefits of tracking one’s phenotypic age are easily understood both by the individual and the healthcare system.
Epigenetic clock associations with health and mortality
Epigenetic clocks have been shown to be significantly associated with various deleterious phenotypes. Multiple epigenetic clocks have found that body mass index (BMI) is correlated with increased epigenetic age, but further research is needed to better understand this relationship [51, 52]. To our knowledge, only one longitudinal study has found obesity to be the cause, rather than a consequence, of increased epigenetic age [53]. Multiple clocks found that high levels of alcohol intake were associated with increased epigenetic age. However, moderate levels of alcohol intake were not associated with increased epigenetic age, suggesting a non-linear relationship. Other disease states associated with elevated biological age include HIV [54–57], chronic obstructive pulmonary disease (COPD) [41, 58, 59], schizophrenia [60], post-traumatic stress disorder (PTSD) [61], smoking [62–67], particulate matter [68–70], diabetes [71–75], frailty [76] and socioeconomic status [77]. Recently, Noroozi et al. (2023) [96] identified several lifestyle and socio-economic variables impacting epigenetic aging rates, including sleep quality, education level, yoga practice, and more.
Epigenetic clocks in vitro vs. in vivo
A key advantage of epigenetic clocks is their ability to provide robust aging estimations across tissues, physiological systems, and life stages. Unlike phenotypic clocks, epigenetic clocks are able to measure cellular changes both in vitro and in vivo. Additionally, they are able to generalize across tissues [20], making them particularly useful in both clinical and research settings. Furthermore, epigenetic clocks have been shown to provide insights into systemic physiological changes using only blood samples [97]. A recent clock, SystemsAge [97], proved that single blood DNA methylation tests have the ability to capture heterogeneous aging patterns across physiological systems. Their findings showed that providing scores for each physiological system can more accurately capture disease risk, better facilitating personalized care plans compared to a single global aging metric.
Dimensionality reduction
Many biological clocks have utilized dimensionality reduction for a variety of reasons. First, methylation data is highly dimensional, with the common 450k arrays producing over 450,000 features. Additionally, high levels of entropy can often be present in methylation data due to various causes, including sample preparation, beads per CpG, batch effects, and probe chemistry and hybridization issues [80–84]. Dimensionality reduction can reduce noise caused by such deviations because entropy will likely not covary across features. Lastly, dimensionality reduction can provide significant improvements in computational tractability. The most common dimensionality reduction method used in extant biological clock literature is Principal Component Analysis (PCA) [85, 86, 49]. PCA is a computationally tractable linear dimensionality reduction approach and has proven to increase the accuracy of predictions in a variety of cohorts. In recent years, various non-linear dimensionality reduction methods have been proposed, including Isometric Mapping (Isomap), t-Distributed Stochastic Neighbor Embedding (t-SNE), and Unified Manifold Approximation and Projection (UMAP) [87]. To date, only one biological clock (DeepMAge) has utilized these more complex, non-linear approaches [21]. The authors attained state-of-the-art performance, but additional research is needed to address whether predictive improvements are significant enough to warrant the increased computational expense of non-linear dimensionality reduction techniques.
Limitations
The main limitation of this review is the inability to objectively measure performance across heterogeneous cohorts and environments. Recent research has provided such objective comparisons [88–91]. This review set out to instead provide a comprehensive layout of extant research into two disparate but related fields: epigenetic clocks and phenotypic clocks. Additionally, this review is limited by its exclusion criteria, namely mitotic clocks and clocks that were built using non-human subjects. Consequently, this review did not seek to provide objective statistics to measure the performance of various methods. Lastly, this review was limited by its exclusion of non-English publications.
Conclusions
Despite a recent surge in biological clock research, best practices are still empirical. Epigenetic clocks have illustrated superior chronological age estimation capabilities, but their ability to provide insights into mortality and disease has been shown to be moderate. In recent years, epigenetic clocks built using neural networks have attained state-of-the-art performance but must be paired with interpretability approaches such as SHAP [92] to understand the “black box” nature of the models. Phenotypic clocks have shown to be better predictors of mortality than chronological age and do so using easily measurable clinical variables. Since methylation array technology is still relatively cost-prohibitive in clinical or hospital settings, phenotypic clocks may provide the most utility in the short term.
Author Contributions
BW was involved in planning, literature review, draft writing, and final manuscript writing. ER contributed to the planning, supervision, draft writing and review, and final manuscript writing and review. AD assisted with draft writing, draft review, and final manuscript review. AL contributed by draft and final manuscript review.
Conflicts of Interest
The authors declare no conflicts of interest related to this study.
Funding
No external funding was used in this paper.
References
- 1. Jaul E, Barron J. Age-Related Diseases and Clinical and Public Health Implications for the 85 Years Old and Over Population. Front Public Health. 2017; 5:335. https://doi.org/10.3389/fpubh.2017.00335 [PubMed]
- 2. López-Otín C, Blasco MA, Partridge L, Serrano M, Kroemer G. The hallmarks of aging. Cell. 2013; 153:1194–217. https://doi.org/10.1016/j.cell.2013.05.039 [PubMed]
- 3. Jones MJ, Goodman SJ, Kobor MS. DNA methylation and healthy human aging. Aging Cell. 2015; 14:924–32. https://doi.org/10.1111/acel.12349 [PubMed]
- 4. Jung SE, Shin KJ, Lee HY. DNA methylation-based age prediction from various tissues and body fluids. BMB Rep. 2017; 50:546–53. https://doi.org/10.5483/bmbrep.2017.50.11.175 [PubMed]
- 5. Horvath S, Raj K. DNA methylation-based biomarkers and the epigenetic clock theory of ageing. Nat Rev Genet. 2018; 19:371–84. https://doi.org/10.1038/s41576-018-0004-3 [PubMed]
- 6. Horvath S. DNA methylation age of human tissues and cell types. Genome Biol. 2013; 14:R115. https://doi.org/10.1186/gb-2013-14-10-r115 [PubMed]
- 7. Belsky DW, Caspi A, Houts R, Cohen HJ, Corcoran DL, Danese A, Harrington H, Israel S, Levine ME, Schaefer JD, Sugden K, Williams B, Yashin AI, et al. Quantification of biological aging in young adults. Proc Natl Acad Sci U S A. 2015; 112:E4104–10. https://doi.org/10.1073/pnas.1506264112 [PubMed]
- 8. Ferrucci L, Hesdorffer C, Bandinelli S, Simonsick EM. Frailty as a Nexus Between the Biology of Aging, Environmental Conditions and Clinical Geriatrics. In Public Health Reviews. 2010; 32:475–88. https://doi.org/10.1007/BF03391612
- 9. Levine ME. Modeling the rate of senescence: can estimated biological age predict mortality more accurately than chronological age? J Gerontol A Biol Sci Med Sci. 2013; 68:667–74. https://doi.org/10.1093/gerona/gls233 [PubMed]
- 10. Levine ME, Lu AT, Quach A, Chen BH, Assimes TL, Bandinelli S, Hou L, Baccarelli AA, Stewart JD, Li Y, Whitsel EA, Wilson JG, Reiner AP, et al. An epigenetic biomarker of aging for lifespan and healthspan. Aging (Albany NY). 2018; 10:573–91. https://doi.org/10.18632/aging.101414 [PubMed]
- 11. Li S, Wong EM, Joo JE, Jung CH, Chung J, Apicella C, Stone J, Dite GS, Giles GG, Southey MC, Hopper JL. Genetic and Environmental Causes of Variation in the Difference Between Biological Age Based on DNA Methylation and Chronological Age for Middle-Aged Women. Twin Res Hum Genet. 2015; 18:720–6. https://doi.org/10.1017/thg.2015.75 [PubMed]
- 12. Peterson MJ, Thompson DK, Pieper CF, Morey MC, Kraus VB, Kraus WE, Sullivan P, Fillenbaum G, Cohen HJ. A Novel Analytic Technique to Measure Associations Between Circulating Biomarkers and Physical Performance Across the Adult Life Span. J Gerontol A Biol Sci Med Sci. 2016; 71:196–202. https://doi.org/10.1093/gerona/glv007 [PubMed]
- 13. Sanders JL, Minster RL, Barmada MM, Matteini AM, Boudreau RM, Christensen K, Mayeux R, Borecki IB, Zhang Q, Perls T, Newman AB. Heritability of and mortality prediction with a longevity phenotype: the healthy aging index. J Gerontol A Biol Sci Med Sci. 2014; 69:479–85. https://doi.org/10.1093/gerona/glt117 [PubMed]
- 14. Sebastiani P, Thyagarajan B, Sun F, Schupf N, Newman AB, Montano M, Perls TT. Biomarker signatures of aging. Aging Cell. 2017; 16:329–38. https://doi.org/10.1111/acel.12557 [PubMed]
- 15. Fransquet PD, Wrigglesworth J, Woods RL, Ernst ME, Ryan J. The epigenetic clock as a predictor of disease and mortality risk: a systematic review and meta-analysis. Clin Epigenetics. 2019; 11:62. https://doi.org/10.1186/s13148-019-0656-7 [PubMed]
- 16. Oblak L, van der Zaag J, Higgins-Chen AT, Levine ME, Boks MP. A systematic review of biological, social and environmental factors associated with epigenetic clock acceleration. Ageing Res Rev. 2021; 69:101348. https://doi.org/10.1016/j.arr.2021.101348 [PubMed]
- 17. Moher D, Liberati A, Tetzlaff J, Altman DG, and PRISMA Group. Preferred reporting items for systematic reviews and meta-analyses: the PRISMA Statement. Open Med. 2009; 3:e123–30. [PubMed]
- 18. Horvath S, Singh K, Raj K, Khairnar S, Sanghavi A, Shrivastava A, Zoller JA, Li CZ, Herenu CB, Canatelli-Mallat M, Lehmann M, Solberg Woods LC, Garcia Martinez A, et al. Reversing age: dual species measurement of epigenetic age with a single clock. BioRxiv. 2020. https://doi.org/10.1101/2020.05.07.082917
- 19. Zhang Q, Vallerga CL, Walker RM, Lin T, Henders AK, Montgomery GW, He J, Fan D, Fowdar J, Kennedy M, Pitcher T, Pearson J, Halliday G, et al. Improved precision of epigenetic clock estimates across tissues and its implication for biological ageing. Genome Med. 2019; 11:54. https://doi.org/10.1186/s13073-019-0667-1 [PubMed]
- 20. de Lima Camillo LP, Lapierre LR, Singh R. A pan-tissue DNA-methylation epigenetic clock based on deep learning. Npj Aging 8. 2022. https://doi.org/10.1038/s41514-022-00085-y
- 21. Galkin F, Mamoshina P, Kochetov K, Sidorenko D, Zhavoronkov A. DeepMAge: A Methylation Aging Clock Developed with Deep Learning. Aging Dis. 2021; 12:1252–62. https://doi.org/10.14336/AD.2020.1202 [PubMed]
- 22. Vidaki A, Ballard D, Aliferi A, Miller TH, Barron LP, Syndercombe Court D. DNA methylation-based forensic age prediction using artificial neural networks and next generation sequencing. Forensic Sci Int Genet. 2017; 28:225–36. https://doi.org/10.1016/j.fsigen.2017.02.009 [PubMed]
- 23. Correia Dias H, Cunha E, Corte Real F, Manco L. Age prediction in living: Forensic epigenetic age estimation based on blood samples. Leg Med (Tokyo). 2020; 47:101763. https://doi.org/10.1016/j.legalmed.2020.101763 [PubMed]
- 24. Bekaert B, Kamalandua A, Zapico SC, Van de Voorde W, Decorte R. Improved age determination of blood and teeth samples using a selected set of DNA methylation markers. Epigenetics. 2015; 10:922–30. https://doi.org/10.1080/15592294.2015.1080413 [PubMed]
- 25. Li X, Li W, Xu Y. Human Age Prediction Based on DNA Methylation Using a Gradient Boosting Regressor. Genes (Basel). 2018; 9:424. https://doi.org/10.3390/genes9090424 [PubMed]
- 26. Horvath S, Oshima J, Martin GM, Lu AT, Quach A, Cohen H, Felton S, Matsuyama M, Lowe D, Kabacik S, Wilson JG, Reiner AP, Maierhofer A, et al. Epigenetic clock for skin and blood cells applied to Hutchinson Gilford Progeria Syndrome and ex vivo studies. Aging (Albany NY). 2018; 10:1758–75. https://doi.org/10.18632/aging.101508 [PubMed]
- 27. Han Y, Franzen J, Stiehl T, Gobs M, Kuo CC, Nikolić M, Hapala J, Koop BE, Strathmann K, Ritz-Timme S, Wagner W. New targeted approaches for epigenetic age predictions. BMC Biol. 2020; 18:71. https://doi.org/10.1186/s12915-020-00807-2 [PubMed]
- 28. Weidner CI, Lin Q, Koch CM, Eisele L, Beier F, Ziegler P, Bauerschlag DO, Jöckel KH, Erbel R, Mühleisen TW, Zenke M, Brümmendorf TH, Wagner W. Aging of blood can be tracked by DNA methylation changes at just three CpG sites. Genome Biol. 2014; 15:R24. https://doi.org/10.1186/gb-2014-15-2-r24 [PubMed]
- 29. Garagnani P, Bacalini MG, Pirazzini C, Gori D, Giuliani C, Mari D, Di Blasio AM, Gentilini D, Vitale G, Collino S, Rezzi S, Castellani G, Capri M, et al. Methylation of ELOVL2 gene as a new epigenetic marker of age. Aging Cell. 2012; 11:1132–4. https://doi.org/10.1111/acel.12005 [PubMed]
- 30. Hannum G, Guinney J, Zhao L, Zhang L, Hughes G, Sadda S, Klotzle B, Bibikova M, Fan JB, Gao Y, Deconde R, Chen M, Rajapakse I, et al. Genome-wide methylation profiles reveal quantitative views of human aging rates. Mol Cell. 2013; 49:359–67. https://doi.org/10.1016/j.molcel.2012.10.016 [PubMed]
- 31. Freire-Aradas A, Phillips C, Girón-Santamaría L, Mosquera-Miguel A, Gómez-Tato A, Casares de Cal MÁ, Álvarez-Dios J, Lareu MV. Tracking age-correlated DNA methylation markers in the young. Forensic Sci Int Genet. 2018; 36:50–9. https://doi.org/10.1016/j.fsigen.2018.06.011 [PubMed]
- 32. Florath I, Butterbach K, Müller H, Bewerunge-Hudler M, Brenner H. Cross-sectional and longitudinal changes in DNA methylation with age: an epigenome-wide analysis revealing over 60 novel age-associated CpG sites. Hum Mol Genet. 2014; 23:1186–201. https://doi.org/10.1093/hmg/ddt531 [PubMed]
- 33. Koch CM, Wagner W. Epigenetic-aging-signature to determine age in different tissues. Aging (Albany NY). 2011; 3:1018–27. https://doi.org/10.18632/aging.100395 [PubMed]
- 34. Vidal-Bralo L, Lopez-Golan Y, Gonzalez A. Simplified Assay for Epigenetic Age Estimation in Whole Blood of Adults. Front Genet. 2016; 7:126. https://doi.org/10.3389/fgene.2016.00126 [PubMed]
- 35. Bae CY, Im Y, Lee J, Park CS, Kim M, Kwon H, Kim B, Park HR, Lee CH, Kim I, Kim J. Comparison of biological age prediction models using clinical biomarkers commonly measured in clinical practice settings: Ai techniques vs. traditional statistical methods. Front Anal Sci. 2021; 1:709589. https://doi.org/10.3389/frans.2021.709589
- 36. Belsky DW, Caspi A, Arseneault L, Baccarelli A, Corcoran DL, Gao X, Hannon E, Harrington HL, Rasmussen LJ, Houts R, Huffman K, Kraus WE, Kwon D, et al. Quantification of the pace of biological aging in humans through a blood test, the DunedinPoAm DNA methylation algorithm. Elife. 2020; 9:e54870. https://doi.org/10.7554/eLife.54870 [PubMed]
- 37. Lu AT, Quach A, Wilson JG, Reiner AP, Aviv A, Raj K, Hou L, Baccarelli AA, Li Y, Stewart JD, Whitsel EA, Assimes TL, Ferrucci L, Horvath S. DNA methylation GrimAge strongly predicts lifespan and healthspan. Aging (Albany NY). 2019; 11:303–27. https://doi.org/10.18632/aging.101684 [PubMed]
- 38. Zhang Y, Wilson R, Heiss J, Breitling LP, Saum KU, Schöttker B, Holleczek B, Waldenberger M, Peters A, Brenner H. DNA methylation signatures in peripheral blood strongly predict all-cause mortality. Nat Commun. 2017; 8:14617. https://doi.org/10.1038/ncomms14617 [PubMed]
- 39. Naue J, Hoefsloot HCJ, Mook ORF, Rijlaarsdam-Hoekstra L, van der Zwalm MCH, Henneman P, Kloosterman AD, Verschure PJ. Chronological age prediction based on DNA methylation: Massive parallel sequencing and random forest regression. Forensic Sci Int Genet. 2017; 31:19–28. https://doi.org/10.1016/j.fsigen.2017.07.015 [PubMed]
- 40. Klemera P, Doubal S. A new approach to the concept and computation of biological age. Mech Ageing Dev. 2006; 127:240–8. https://doi.org/10.1016/j.mad.2005.10.004 [PubMed]
- 41. Liu Z, Kuo PL, Horvath S, Crimmins E, Ferrucci L, Levine M. A new aging measure captures morbidity and mortality risk across diverse subpopulations from NHANES IV: A cohort study. PLoS Med. 2018; 15:e1002718. https://doi.org/10.1371/journal.pmed.1002718 [PubMed]
- 42. Hochschild R. Improving the precision of biological age determinations. Part 1: A new approach to calculating biological age. Exp Gerontol. 1989; 24:289–300. https://doi.org/10.1016/0531-5565(89)90002-8 [PubMed]
- 43. Hollingsworth JW, Hashizume A, Jablon S. Correlations between tests of aging in Hiroshima subjects--an attempt to define "physiologic age". Yale J Biol Med. 1965; 38:11–26. [PubMed]
- 44. Okajima S, Mine M, Nakamura T. Mortality of registered A-bomb survivors in Nagasaki, Japan, 1970-1984. Radiat Res. 1985; 103:419–31. [PubMed]
- 45. Chen L, Zhang Y, Yu C, Guo Y, Sun D, Pang Y, Pei P, Yang L, Millwood IY, Walters RG, Chen Y, Du H, Liu Y, et al, and China Kadoorie Biobank Collaborative Group. Modeling biological age using blood biomarkers and physical measurements in Chinese adults. EBioMedicine. 2023; 89:104458. https://doi.org/10.1016/j.ebiom.2023.104458 [PubMed]
- 46. Park J, Cho B, Kwon H, Lee C. Developing a biological age assessment equation using principal component analysis and clinical biomarkers of aging in Korean men. Arch Gerontol Geriatr. 2009; 49:7–12. https://doi.org/10.1016/j.archger.2008.04.003 [PubMed]
- 47. Putin E, Mamoshina P, Aliper A, Korzinkin M, Moskalev A, Kolosov A, Ostrovskiy A, Cantor C, Vijg J, Zhavoronkov A. Deep biomarkers of human aging: Application of deep neural networks to biomarker development. Aging (Albany NY). 2016; 8:1021–33. https://doi.org/10.18632/aging.100968 [PubMed]
- 48. Husted KLS, Brink-Kjær A, Fogelstrøm M, Hulst P, Bleibach A, Henneberg KÅ, Sørensen HBD, Dela F, Jacobsen JCB, Helge JW. A Model for Estimating Biological Age From Physiological Biomarkers of Healthy Aging: Cross-sectional Study. JMIR Aging. 2022; 5:e35696. https://doi.org/10.2196/35696 [PubMed]
- 49. Nakamura E, Miyao K. A method for identifying biomarkers of aging and constructing an index of biological age in humans. J Gerontol A Biol Sci Med Sci. 2007; 62:1096–105. https://doi.org/10.1093/gerona/62.10.1096 [PubMed]
- 50. Mitnitski A, Howlett SE, Rockwood K. Heterogeneity of Human Aging and Its Assessment. J Gerontol A Biol Sci Med Sci. 2017; 72:877–84. https://doi.org/10.1093/gerona/glw089 [PubMed]
- 51. Levine ME, Higgins-Chen A, Thrush K, Minteer C, Niimi P. Clock Work: Deconstructing the Epigenetic Clock Signals in Aging, Disease, and Reprogramming. BioRxiv. 2022. https://doi.org/10.1101/2022.02.13.480245
- 52. Dick KJ, Nelson CP, Tsaprouni L, Sandling JK, Aïssi D, Wahl S, Meduri E, Morange PE, Gagnon F, Grallert H, Waldenberger M, Peters A, Erdmann J, et al. DNA methylation and body-mass index: a genome-wide analysis. Lancet. 2014; 383:1990–8. https://doi.org/10.1016/S0140-6736(13)62674-4 [PubMed]
- 53. Sun D, Zhang T, Su S, Hao G, Chen T, Li QZ, Bazzano L, He J, Wang X, Li S, Chen W. Body Mass Index Drives Changes in DNA Methylation: A Longitudinal Study. Circ Res. 2019; 125:824–33. https://doi.org/10.1161/CIRCRESAHA.119.315397 [PubMed]
- 54. Horvath S, Levine AJ. HIV-1 Infection Accelerates Age According to the Epigenetic Clock. J Infect Dis. 2015; 212:1563–73. https://doi.org/10.1093/infdis/jiv277 [PubMed]
- 55. Boulias K, Lieberman J, Greer EL. An Epigenetic Clock Measures Accelerated Aging in Treated HIV Infection. Mol Cell. 2016; 62:153–5. https://doi.org/10.1016/j.molcel.2016.04.008 [PubMed]
- 56. Gross AM, Jaeger PA, Kreisberg JF, Licon K, Jepsen KL, Khosroheidari M, Morsey BM, Swindells S, Shen H, Ng CT, Flagg K, Chen D, Zhang K, et al. Methylome-wide Analysis of Chronic HIV Infection Reveals Five-Year Increase in Biological Age and Epigenetic Targeting of HLA. Mol Cell. 2016; 62:157–68. https://doi.org/10.1016/j.molcel.2016.03.019 [PubMed]
- 57. Horvath S, Stein DJ, Phillips N, Heany SJ, Kobor MS, Lin DTS, Myer L, Zar HJ, Levine AJ, Hoare J. Perinatally acquired HIV infection accelerates epigenetic aging in South African adolescents. AIDS. 2018; 32:1465–74. https://doi.org/10.1097/QAD.0000000000001854 [PubMed]
- 58. Kukrety SP, Parekh JD, Bailey KL. Chronic obstructive pulmonary disease and the hallmarks of aging. Lung India. 2018; 35:321–7. https://doi.org/10.4103/lungindia.lungindia_266_17 [PubMed]
- 59. Zhong J, Agha G, Baccarelli AA. The Role of DNA Methylation in Cardiovascular Risk and Disease: Methodological Aspects, Study Design, and Data Analysis for Epidemiological Studies. Circ Res. 2016; 118:119–31. https://doi.org/10.1161/CIRCRESAHA.115.305206 [PubMed]
- 60. Higgins-Chen AT, Boks MP, Vinkers CH, Kahn RS, Levine ME. Schizophrenia and Epigenetic Aging Biomarkers: Increased Mortality, Reduced Cancer Risk, and Unique Clozapine Effects. Biol Psychiatry. 2020; 88:224–35. https://doi.org/10.1016/j.biopsych.2020.01.025 [PubMed]
- 61. Klengel T, Pape J, Binder EB, Mehta D. The role of DNA methylation in stress-related psychiatric disorders. Neuropharmacology. 2014; 80:115–32. https://doi.org/10.1016/j.neuropharm.2014.01.013 [PubMed]
- 62. Ambatipudi S, Cuenin C, Hernandez-Vargas H, Ghantous A, Le Calvez-Kelm F, Kaaks R, Barrdahl M, Boeing H, Aleksandrova K, Trichopoulou A, Lagiou P, Naska A, Palli D, et al. Tobacco smoking-associated genome-wide DNA methylation changes in the EPIC study. Epigenomics. 2016; 8:599–618. https://doi.org/10.2217/epi-2016-0001 [PubMed]
- 63. Elliott HR, Tillin T, McArdle WL, Ho K, Duggirala A, Frayling TM, Davey Smith G, Hughes AD, Chaturvedi N, Relton CL. Differences in smoking associated DNA methylation patterns in South Asians and Europeans. Clin Epigenetics. 2014; 6:4. https://doi.org/10.1186/1868-7083-6-4 [PubMed]
- 64. Wan ES, Qiu W, Baccarelli A, Carey VJ, Bacherman H, Rennard SI, Agusti A, Anderson W, Lomas DA, Demeo DL. Cigarette smoking behaviors and time since quitting are associated with differential DNA methylation across the human genome. Hum Mol Genet. 2012; 21:3073–82. https://doi.org/10.1093/hmg/dds135 [PubMed]
- 65. Gao X, Jia M, Zhang Y, Breitling LP, Brenner H. DNA methylation changes of whole blood cells in response to active smoking exposure in adults: a systematic review of DNA methylation studies. Clin Epigenetics. 2015; 7:113. https://doi.org/10.1186/s13148-015-0148-3 [PubMed]
- 66. Zhang Y, Schöttker B, Florath I, Stock C, Butterbach K, Holleczek B, Mons U, Brenner H. Smoking-Associated DNA Methylation Biomarkers and Their Predictive Value for All-Cause and Cardiovascular Mortality. Environ Health Perspect. 2016; 124:67–74. https://doi.org/10.1289/ehp.1409020 [PubMed]
- 67. Guida F, Sandanger TM, Castagné R, Campanella G, Polidoro S, Palli D, Krogh V, Tumino R, Sacerdote C, Panico S, Severi G, Kyrtopoulos SA, Georgiadis P, et al. Dynamics of smoking-induced genome-wide methylation changes with time since smoking cessation. Hum Mol Genet. 2015; 24:2349–59. https://doi.org/10.1093/hmg/ddu751 [PubMed]
- 68. White AJ, Kresovich JK, Keller JP, Xu Z, Kaufman JD, Weinberg CR, Taylor JA, Sandler DP. Air pollution, particulate matter composition and methylation-based biologic age. Environ Int. 2019; 132:105071. https://doi.org/10.1016/j.envint.2019.105071 [PubMed]
- 69. Wyzga RE, Rohr AC. Long-term particulate matter exposure: Attributing health effects to individual PM components. J Air Waste Manag Assoc. 2015; 65:523–43. https://doi.org/10.1080/10962247.2015.1020396 [PubMed]
- 70. Ding A, Yang Y, Zhao Z, Hüls A, Vierkötter A, Yuan Z, Cai J, Zhang J, Gao W, Li J, Zhang M, Matsui M, Krutmann J, et al. Indoor PM2.5 exposure affects skin aging manifestation in a Chinese population. Sci Rep. 2017; 7:15329. https://doi.org/10.1038/s41598-017-15295-8 [PubMed]
- 71. Dang MN, Buzzetti R, Pozzilli P. Epigenetics in autoimmune diseases with focus on type 1 diabetes. Diabetes Metab Res Rev. 2013; 29:8–18. https://doi.org/10.1002/dmrr.2375 [PubMed]
- 72. Ding J, Reynolds LM, Zeller T, Müller C, Lohman K, Nicklas BJ, Kritchevsky SB, Huang Z, de la Fuente A, Soranzo N, Settlage RE, Chuang CC, Howard T, et al. Alterations of a Cellular Cholesterol Metabolism Network Are a Molecular Feature of Obesity-Related Type 2 Diabetes and Cardiovascular Disease. Diabetes. 2015; 64:3464–74. https://doi.org/10.2337/db14-1314 [PubMed]
- 73. Al Muftah WA, Al-Shafai M, Zaghlool SB, Visconti A, Tsai PC, Kumar P, Spector T, Bell J, Falchi M, Suhre K. Epigenetic associations of type 2 diabetes and BMI in an Arab population. Clin Epigenetics. 2016; 8:13. https://doi.org/10.1186/s13148-016-0177-6 [PubMed]
- 74. Kriebel J, Herder C, Rathmann W, Wahl S, Kunze S, Molnos S, Volkova N, Schramm K, Carstensen-Kirberg M, Waldenberger M, Gieger C, Peters A, Illig T, et al. Association between DNA Methylation in Whole Blood and Measures of Glucose Metabolism: KORA F4 Study. PLoS One. 2016; 11:e0152314. https://doi.org/10.1371/journal.pone.0152314 [PubMed]
- 75. Travers ME, Mackay DJ, Dekker Nitert M, Morris AP, Lindgren CM, Berry A, Johnson PR, Hanley N, Groop LC, McCarthy MI, Gloyn AL. Insights into the molecular mechanism for type 2 diabetes susceptibility at the KCNQ1 locus from temporal changes in imprinting status in human islets. Diabetes. 2013; 62:987–92. https://doi.org/10.2337/db12-0819 [PubMed]
- 76. Breitling LP, Saum KU, Perna L, Schöttker B, Holleczek B, Brenner H. Frailty is associated with the epigenetic clock but not with telomere length in a German cohort. Clin Epigenetics. 2016; 8:21. https://doi.org/10.1186/s13148-016-0186-5 [PubMed]
- 77. Robertson T, Batty GD, Der G, Fenton C, Shiels PG, Benzeval M. Is socioeconomic status associated with biological aging as measured by telomere length? Epidemiol Rev. 2013; 35:98–111. https://doi.org/10.1093/epirev/mxs001 [PubMed]
- 78. Clegg A, Bates C, Young J, Ryan R, Nichols L, Ann Teale E, Mohammed MA, Parry J, Marshall T. Development and validation of an electronic frailty index using routine primary care electronic health record data. Age Ageing. 2016; 45:353–60. https://doi.org/10.1093/ageing/afw039 [PubMed]
- 79. Handforth C, Clegg A, Young C, Simpkins S, Seymour MT, Selby PJ, Young J. The prevalence and outcomes of frailty in older cancer patients: a systematic review. Ann Oncol. 2015; 26:1091–101. https://doi.org/10.1093/annonc/mdu540 [PubMed]
- 80. Sugden K, Hannon EJ, Arseneault L, Belsky DW, Corcoran DL, Fisher HL, Houts RM, Kandaswamy R, Moffitt TE, Poulton R, Prinz JA, Rasmussen LJH, Williams BS, et al. Patterns of Reliability: Assessing the Reproducibility and Integrity of DNA Methylation Measurement. Patterns (N Y). 2020; 1:100014. https://doi.org/10.1016/j.patter.2020.100014 [PubMed]
- 81. Logue MW, Smith AK, Wolf EJ, Maniates H, Stone A, Schichman SA, McGlinchey RE, Milberg W, Miller MW. The correlation of methylation levels measured using Illumina 450K and EPIC BeadChips in blood samples. Epigenomics. 2017; 9:1363–71. https://doi.org/10.2217/epi-2017-0078 [PubMed]
- 82. Bose M, Wu C, Pankow JS, Demerath EW, Bressler J, Fornage M, Grove ML, Mosley TH, Hicks C, North K, Kao WH, Zhang Y, Boerwinkle E, Guan W. Evaluation of microarray-based DNA methylation measurement using technical replicates: the Atherosclerosis Risk In Communities (ARIC) Study. BMC Bioinformatics. 2014; 15:312. https://doi.org/10.1186/1471-2105-15-312 [PubMed]
- 83. Naeem H, Wong NC, Chatterton Z, Hong MK, Pedersen JS, Corcoran NM, Hovens CM, Macintyre G. Reducing the risk of false discovery enabling identification of biologically significant genome-wide methylation status using the HumanMethylation450 array. BMC Genomics. 2014; 15:51. https://doi.org/10.1186/1471-2164-15-51 [PubMed]
- 84. Pidsley R, Zotenko E, Peters TJ, Lawrence MG, Risbridger GP, Molloy P, Van Djik S, Muhlhausler B, Stirzaker C, Clark SJ. Critical evaluation of the Illumina MethylationEPIC BeadChip microarray for whole-genome DNA methylation profiling. Genome Biol. 2016; 17:208. https://doi.org/10.1186/s13059-016-1066-1 [PubMed]
- 85. Higgins-Chen AT, Thrush KL, Wang Y, Minteer CJ, Kuo PL, Wang M, Niimi P, Sturm G, Lin J, Moore AZ, Bandinelli S, Vinkers CH, Vermetten E, et al. A computational solution for bolstering reliability of epigenetic clocks: Implications for clinical trials and longitudinal tracking. Nat Aging. 2022; 2:644–61. https://doi.org/10.1038/s43587-022-00248-2 [PubMed]
- 86. Thrush KL, Bennett DA, Gaiteri C, Horvath S, Dyck CHV, Higgins-Chen AT, Levine ME. Aging the brain: multi-region methylation principal component based clock in the context of Alzheimer's disease. Aging (Albany NY). 2022; 14:5641–68. https://doi.org/10.18632/aging.204196 [PubMed]
- 87. McInnes L, Healy J, Melville J. UMAP: Uniform Manifold Approximation and Projection for Dimension Reduction. ArXiv. 2018; arXiv:1802.03426. https://doi.org/10.48550/arXiv.1802.03426
- 88. Crimmins EM, Thyagarajan B, Levine ME, Weir DR, Faul J. Associations of Age, Sex, Race/Ethnicity, and Education With 13 Epigenetic Clocks in a Nationally Representative U.S. Sample: The Health and Retirement Study. J Gerontol A Biol Sci Med Sci. 2021; 76:1117–23. https://doi.org/10.1093/gerona/glab016 [PubMed]
- 89. Liu Z, Leung D, Thrush K, Zhao W, Ratliff S, Tanaka T, Schmitz LL, Smith JA, Ferrucci L, Levine ME. Underlying features of epigenetic aging clocks in vivo and in vitro. Aging Cell. 2020; 19:e13229. https://doi.org/10.1111/acel.13229 [PubMed]
- 90. Armstrong NJ, Mather KA, Thalamuthu A, Wright MJ, Trollor JN, Ames D, Brodaty H, Schofield PR, Sachdev PS, Kwok JB. Aging, exceptional longevity and comparisons of the Hannum and Horvath epigenetic clocks. Epigenomics. 2017; 9:689–700. https://doi.org/10.2217/epi-2016-0179 [PubMed]
- 91. Fang F, Zhou L, Perng W, Marsit CJ, Knight AK, Cardenas A, Aung MT, Hivert MF, Aris IM, Goodrich JM, Smith AK, Gaylord A, Fry RC, et al, and program collaborators for Environmental influences on Child Health Outcomes. Evaluation of pediatric epigenetic clocks across multiple tissues. Clin Epigenetics. 2023; 15:142. https://doi.org/10.1186/s13148-023-01552-3 [PubMed]
- 92. Lundberg SM, Lee SI. A unified approach to interpreting model predictions. Advances in neural information processing systems. 2017. https://doi.org/10.48550/arXiv.1705.07874
- 93. Boks MP, van Mierlo HC, Rutten BP, Radstake TR, De Witte L, Geuze E, Horvath S, Schalkwyk LC, Vinkers CH, Broen JC, Vermetten E. Longitudinal changes of telomere length and epigenetic age related to traumatic stress and post-traumatic stress disorder. Psychoneuroendocrinology. 2015; 51:506–12. https://doi.org/10.1016/j.psyneuen.2014.07.011 [PubMed]
- 94. Deelen J, Kettunen J, Fischer K, van der Spek A, Trompet S, Kastenmüller G, Boyd A, Zierer J, van den Akker EB, Ala-Korpela M, Amin N, Demirkan A, Ghanbari M, et al. A metabolic profile of all-cause mortality risk identified in an observational study of 44,168 individuals. Nat Commun. 2019; 10:3346. https://doi.org/10.1038/s41467-019-11311-9 [PubMed]
- 95. Marioni RE, Shah S, McRae AF, Chen BH, Colicino E, Harris SE, Gibson J, Henders AK, Redmond P, Cox SR, Pattie A, Corley J, Murphy L, et al. DNA methylation age of blood predicts all-cause mortality in later life. Genome Biol. 2015; 16:25. https://doi.org/10.1186/s13059-015-0584-6 [PubMed]
- 96. Noroozi R, Rudnicka J, Pisarek A, Wysocka B, Masny A, Boroń M, Migacz-Gruszka K, Pruszkowska-Przybylska P, Kobus M, Lisman D, Zielińska G, Iljin A, Wiktorska JA, et al. Analysis of epigenetic clocks links yoga, sleep, education, reduced meat intake, coffee, and a SOCS2 gene variant to slower epigenetic aging. Geroscience. 2024; 46:2583–604. https://doi.org/10.1007/s11357-023-01029-4 [PubMed]
- 97. Sehgal R, Markov Y, Qin C, Meer M, Hadley C, Shadyab AH, Casanova R, Manson JE, Bhatti P, Crimmins EM, Hägg S, Assimes TL, Whitsel EA, et al. Systems Age: A single blood methylation test to quantify aging heterogeneity across 11 physiological systems. bioRxiv. 2024; 2023.07.13.548904. https://doi.org/10.1101/2023.07.13.548904 [PubMed]