


Introduction
Lung cancer exhibits a substantial prevalence and fatality rate, with lung adenocarcinoma (LUAD) accounting for approximately 40% of all cases worldwide. According to projections made by the American Cancer Society, approximately 127,070 individuals are expected to succumb to lung cancer by the end of the year 2023, representing a substantial 20% of the total mortality attributed to cancer [1]. Currently, considerable advances have been achieved in the domain of LUAD treatment, with a particular focus on the development of personalized therapeutic strategies. Notable progress in this field encompasses the widespread implementation of immune checkpoint inhibitor (ICI) therapy and targeted therapy [2]. The effectiveness of immunotherapy in treating locally advanced and metastatic non-small cell lung cancer is restricted to only 20% of patients, primarily due to the complex and diverse characteristics of the tumors [3]. Consequently, the prognosis for LUAD remains unfavorable, resulting in a five-year survival rate of around 18% [4]. Therefore, there is a pressing need to enhance both the prognosis and treatment of LUAD.
Ribosomal proteins, particularly the ribosomal protein L22-like1 (RPL22L1), play a critical role in the pathogenesis of cancer [5, 6]. RPL22L1, a component of the 60S subunit regulated by RPL22, has been found to be significantly upregulated in glioblastoma (GBM) and hepatocellular carcinoma (HCC), leading to a poorer outcome for patients [7, 8]. RPL22L1 demonstrates prognostic significance in kidney renal clear cell carcinoma (KIRC), emerges as a key gene in the progression of prostate cancer (PRAD), and may serve as a potential target for therapeutic interventions in PRAD [9–11]. RPL22L1 may function as a prognostic marker for colorectal cancer (CRC) and has the potential to serve as a prognostic indicator and/or therapeutic target for ovarian cancer (OC) [12, 13]. However, the role and underlying mechanisms of RPL22L1 in LUAD remain unclear.
Currently, the precise involvement of RPL22L1 in LUAD remains uncertain. This study seeks to analyze the expression of RPL22L1 in pan-cancer and LUAD, utilizing data from the Cancer Genome Atlas (TCGA) database to evaluate its diagnostic relevance [8]. The study explores the relationship between RPL22L1 expression levels and clinical features, as well as prognosis in LUAD. The investigation delves into potential regulatory networks linked to RPL22L1, including its association with tumor microenvironment (TME), tumor mutational burden (TMB)/microsatellite instability (MSI), mRNA stemness index (mRNAsi), and drug sensitivity in LUAD [14]. We explore RPL22L1 expression in LUAD single-cell sequencing and the genomic variation and clinical significance of RPL22L1 in LUAD. The expression of RPL22L1 was validated using GSE87340. Next, RPL22L1 was transfected into the LUAD cell line and demonstrated by Western blot. The effects and mechanisms of RPL22L1 on the proliferation of LUAD cell lines in vitro and in vivo were explored by the CCK8 assay, clone formation, wound healing, transwell, flow cytometry, and xenografting assay.
Materials and Methods
Expression analysis of RPL22L1 in TCGA-LUAD in pan cancer and LUAD
A total of 539 patients diagnosed with LUAD and 59 normal tissue samples were obtained from TCGA [15, 16].
The RNAseq data in transcripts per million (TPM) format from TCGA (https://portal.gdc.cancer.gov) and GTEx were processed consistently using the Toil method and accessed via the UCSC XENA platform (https://xenabrowser.net/datapages/) [17]. Pan-cancer data from TCGA and normal tissue data from GTEx were extracted and processed using a log 2 (value + 1) transformation [15]. Visualization of the data was performed using the ggplot2 package, with statistical analysis conducted using the appropriate methods from the stats and car packages based on the data format characteristics [18].
The RNAseq data were retrieved and organized utilizing the STAR process of the TCGA-LUAD project, and subsequently converted into TPM format. The data were further processed by applying a log2 (value + 1) transformation.
The relationship between RPL22L1 and clinical features and its diagnostic value
We use software version R (4.2.1) for the statistics. The data filtering strategy was to remove normal and remove nonclinical information. Clinical factors examined were T stage, N stage, pathological stage, gender, age, and anatomical neoplasm subdivision.
Data were ROC-analyzed using the pROC package and the results were graphically represented using ggplot2 [19].
The relationship between RPL22L1 and the prognosis
Proportional risk hypothesis testing and fitted survival regressions were conducted utilizing the survival package, with the results visualized using the survminer and ggplot2 packages. Prognostic factors considered in the analysis included overall survival (OS), progression-free survival (PFS), and disease-specific survival (DSS) [18].
The forest plots were generated using the software R (version 3.6.3) and the ggplot2 package [20].
The nomogram plot was created utilizing the rms package and the survival package [21]. The prognostic type was OS. Variables include the T stage, pathological stage, tumor status, and RPL22L1.
Gene set enrichment analysis (GSEA)
We use the software R (version 4.2.1) and the R package clusterProfiler [4.4.4]. Following the conversion of molecule IDs in the input data, GSEA was carried out using the clusterProfiler package. The study focused on human (Homo sapiens) species, with a set of reference genes identified as c2.cp.all.v2022.1.Hs.symbols.gmt [All Canonical Pathways] (3050) [22–24].
The relationship between RPL22L1 and immune infiltration, immune score, and immune checkpoints
The immune infiltration of the cloud data was calculated based on the ssGSEA algorithm from the R package GSVA [1.46.0], using markers for 24 immune cells provided in reference [25].
The R (4.2.1) version and associated packages, including ggplot2 (3.3.6), stats (4.2.1), and car (3.1-0), were utilized for data processing in this study. Following the grouping of key variables, appropriate statistical methods from the stats and car packages were chosen based on the data format characteristics, with statistical analysis contingent upon meeting specific requirements. Data visualization was conducted using the ggplot2 package, and the statistical method employed was the Wilcoxon rank sum test. Additionally, matrix and immunity scores for cloud data were calculated using the R package-estimate [1.0.13] [26].
The RNAseq data (level 3) and corresponding clinical information of LUAD were obtained from TCGA. Transcripts associated with immune checkpoints, such as SIGLEC15, IDO1, CD274 (PD-L1), HAVCR2, PDCD1, CTLA4, LAG3, and PDCD1LG2, were identified [14, 27]. The expression values of the eight genes were extracted for the purpose of examining their association with immune checkpoint genes. Statistical analysis was conducted using R software version 4.0.3, with the rank sum test utilized to identify differences between the two data groups. A p-value of less than 0.05 was deemed statistically significant, unless specified otherwise.
The relationship between RPL22L1 and TMB/MSI and cancer stem cells (CSCs)
TMB serves as a measurable indicator of the quantity of mutations within cancer cells and is utilized in the evaluation of genomic instability [28, 29]. MSI, distinguished by heightened mutation rates at genomic microsatellites, is linked to deficiencies in the mismatch repair system. Various types of human cancers have been linked to MSI as a result of deficiencies in mismatch repair. Level 3 RNAseq data and the corresponding clinical information for LUAD were acquired from TCGA. Spearman’s correlation analysis was utilized to assess the association between non-normally distributed quantitative variables. Statistical significance was determined at a p-value threshold of less than 0.05 [14].
The mRNAsi was calculated using the one-class logistic regression (OCLR) algorithm, which incorporated mRNA expression features from gene expression profiles of 11,774 genes [30]. The resulting mRNAsi values were normalized to the [0,1] range through a linear transformation process involving subtraction of the minimum value and division by the maximum value, implemented using the Spearman correlation method [31].
Expression of RPL22L1 in single cells of LUAD
The Tumor Immune Single-cell Hub 2 (TISCH2) database, accessible at http://tisch.comp-genomics.org/, serves as an scRNA-seq repository tailored for the investigation of the TME [14, 32]. TISCH2 offers comprehensive cell type annotations at the individual cell level, facilitating the examination of the TME in various cancer contexts [33].
Genomic variants analysis of RPL22L1 in LUAD
RNA sequencing data (level 3), mutation MAF data, and associated clinical information for LUAD were acquired from TCGA. Somatic mutations in LUAD patients were retrieved and visualized utilizing the maftools package within the R software environment. Horizontal histograms depicted a notable prevalence of mutations among individuals diagnosed with LUAD.
Validation of RPL22L1 expression in the GEO database
In order to confirm the expression of RPL22L1 in LUAD, the dataset GSE87340 was employed, which consisted of 28 tumor samples and 26 normal samples [34].
Cell culture
Human LUAD cell lines HCC-827, H1299, A549, and H1975 were obtained from Beijing ChosenMed Clinical Laboratory Co., Ltd. These cell lines were cultured in DMEM medium (Sigma, USA) with 10% fetal bovine serum (FBS) and maintained at 37° C with 5% CO2 [35].
Cell transfection
The primer information was as follows:
RPL22L1-siRNA1-SS sequence: GGGAGAAGGUUAAAGUCAAUG,
RPL22L1-siRNA1-AS sequence: UUGACUUUAACCUUCUCCCGU;
RPL22L1-siRNA2-SS sequence: CACAGUUGUUUCUGAGAAACA,
RPL22L1-siRNA2-AS sequence: UUUCUCAGAAACAACUGUGAU;
RPL22L1-siRNA3-SS sequence: CCAGAUUAGUCAAGAUGAAGA;
RPL22L1-siRNA3-AS sequence: UUCAUCUUGACUAAUCUGGAA.
The cancer cells were transfected with Lipofectamine 2000 (Thermo Fisher Scientific, USA) following manufacturer instructions, and the experiment was carried out after 24 h of incubation [36].
Western blot
The Western blot experiments followed a published protocol, repeated three times. Cells were lysed with RIPA buffer to extract total protein, protein concentration was measured with a BCA kit, and 30 μg of protein were separated using SDS-PAGE and transferred to a PVDF membrane [36].
Subsequently, the membrane was blocked with 5% skimmed milk powder (P0216, Beyotime, China) at room temperature for 1h before the introduction of antibodies for incubation. Finally, color development was achieved using the enhanced chemiluminescence (ECL) chemical hypersensitivity chromogenic reagent kit. Primary antibodies used in this study were rabbit anti-human RPL22L1, mouse MDM2, p-MDM2, p53, and β-actin. The secondary antibody was goat anti-rabbit IgG. Protein band quantification was done with ImageJ software.
CCK8 and colony formation assay
The CCK-8 assay kit was used to measure cell viability. Cells were seeded in 96-well plates at 2 × 10³ cells/well and treated with 10 μL of CCK-8 solution after 0, 24, 48, and 72 h of culture. Absorbance at 450 nm was then measured after a 2 h incubation at 37° C [36].
Cells were digested with 0.25% trypsin and seeded into DMEM medium with 10% FBS at a density of 8 × 10² cells per well. After 2 weeks of culture, colonies were fixed with paraformaldehyde, stained with crystal violet, and counted [36]. Colony formation efficiency was calculated as the ratio of colonies formed to cells seeded, multiplied by 100%.
Wound healing assay and transwell invasion assay
A549 cells transfected with siRNA were seeded in 6-well plates and observed under a microscope at 0, 24, and 48 h to measure scratch healing area using Image J software.
A549 cells were seeded in a transwell chamber at a density of 3 × 10⁴ cells/well and incubated for 24 h. The inner chamber had 100 μL of cell suspension, while the outer chamber had 600 μL of 1640 medium with 20% FBS. Noninvasive cells in the upper chamber were removed, and the remaining cells on the membrane were fixed with 4% paraformaldehyde and stained with 0.1% crystal violet. Following this, the cells were subjected to examination under a 100 × microscope, and images were captured from five randomly selected fields of view [37].
Flow cytometry
Quantification of apoptosis levels was performed following the established methodology [18]. The cells were cultured with Annexin-V labeled with FITC (20 μg/mL) and 5 μL PI (50 μg/mL), and subsequently analyzed using a FACSCalibur cytometer [36].
Tumor xenograft growth assay in vivo
Animal experiments followed Nanjing Drum Tower Hospital’s ethics committee guidelines. Caki-1 cells transfected with pcDNA3.1-TPD52 or pcDNA3.1 were injected into female Balb/C nude mice [38]. Tumor volume was measured every 5 days using a specific formula. After approximately 20 days, tumors were weighed after mice were anesthetized [38].
Immunohistochemistry
The study used FFPE samples and incubated tumor sections with rabbit polyclonal antibodies against RPL22L1 at a dilution of 1/100 overnight at 4° C [39]. The sections were then conjugated with HRP-Sheep Anti-Rabbit IgG-HRP-Sheep Anti-Mouse IgG antibody at a dilution of 1:500 and treated with DAB [39]. The Elivision plus kit for IHC was used [39].
Statistical analysis
The analytical methods and R packages utilized in this study were executed using R software version 4.0.3 (R Foundation for Statistical Computing, 2020) [40]. Statistical analyses involved the application of the Wilcoxon signed rank test and the t-test. Results with p-values below 0.05 were considered statistically significant [34, 41, 42].
Data availability
All data generated or analyzed during this study are included in this article.
Results
Aberrant expression of RPL22L1 in LUAD and correlation with clinical characteristics
The clinical characteristics of TCGA-LUAD, such as T stage, N stage, pathologic stage, gender, age, anatomic neoplasm subdivision, and RPL22L1, were gathered for analysis in this study, as presented in Supplementary Table 1. Figure 1A and Supplementary Table 2 illustrates a comprehensive examination of RPL22L1 expression across various cancer types, indicating a notable up-regulation in 26 tumors and a significant down-regulation in 2 tumors. Thus, it can be deduced that the aberrant expression of RPL22L1 is intricately linked to tumor progression. Data depicted in Figure 1B indicate a statistically significant increase in the expression level of RPL22L1 in LUAD tumor tissues compared to unpaired normal tissues (p < 0.001). The results presented in Figure 1C reveal a notable elevation in the expression level of RPL22L1 in LUAD tumor tissues in comparison to corresponding normal tissues (p < 0.001). Figure 1D illustrates an area under the curve (AUC) value of 0.826 for RPL22L1, suggesting its potential as a dependable biomarker for distinguishing LUAD from normal liver tissues.
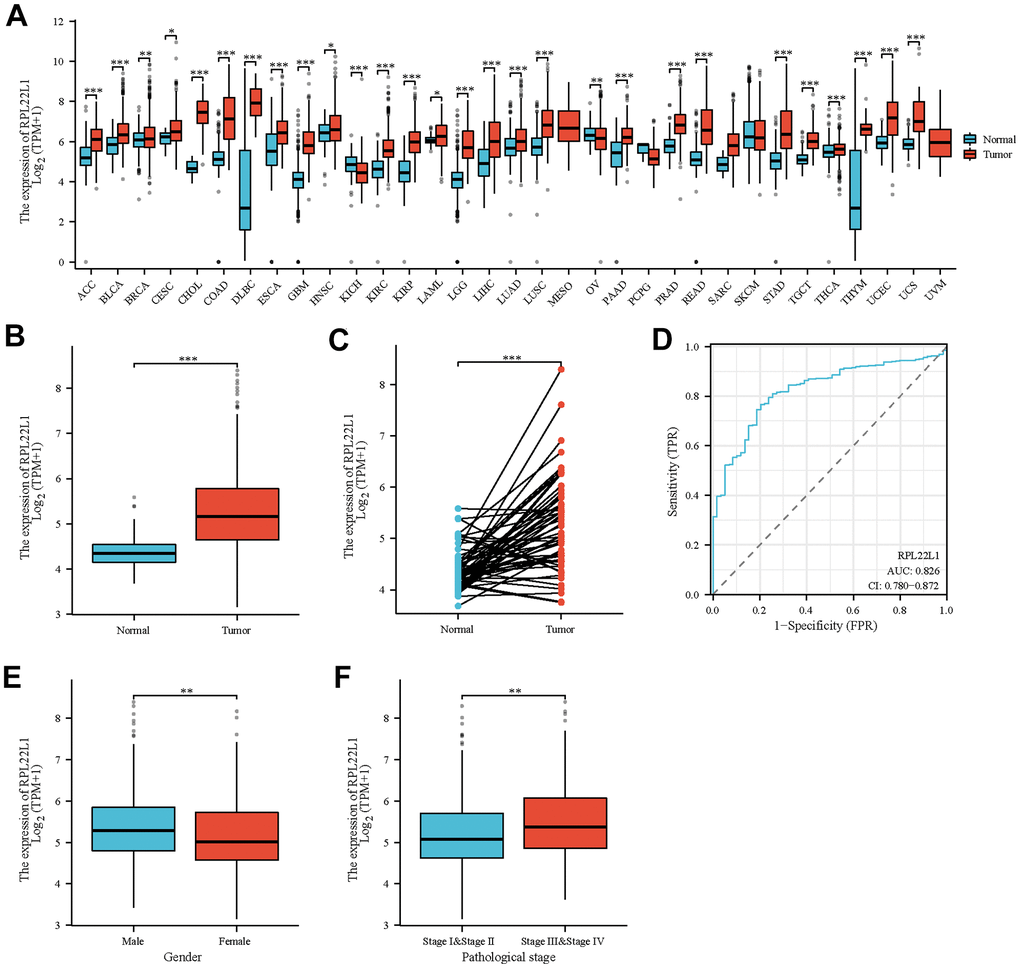
Figure 1. Abnormal expression of RPL22L1 in LUAD and its correlation with various clinical features. (A) Differential expression of RPL22L1 in pan cancer and normal tissues. (B) Specific differential expression of RPL22L1 in LUAD and normal lung tissue. (C) Differential expression of RPL22L1 in LUAD and its paired normal lung tissues. (D) The efficacy of RPL22L1 expression in distinguishing LUAD tissue from non-tumor tissue is shown by the ROC curve. (E, F) represent T stage and pathological stage, respectively. The statistical significance is represented by *, p < 0.05, * *, p < 0.01, * * *, and p < 0.001, respectively.
In order to examine the clinical attributes linked to RPL22L1, an analysis was conducted to evaluate the relationship between the expression of RPL22L1 and diverse factors in individuals diagnosed with LUAD. The results, as delineated in Supplementary Table 3 and Figure 1E, 1F, demonstrate a notable correlation between elevated levels of RPL22L1 and both pathological stage (p = 0.008) and gender (p = 0.004) among LUAD patients.
RPL22L1 was significantly associated with prognosis in TCGA-LUAD patients
Moreover, an examination was conducted on the OS, PFS, and DSS of patients diagnosed with LUAD. It was observed that patients exhibiting elevated levels of RPL22L1 experienced significantly poorer OS (p = 0.005, Figure 2A), PFS (p = 0.027, Figure 2B), and DSS (p = 0.015, Figure 2C). These findings suggest that RPL22L1 may serve as a potential prognostic marker for predicting unfavorable outcomes in LUAD, thereby offering valuable insights for the advancement of treatment strategies for this disease. Univariate and multifactorial Cox regression analyses revealed significant associations between pathologic T stage, N stage, pathological stage, and RPL22L1 expression with OS in patients with LUAD (Figure 2D and Supplementary Table 4). Specifically, the results indicated that tumor status and RPL22L1 expression are independent risk factors influencing the prognosis of LUAD patients. Integrating RPL22L1 expression with clinical variables facilitated the creation of column line plots, depicted in Figure 2E, which enabled the prediction of 1-, 3- and 5-year survival probabilities among LUAD patients.
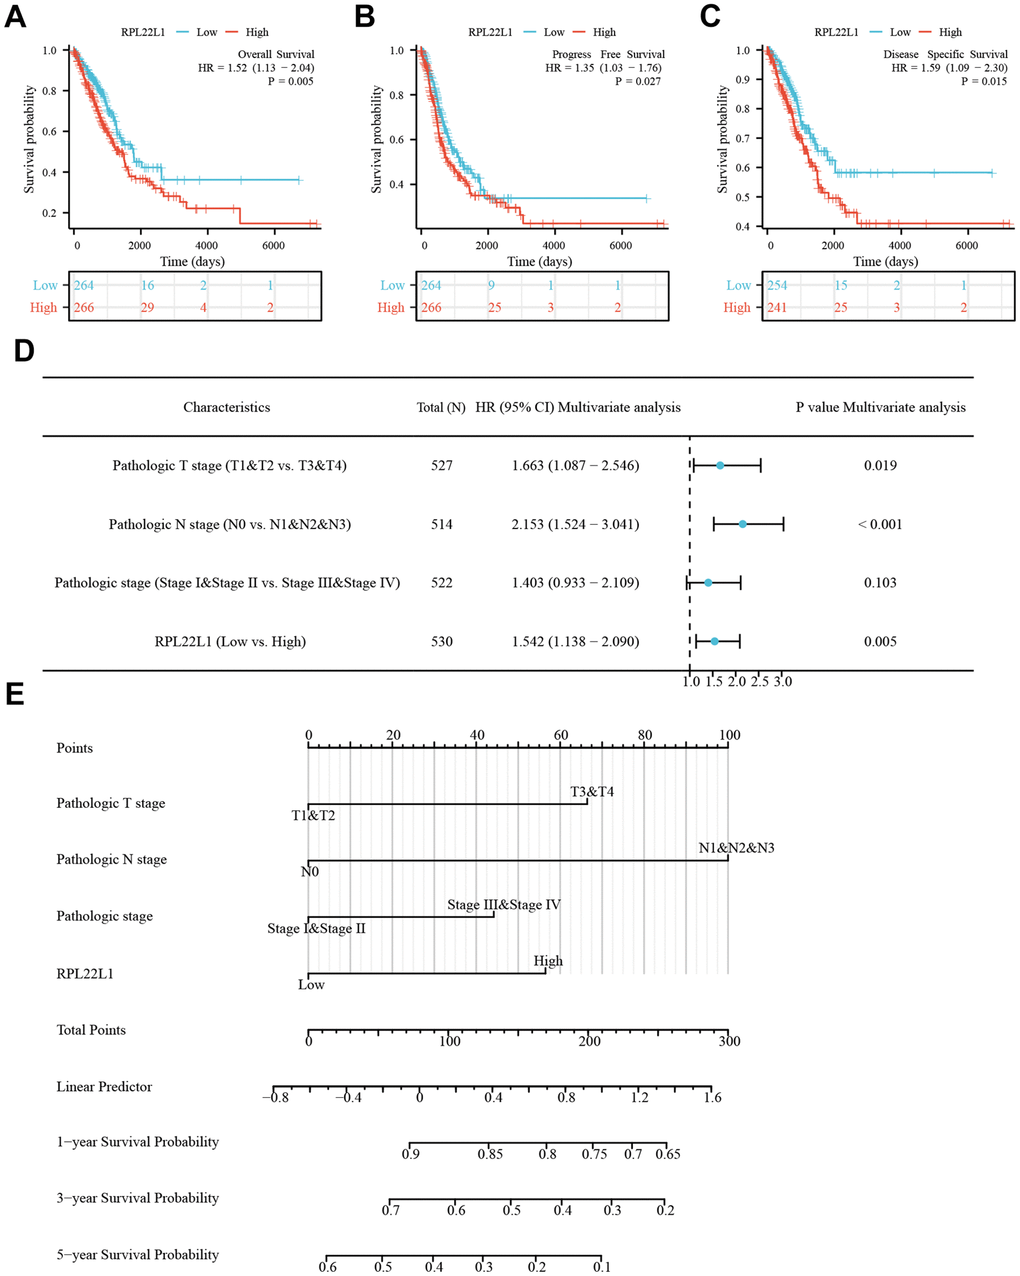
Figure 2. RPL22L1 was an independent variable for predicting OS in LUAD. (A) OS. (B) PFS. (C) DSS. (D) Forest plot display of the results of the multivariate Cox regression analysis of RPL22L1 and clinical characteristics in LUAD. (E) Nomograms were developed to estimate the likelihood of OS at 1-, 3-, and 5-year intervals in patients with LUAD.
Pathways involved in RPL22L1 in TCGA-LUAD
To elucidate the potential mechanism underlying the role of RPL22L1 in LUAD, a set of genes related to RPL22L1 was obtained by GSEA analysis. The pathways significantly associated with RPL22L1 included ribosome, spliceosome, cell cycle, oxidative phosphorylation, Parkinson’s disease, olfactory transduction, and pyrimidine metabolism (Figure 3).
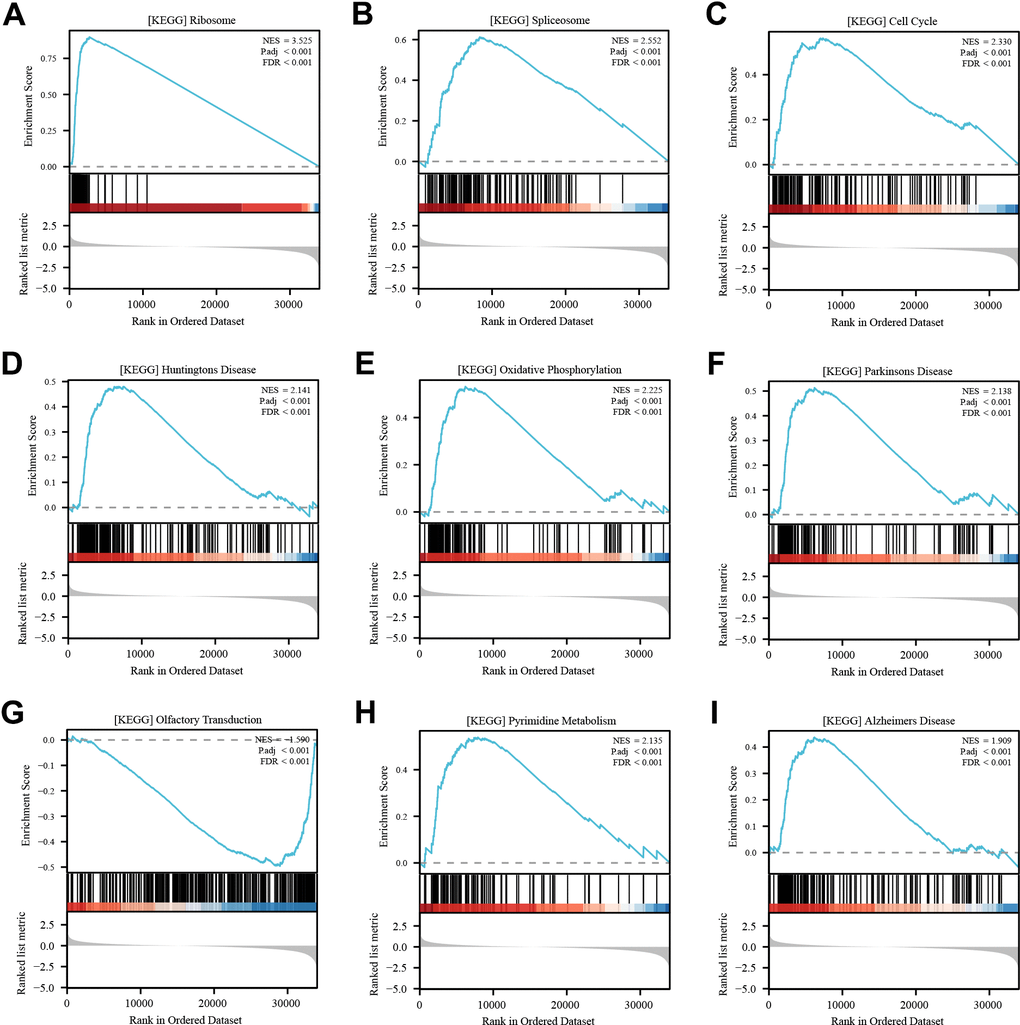
Figure 3. Enrichment analysis of RPL22L1 (GSEA). (A) Ribosome. (B) Spliceosome. (C) Cell cycle. (D) Huntington’s disease. (E) Oxidative phosphorylation. (F) Parkinsons disease. (G) Olfactory transduction. (H) Pyrimidine metabolism. (I) Alzheimer's disease. NES, which stands for normalized ES, and FDR, which stands for false discovery rate, were utilized in this study.
RPL22L1 was significantly associated with immune infiltration, immune score, and immune checkpoint genes
Figure 4A demonstrated a notable positive correlation (p < 0.0001) between the expression of RPL22L1 and Th2 cells. The data presented indicates a significant inverse relationship between the expression of RPL22L1 and various immune cell types, including B cells, Eosinophils, iDC, Macrophages, Mast cells, NK cells, Tcm, Tem, and TFH (p < 0.05 for all). The group with low RPL22L1 expression exhibited elevated stromal score, immune score, and ESTIMATE score (Figure 4B). Figure 4C demonstrates a notable negative correlation between RPL22L1 expression and SIGLEC15 and TIGIT.
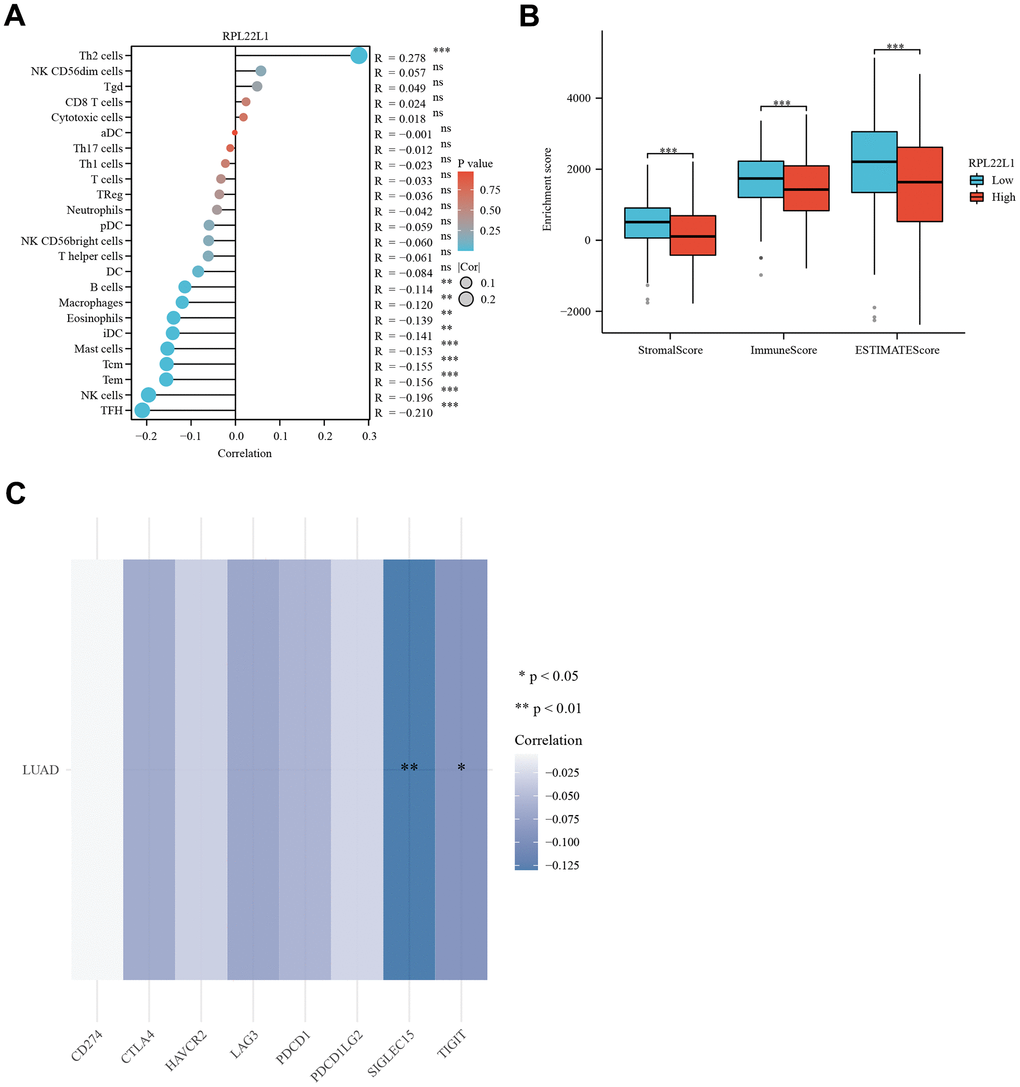
Figure 4. RPL22L1 expression was associated with immune infiltration, immune score, and immune checkpoint genes in LUAD. (A) Lollipop plot. (B) Grouped comparison plots. (C) Check point genes. Statistical significance was denoted by asterisks, with *, **, and *** representing p-values less than 0.05, 0.01, and 0.001, respectively.
Expression of RPL22L1 was significantly correlated with TMB/MSI and CSCs
In LUAD, the expression of RPL22L1 exhibited a notable inverse association with MSI and a marked positive relationship with TMB, as depicted in Figure 5A, 5B, respectively.
The progression of cancer entails the gradual deterioration of a distinct phenotype and the adoption of traits reminiscent of progenitor/stem cells. To assess the degree of stemness in a given sample, we utilized OCLR machine learning to compute a stemness index derived from the sample’s transcriptome. Our analysis, depicted in Figure 5C, demonstrated a statistically significant correlation between the expression of RPL22L1 and cancer stem cells (p = 2.95e-19).
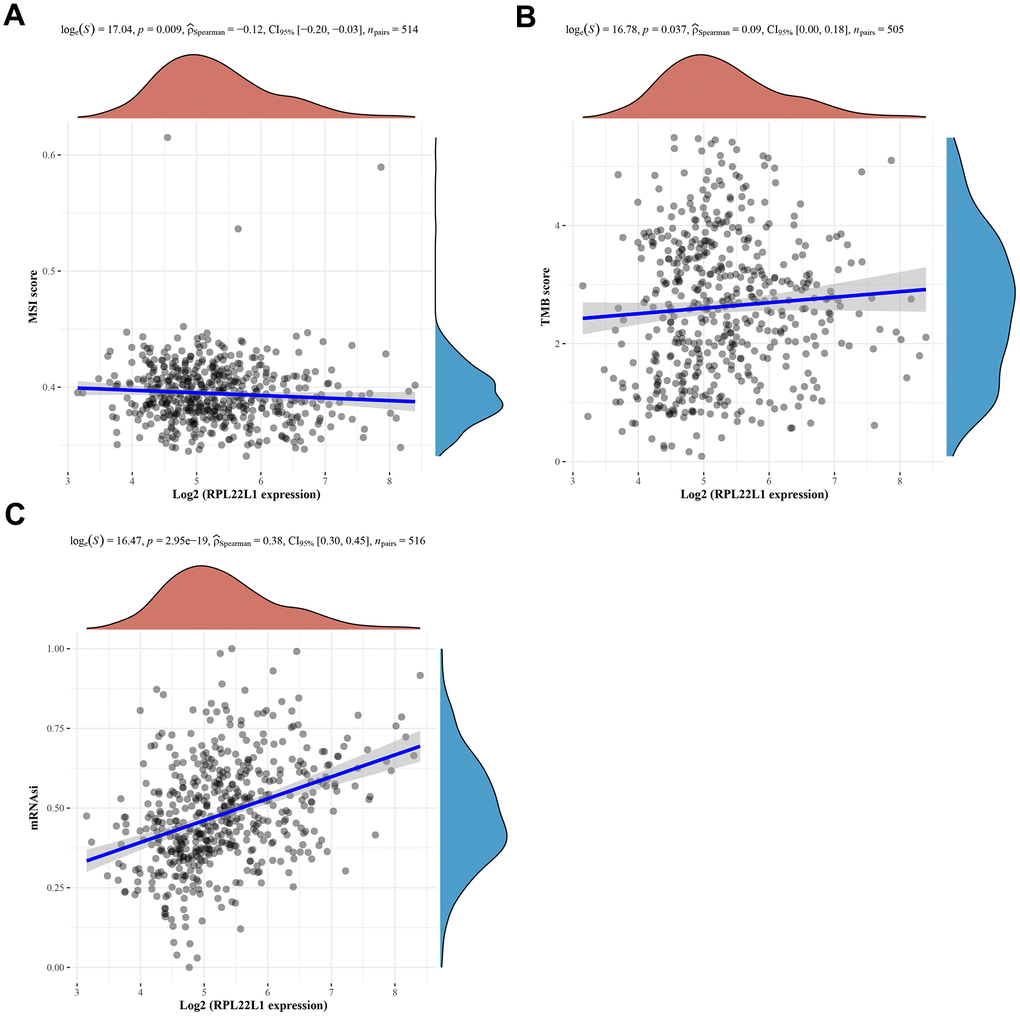
Figure 5. Spearman correlation analysis of MSI/TMB and mRNAsi and RPL22L1 gene expression in LUAD. (A) MSI. (B) TMB. (C) mRNAsi. The figure displays the gene expression distribution on the horizontal coordinates and the mRNAsi distribution on the vertical coordinates. The density curve on the right side represents the trend of the mRNAsi distribution, while the density curve on the upper side represents the trend of the gene expression distribution. The uppermost values in the figure indicate the correlation p-value, correlation coefficient, and the method used for correlation calculation.
RPL22L1 exhibited substantial upregulation in LUAD single cells and demonstrated a correlation with immune infiltration
As shown in Figure 6, the RPL22L1 gene was upregulated in multiple individual cells of LUAD, including CD4Tconv, Treg, Tprolif, CD8T, CD8Tex, NK, B, Plasma, DC, Mono/Macro, Mast, Endothelial, Fibroblasts, Myofibroblasts, Epithelial, Malignant, Oligodendrocyte, and Alveolar.
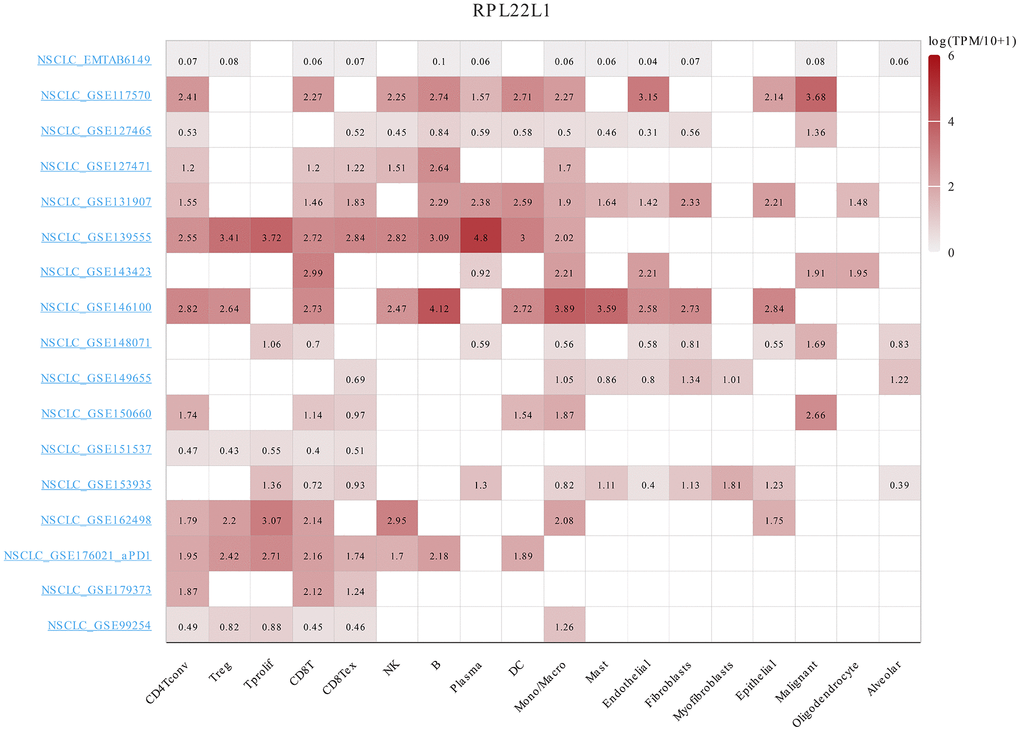
Figure 6. The expression of RPL22L1 was related to immune infiltration in LUAD single cells.
Somatic variants of RPL22L1 in LUAD
According to the data presented in Figure 7A, the frequency of variation in RPL22L1 was found to be 4%, with amplification, splice mutation, deep deletion, and truncation mutation being the types of variation observed. Figure 7B illustrates that the variant sites of RPL22L1 included 2 splices and 1 truncating mutation. Figure 7C demonstrates that gene alterations in RNY5P3, TNIK, SLC2A2, EIF5A2, RN7SL141P, CLDN11, PLD1, SLC7A14, TMEM212 and FNDC3B were more prevalent in the altered group of RPL22L1 compared to the unaltered group of RPL22L1. Figure 7D reveals a significant decrease in PFS among LUAD patients in the altered group RPL22L1 (n = 18) compared to the unaltered group RPL22L1 (n = 487), with a p-value of 0.0155.

Figure 7. Genetic alterations of RPL22L1 in LUAD. (A) This study examines the presence of structure variants, mutations, and copy number alterations in the gene RPL22L1. (B) The aim of this research is to provide a comprehensive description of the various types, number, and location of mutations occurring in the gene RPL22L1. (C) The frequency of gene alterations is assessed in both the RPL22L1 altered and unaltered groups, in order to determine their association with the gene RPL22L1. (D) A comparative analysis of progression free survival is conducted between the RPL22L1 altered group and the RPL22L1 unaltered group in pan cancer cases.
RPL22L1 was significantly overexpressed in LUAD
Figure 8A demonstrates a significant upregulation of RPL22L1 expression in LUAD tissues compared to normal lung tissues (p < 0.001). Figure 8B illustrates a correlation between high RPL22L1 expression and poor OS (p = 0.039).

Figure 8. High expression of RPL22L1 in GSE87340 suggests a poor prognosis. (A) The expression of RPL22L1 in GSE87340. (B) OS.
RPL22L1 promotes cell proliferation, migration, and invasion in LUAD cell lines
Figure 9A shows the expression of RPL22L1 in lung adenocarcinoma cell lines. The highest expression level of RPL22L1 was observed in the A549 cell line. Following silencing of RPL22L1, there was a significant decrease in the expression of RPL22L1 (Figure 9B). The group in which RPL22L1 was silenced exhibited a reduction in cell activity compared to the control group (Figure 9C). Compared to the control group, the RPL22L1 silencing group showed weaker proliferation, migration, and invasion abilities (Figure 9D–9H). Furthermore, the RPL22L1 silencing group demonstrated an increase in apoptosis compared to the control group (Figure 9I).
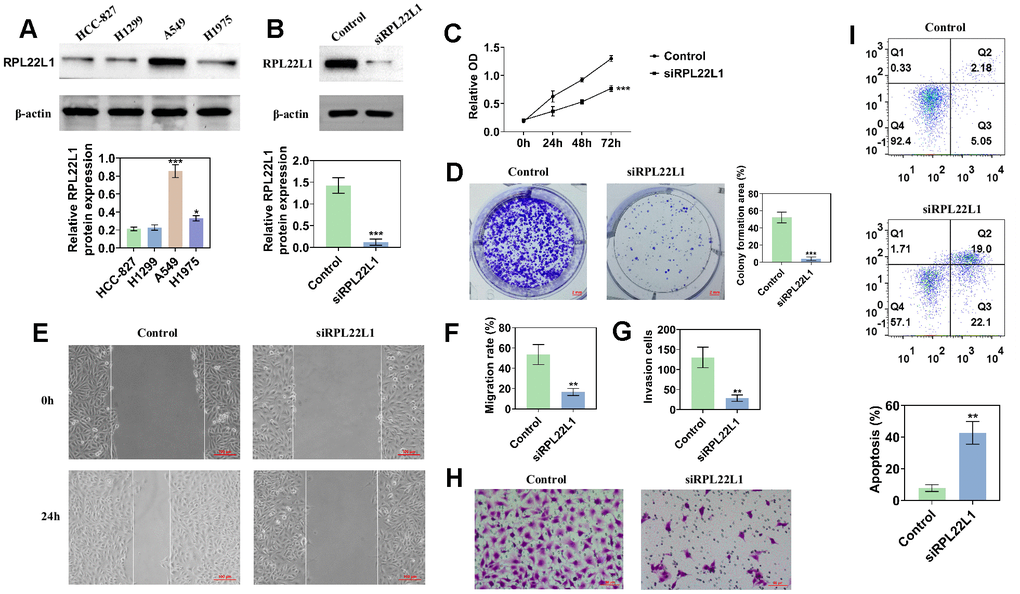
Figure 9. The knockdown of RPL22L1 in A549 cells was found to enhance their proliferation, migration, and invasion. (A) Western blot analysis was conducted to assess the expression of RPL22L1 in LUAD cell lines. (B) The knockdown efficiency of RPL22L1 in A549 cells was evaluated using Western blot analysis. (C) The impact of RPL22L1 knockdown on the viability of A549 cells was determined through a cell viability assay. (D) Cloning experiments were performed to investigate the effect of RPL22L1 knockdown on the proliferation ability of A549 cells. (E, F) The wound healing assay demonstrated the impact of PRL22L1 knockdown on the migratory behavior of A549 cells. (G, H) Transwell assays revealed that RPL22L1 knockdown had the potential to decrease the invasive capabilities of A549 cells. (I) Flow cytometry analysis provided insights into the influence of PRL22L1 knockdown on apoptosis in A549 cells. Statistical significance was denoted by *p < 0.05, **p < 0.01, and ***p < 0.001.
RPL22L1 increases the growth of xenograft tumors in vivo
In order to investigate the impact of RPL22L1 on LUAD growth in vivo, xenograft tumors were utilized in Balb/C nude mice. Notably, the suppression of RPL22L1 through silencing resulted in a significant inhibition of tumor weight and volume compared to the vector group (Figure 10A, 10B, 10D). Furthermore, we observed fewer invasions of neighboring tissues by A549 cells transfected with siRPL22L1 (Figure 10C).
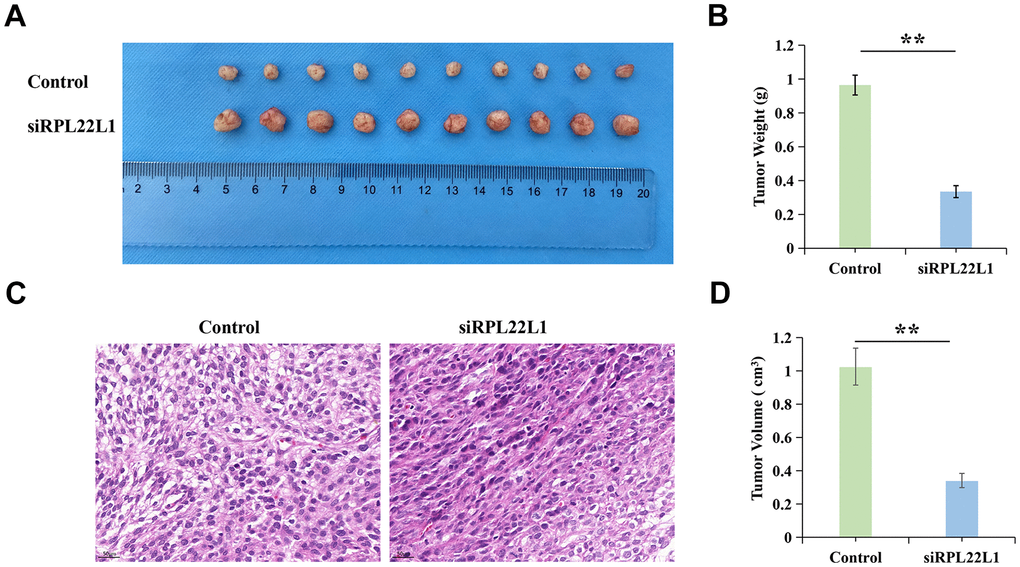
Figure 10. RPL22L1 can increase the growth of xenograft tumors in vivo. (A) Images of tumors in the control group and siRPL22L1 group. (B) Compared with the control group, the siRPL22L1 group showed a significant decrease in tumor weight. (C) Immunohistochemical images of the control group and siRPL22L1 group. (D) The siRPL22L1 group exhibited a statistically significant reduction in tumor volume when compared to the control group. **, P<0.01.
RPL22L1 can activate MDM2/p53
In contrast to the control group, the RPL22L1 silenced group exhibited no alteration in MDM2 expression, but a marked decrease in p-MDM2 expression and a significant increase in p53 expression (Figure 11A). The group with low expression, when compared to the control group, displayed diminished cellular activity, reduced proliferation, migration, and invasion capacities, and enhanced apoptosis (Figure 11B–11F). In comparison to the low expression group, the group exhibiting low expression combined with an inhibitor demonstrated heightened cellular activity, enhanced proliferation, migration, and invasion capabilities, as well as decreased apoptosis (Figure 11B–11F).
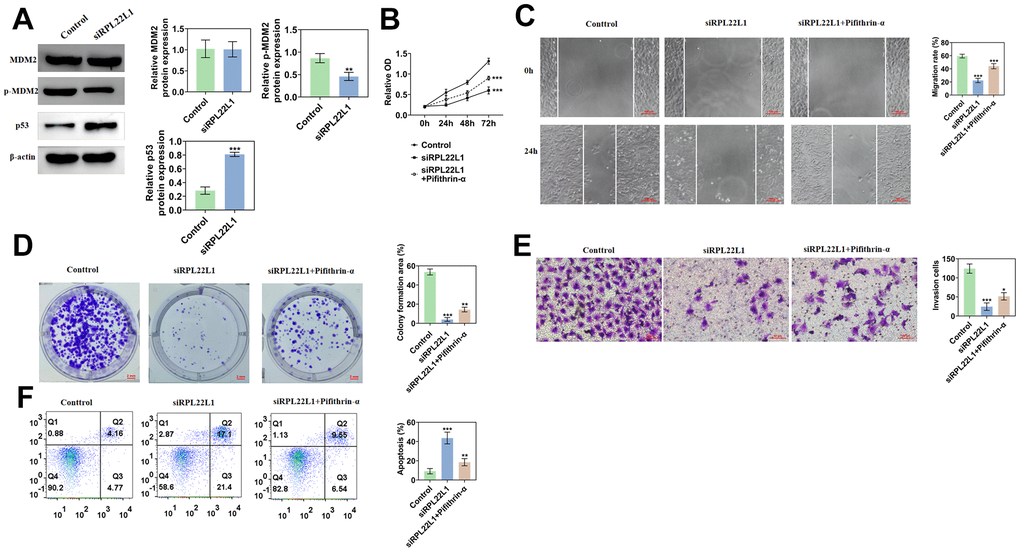
Figure 11. RPL22L1 can activate MDM2/p53. (A) Western blotting showed the effect of PRL22L1 knockdown on the expression of MDM2/p53. (B) The CCK-8 experiment demonstrated the impact of RPL22L1 knockdown in combination with pifithrin-α on the proliferative capacity of A549 cells. (C) The wound healing assay revealed the influence of PRL22L1 knockdown in conjunction with pifithrin-α on the migratory ability of A549 cells. (D) The cloning experiments exhibited the effect of PRL22L1 knockdown in combination with pifithrin-α on the proliferation capability of A549 cells. (E) The transwell experiment demonstrated the impact of PRL22L1 knockdown in conjunction with pifithrin-α on the invasive potential of A549 cells. (F) The flow cytometry analysis revealed the influence of PRL22L1 knockdown in combination with pifithrin-α on the apoptotic ability of A549 cells. *, p < 0.05, **, p < 0.01; ***, p < 0.001.
Discussion
The precise function of RPL22L1 in LUAD remains uncertain. Recent research has revealed a significant upregulation of RPL22L1 expression at the mRNA and protein levels in both LUAD tissues and cell lines. Knockdown of RPL22L1 has been shown to suppress the activity, proliferation, migration, and invasion of LUAD cells, induce apoptosis, and attenuate tumor growth in LUAD xenografts in mice. Mechanistically, the inhibition of RPL22L1 has been found to markedly reduce MDM2 phosphorylation and increase P53 levels in LUAD cells.
Lung cancer is a prevalent global disease, with LUAD accounting for approximately 40% of the reported cases [2]. The present study introduces a robust biomarker, namely RPL22L1, which exhibits elevated expression in LUAD patients, aligning with its increased expression in PRAD, HCC, CRC, KIRC, and OC [7, 9–13]. Our study demonstrates a significant increase in the expression of RPL22L1 at the mRNA and protein levels in both LUAD tissues and cell lines. Inhibition of RPL22L1 significantly impeded the activity, proliferation, migration, and invasion of LUAD cells, while also promoting apoptosis and reducing the growth of LUAD xenografts. These findings strongly support the notion that RPL22L1 acts as a crucial factor in promoting tumor progression in LUAD. In particular, this study represents the initial identification of a notable upregulation of RPL22L1, the elucidation of its biological function and the assessment of its impact on the immune status of LUAD patients.
This study has contributed further insights into the relationship between RPL22L1 and prognosis, revealing that elevated RPL22L1 expression is associated with a less favorable prognosis in LUAD. Through univariate and multivariate Cox regression analyses, the expression of RPL22L1 was determined to be an independent prognostic factor in LUAD. However, it is important to acknowledge that a single factor cannot provide a comprehensive and precise assessment of the prognosis of the tumor. Therefore, to address this limitation, a column line graph was employed that incorporates RPL22L1 expression and pertinent clinical data. Therefore, there is compelling evidence that RPL22L1 is an independent predictor of the prognosis of LUAD.
The research introduced the immune-based assay “Immunoscore” to measure T-cell infiltration in situ, demonstrating its superior efficacy over TNM classification in individuals with cancer [43]. Our results reveal a notable reduction in stromal score, immune score, and ESTIMATE score among those in the high-expression group of RPL22L1. Patients with elevated RPL22L1 expression in LUAD exhibit diminished immune and stromal elements in their tumor microenvironment, suggesting a potential association between heightened RPL22L1 expression and compromised immune status in LUAD patients.
The investigation of immune infiltration in LUAD has emerged as a significant research focus [44]. Immunotherapy has demonstrated potent antitumor effects across various cancer types [45]. While immune checkpoint inhibitors (ICIs) have shown promising efficacy in LUAD, ongoing research is exploring additional immunotherapeutic approaches for patients with this disease [46]. The primary objective of this study was to examine the correlation between RPL22L1 expression and immune responses in patients with LUAD. Our findings suggest that RPL22L1 expression in LUAD is associated with the infiltration of diverse immune cell populations.
The documented involvement of immune checkpoints in physiological immune responses, their up-regulation in the TME of various malignant tumors, and subsequent induction of antitumor immune responses have led to significant improvements in patient prognosis in clinical settings through the use of ICIs [47]. Our findings demonstrate a negative correlation between RPL22L1 and the SIGLEC15 and TIGIT immune checkpoints indicating the significant immunomodulatory role of RPL22L1 and its potential as a biomarker for immunotherapy.
TMB is an emerging immunotherapy biomarker in addition to PD-L1 expression. MSI, as the most important biomarker for the precise diagnosis and treatment of pan tumors, is also closely related to the incidence of LUAD. Although the research on MSI in lung cancer is not yet mature compared to CRC, and the incidence of MSI-H varies between different studies (0.4% -29%), MSI detection is increasingly valued in patients with LUAD. The study investigated the association between RPL22L1 expression and MSI and TMB in LUAD. The results indicated a significant relationship between RPL22L1 expression and MSI and TMB in LUAD. Specifically, RPL22L1 expression in LUAD was positively correlated with TMB and negatively correlated with MSI, suggesting that RPL22L1 may serve as a potential biomarker for assessing the immunogenicity of LUAD.
RPL22L1 promotes resistance to temozolomide in glioblastoma by activating STT3 [8]. RPL22L1 plays a significant role in facilitating the proliferation and invasion of PRAD cells via the PI3K/Akt/mTOR pathway [10]. RPL22L1 is implicated in activating ERK to promote atypical epithelial mesenchymal transition (EMT) progression [7]. RPL22L1 is essential for maintaining the aggressive OC phenotype and for triggering cell metastasis by inducing EMT [13]. The regulatory mechanism governing RPL22L1 expression in LUAD remains unexplored. As a ‘genome guardian’, P53 plays a crucial role in the cellular stress response network, including monitoring ribosomal biogenesis [48]. MDM2, an E3 ubiquitin ligase, plays a crucial role in targeted protein-dependent proteome degradation [49]. It mediates the rapid degradation of p53 and regulates the stability and function of the P53 protein by directly inhibiting its transcriptional activity through binding to the transcriptional activation regions and target P53 [50, 51]. The MDM2-P53 pathway is significantly involved in tumor progression [52]. LINC01426 exacerbates the malignant progression of glioma by modulating the miR-661/MDM2/P53 axis [53]. Current research shows that silencing RPL22L1 significantly down-regulates the expression level of p-MDM2 in A549 cells and up-regulates the protein expression level of P53. Notably, RPL22L1 is implicated in enhancing the growth and metastasis of LUAD by inhibiting the MDM2/P53 signaling pathway.
Consequently, these findings propose that targeting RPL22L1 could offer potential as a therapeutic strategy for managing LUAD.
Conclusions
In LUAD, RPL22L1 exhibited significant up-regulation and displayed a notable correlation with unfavorable OS, PFS, and DSS. RPL22L1 was associated with the TME, TMB/MSI, and mRNAsi. Patients with LUAD in the altered RPL22L1 group had a shorter PFS compared to those in the unaltered RPL22L1 group. Mechanistically, RPL22L1 was found to enhance cell proliferation, migration, and invasion of LUAD tumors through activation of the MDM2/p53 signaling pathway. These results suggest that RPL22L1 may serve as a promising prognostic marker and therapeutic target for immunotherapy in LUAD.
Supplementary Materials
Author Contributions
Conceptualization, Shigui Xing and Qi Zhao; Data curation and analysis, Shigui Xing; Methodology, Shigui Xing; Experimental validation, Dongbing Li; Writing – original draft, Shigui Xing; Writing – review and editing, Shigui Xing, Dongbing Li, and Qi Zhao.
Acknowledgments
The authors thank TCGA and GEO database for providing the data.
Conflicts of Interest
The authors declare that they have no conflicts of interest.
Ethical Statement
This study was approved by the Ethics Committee of Nanjing Drum Tower Hospital [2023AE01030].
Funding
No funding was provided for this study.
References
- 1. Siegel RL, Miller KD, Wagle NS, Jemal A. Cancer statistics, 2023. CA Cancer J Clin. 2023; 73:17–48. https://doi.org/10.3322/caac.21763 [PubMed]
- 2. Chen P, Liu Y, Wen Y, Zhou C. Non-small cell lung cancer in China. Cancer Commun (Lond). 2022; 42:937–70. https://doi.org/10.1002/cac2.12359 [PubMed]
- 3. Cascone T, Fradette J, Pradhan M, Gibbons DL. Tumor Immunology and Immunotherapy of Non-Small-Cell Lung Cancer. Cold Spring Harb Perspect Med. 2022; 12:a037895. https://doi.org/10.1101/cshperspect.a037895 [PubMed]
- 4. Singh SS, Dahal A, Shrestha L, Jois SD. Genotype Driven Therapy for Non-Small Cell Lung Cancer: Resistance, Pan Inhibitors and Immunotherapy. Curr Med Chem. 2020; 27:5274–316. https://doi.org/10.2174/0929867326666190222183219 [PubMed]
- 5. Oršolić I, Bursać S, Jurada D, Drmić Hofman I, Dembić Z, Bartek J, Mihalek I, Volarević S. Cancer-associated mutations in the ribosomal protein L5 gene dysregulate the HDM2/p53-mediated ribosome biogenesis checkpoint. Oncogene. 2020; 39:3443–57. https://doi.org/10.1038/s41388-020-1231-6 [PubMed]
- 6. Kang J, Brajanovski N, Chan KT, Xuan J, Pearson RB, Sanij E. Ribosomal proteins and human diseases: molecular mechanisms and targeted therapy. Signal Transduct Target Ther. 2021; 6:323. https://doi.org/10.1038/s41392-021-00728-8 [PubMed]
- 7. Zhang D, Zhou Y, Ma Y, Jiang P, Lv H, Liu S, Mu Y, Zhou C, Xiao S, Ji G, Liu P, Zhang N, Sun D, et al. Ribosomal protein L22-like1 (RPL22L1) mediates sorafenib sensitivity via ERK in hepatocellular carcinoma. Cell Death Discov. 2022; 8:365. https://doi.org/10.1038/s41420-022-01153-8 [PubMed]
- 8. Chen Y, Mu Y, Guan Q, Li C, Zhang Y, Xu Y, Zhou C, Guo Y, Ma Y, Zhao M, Ji G, Liu P, Sun D, et al. RPL22L1, a novel candidate oncogene promotes temozolomide resistance by activating STAT3 in glioblastoma. Cell Death Dis. 2023; 14:757. https://doi.org/10.1038/s41419-023-06156-6 [PubMed]
- 9. Xiang Y, Zhou S, Hao J, Zhong C, Ma Q, Sun Z, Wei C. Development and validation of a prognostic model for kidney renal clear cell carcinoma based on RNA binding protein expression. Aging (Albany NY). 2020; 12:25356–72. https://doi.org/10.18632/aging.104137 [PubMed]
- 10. Yi X, Zhang C, Liu B, Gao G, Tang Y, Lu Y, Pan Z, Wang G, Feng W. Ribosomal protein L22-like1 promotes prostate cancer progression by activating PI3K/Akt/mTOR signalling pathway. J Cell Mol Med. 2023; 27:403–11. https://doi.org/10.1111/jcmm.17663 [PubMed]
- 11. Liang Z, Mou Q, Pan Z, Zhang Q, Gao G, Cao Y, Gao Z, Pan Z, Feng W. Identification of candidate diagnostic and prognostic biomarkers for human prostate cancer: RPL22L1 and RPS21. Med Oncol. 2019; 36:56. https://doi.org/10.1007/s12032-019-1283-z [PubMed]
- 12. Rao S, Peri S, Hoffmann J, Cai KQ, Harris B, Rhodes M, Connolly DC, Testa JR, Wiest DL. RPL22L1 induction in colorectal cancer is associated with poor prognosis and 5-FU resistance. PLoS One. 2019; 14:e0222392. https://doi.org/10.1371/journal.pone.0222392 [PubMed]
- 13. Wu N, Wei J, Wang Y, Yan J, Qin Y, Tong D, Pang B, Sun D, Sun H, Yu Y, Sun W, Meng X, Zhang C, et al. Ribosomal L22-like1 (RPL22L1) Promotes Ovarian Cancer Metastasis by Inducing Epithelial-to-Mesenchymal Transition. PLoS One. 2015; 10:e0143659. https://doi.org/10.1371/journal.pone.0143659 [PubMed]
- 14. Huang Z, Hu X, Wei Y, Lai Y, Qi J, Pang J, Huang K, Li H, Cai P. ADAMTSL2 is a potential prognostic biomarker and immunotherapeutic target for colorectal cancer: Bioinformatic analysis and experimental verification. PLoS One. 2024; 19:e0303909. https://doi.org/10.1371/journal.pone.0303909 [PubMed]
- 15. Yang D, Liu M, Jiang J, Luo Y, Wang Y, Chen H, Li D, Wang D, Yang Z, Chen H. Comprehensive Analysis of DMRT3 as a Potential Biomarker Associated with the Immune Infiltration in a Pan-Cancer Analysis and Validation in Lung Adenocarcinoma. Cancers (Basel). 2022; 14:6220. https://doi.org/10.3390/cancers14246220 [PubMed]
- 16. Yi W, Shen H, Sun D, Xu Y, Feng Y, Li D, Wang C. Low Expression of Long Noncoding RNA SLC26A4 Antisense RNA 1 Is an Independent Prognostic Biomarker and Correlate of Immune Infiltrates in Breast Cancer. Med Sci Monit. 2021; 27:e934522. https://doi.org/10.12659/MSM.934522 [PubMed]
- 17. Vivian J, Rao AA, Nothaft FA, Ketchum C, Armstrong J, Novak A, Pfeil J, Narkizian J, Deran AD, Musselman-Brown A, Schmidt H, Amstutz P, Craft B, et al. Toil enables reproducible, open source, big biomedical data analyses. Nat Biotechnol. 2017; 35:314–6. https://doi.org/10.1038/nbt.3772 [PubMed]
- 18. Chen B, Lu X, Zhou Q, Chen Q, Zhu S, Li G, Liu H. PAXIP1-AS1 is associated with immune infiltration and predicts poor prognosis in ovarian cancer. PLoS One. 2023; 18:e0290031. https://doi.org/10.1371/journal.pone.0290031 [PubMed]
- 19. Chen J, Tang H, Li T, Jiang K, Zhong H, Wu Y, He J, Li D, Li M, Cai X. Comprehensive Analysis of the Expression, Prognosis, and Biological Significance of OVOLs in Breast Cancer. Int J Gen Med. 2021; 14:3951–60. https://doi.org/10.2147/IJGM.S326402 [PubMed]
- 20. Liang W, Lu Y, Pan X, Zeng Y, Zheng W, Li Y, Nie Y, Li D, Wang D. Decreased Expression of a Novel lncRNA FAM181A-AS1 is Associated with Poor Prognosis and Immune Infiltration in Lung Adenocarcinoma. Pharmgenomics Pers Med. 2022; 15:985–98. https://doi.org/10.2147/PGPM.S384901 [PubMed]
- 21. Lin Z, Huang W, Yi Y, Li D, Xie Z, Li Z, Ye M. LncRNA ADAMTS9-AS2 is a Prognostic Biomarker and Correlated with Immune Infiltrates in Lung Adenocarcinoma. Int J Gen Med. 2021; 14:8541–55. https://doi.org/10.2147/IJGM.S340683 [PubMed]
- 22. Cai H, Chen S, Wu Z, Wang F, Tang S, Li D, Wang D, Guo W. Comprehensive analysis of ZNF692 as a potential biomarker associated with immune infiltration in a pan cancer analysis and validation in hepatocellular carcinoma. Aging (Albany NY). 2023; 15:13041–58. https://doi.org/10.18632/aging.205218 [PubMed]
- 23. Chen YC, Li DB, Wang DL, Peng H. Comprehensive analysis of distal-less homeobox family gene expression in colon cancer. World J Gastrointest Oncol. 2023; 15:1019–35. https://doi.org/10.4251/wjgo.v15.i6.1019 [PubMed]
- 24. Han QL, Cui Z, Wang Q, Pang F, Li D, Wang D. Upregulation of OTX2-AS1 is Associated With Immune Infiltration and Predicts Prognosis of Gastric Cancer. Technol Cancer Res Treat. 2023; 22:15330338231154091. https://doi.org/10.1177/15330338231154091 [PubMed]
- 25. Bindea G, Mlecnik B, Tosolini M, Kirilovsky A, Waldner M, Obenauf AC, Angell H, Fredriksen T, Lafontaine L, Berger A, Bruneval P, Fridman WH, Becker C, et al. Spatiotemporal dynamics of intratumoral immune cells reveal the immune landscape in human cancer. Immunity. 2013; 39:782–95. https://doi.org/10.1016/j.immuni.2013.10.003 [PubMed]
- 26. Yoshihara K, Shahmoradgoli M, Martínez E, Vegesna R, Kim H, Torres-Garcia W, Treviño V, Shen H, Laird PW, Levine DA, Carter SL, Getz G, Stemke-Hale K, et al. Inferring tumour purity and stromal and immune cell admixture from expression data. Nat Commun. 2013; 4:2612. https://doi.org/10.1038/ncomms3612 [PubMed]
- 27. Zeng R, Peng B, Peng E. Downregulated Copper Homeostasis-Related Gene FOXO1 as a Novel Indicator for the Prognosis and Immune Response of Breast Cancer. J Immunol Res. 2022; 2022:9140461. https://doi.org/10.1155/2022/9140461 [PubMed]
- 28. Chalmers ZR, Connelly CF, Fabrizio D, Gay L, Ali SM, Ennis R, Schrock A, Campbell B, Shlien A, Chmielecki J, Huang F, He Y, Sun J, et al. Analysis of 100,000 human cancer genomes reveals the landscape of tumor mutational burden. Genome Med. 2017; 9:34. https://doi.org/10.1186/s13073-017-0424-2 [PubMed]
- 29. Jardim DL, Goodman A, de Melo Gagliato D, Kurzrock R. The Challenges of Tumor Mutational Burden as an Immunotherapy Biomarker. Cancer Cell. 2021; 39:154–73. https://doi.org/10.1016/j.ccell.2020.10.001 [PubMed]
- 30. Cao L, Ma X, Zhang J, Yang C, Rong P, Wang W. PTEN-related risk classification models for predicting prognosis and immunotherapy response of hepatocellular carcinoma. Discov Oncol. 2023; 14:134. https://doi.org/10.1007/s12672-023-00743-x [PubMed]
- 31. Gu S, Zaidi S, Hassan MI, Mohammad T, Malta TM, Noushmehr H, Nguyen B, Crandall KA, Srivastav J, Obias V, Lin P, Nguyen BN, Yao M, et al. Mutated CEACAMs Disrupt Transforming Growth Factor Beta Signaling and Alter the Intestinal Microbiome to Promote Colorectal Carcinogenesis. Gastroenterology. 2020; 158:238–52. https://doi.org/10.1053/j.gastro.2019.09.023 [PubMed]
- 32. Han Y, Wang Y, Dong X, Sun D, Liu Z, Yue J, Wang H, Li T, Wang C. TISCH2: expanded datasets and new tools for single-cell transcriptome analyses of the tumor microenvironment. Nucleic Acids Res. 2023; 51:D1425–31. https://doi.org/10.1093/nar/gkac959 [PubMed]
- 33. Ding Y, Wang H, Wang Q, Jiang H, Li Z, Yu Z, Wang Q, Xu M. Pan-Cancer Analysis Reveals SOX2 as a Promising Prognostic and Immunotherapeutic Biomarker Across Various Cancer Types, Including Pancreatic Cancer. J Cancer. 2024; 15:251–74. https://doi.org/10.7150/jca.88397 [PubMed]
- 34. Li M, Wang X, Liu J, Mao X, Li D, Wang Z, Tang Y, Wu S. Identification of Core Prognosis-Related Candidate Genes in Chinese Gastric Cancer Population Based on Integrated Bioinformatics. Biomed Res Int. 2020; 2020:8859826. https://doi.org/10.1155/2020/8859826 [PubMed]
- 35. Xie H, Zhang R, Guo R, Zhang Y, Zhang J, Li H, Fu Q, Wang X. Characterization of AI-2/LuxS quorum sensing system in biofilm formation, pathogenesis of Streptococcus equi subsp. zooepidemicus. Front Cell Infect Microbiol. 2024; 14:1339131. https://doi.org/10.3389/fcimb.2024.1339131 [PubMed]
- 36. Zhang Y, Sheng H, Fu Y, Chen L. Transcription Factor FOXA1 Facilitates Glycolysis and Proliferation of Lung Adenocarcinoma via Activation of TEX19. Mol Biotechnol. 2024; 66:2144–54. https://doi.org/10.1007/s12033-023-00848-2 [PubMed]
- 37. Luo Z, Yang F, Liu K, Ding Z. ZC3H12A inhibits tumor growth and metastasis of breast cancer under hypoxic condition via the inactivation of IL-17 signaling pathway. Cell Cycle. 2024; 23:188–204. https://doi.org/10.1080/15384101.2024.2314441 [PubMed]
- 38. Zhao Z, Liu H, Hou J, Li T, Du X, Zhao X, Xu W, Xu W, Chang J. Tumor Protein D52 (TPD52) Inhibits Growth and Metastasis in Renal Cell Carcinoma Cells Through the PI3K/Akt Signaling Pathway. Oncol Res. 2017; 25:773–9. https://doi.org/10.3727/096504016X14774889687280 [PubMed]
- 39. Yang Y, Gu X, Li Z, Zheng C, Wang Z, Zhou M, Chen Z, Li M, Li D, Xiang J. Whole-exome sequencing of rectal cancer identifies locally recurrent mutations in the Wnt pathway. Aging (Albany NY). 2021; 13:23262–83. https://doi.org/10.18632/aging.203618 [PubMed]
- 40. Shen K, Liu T. Comprehensive Analysis of the Prognostic Value and Immune Function of Immune Checkpoints in Stomach Adenocarcinoma. Int J Gen Med. 2021; 14:5807–24. https://doi.org/10.2147/IJGM.S325467 [PubMed]
- 41. Li Z, Fan Y, Ma Y, Meng N, Li D, Wang D, Lian J, Hu C. Identification of Crucial Genes and Signaling Pathways in Alectinib-Resistant Lung Adenocarcinoma Using Bioinformatic Analysis. Mol Biotechnol. 2023. [Epub ahead of print]. https://doi.org/10.1007/s12033-023-00973-y [PubMed]
- 42. He W, Dong S, Shen J, Wu J, Zhao P, Li D, Wang D, Tang N, Zou C. Whole-genome sequencing identified novel mutations in a Chinese family with lynch syndrome. Front Oncol. 2023; 13:1036356. https://doi.org/10.3389/fonc.2023.1036356 [PubMed]
- 43. Bruni D, Angell HK, Galon J. The immune contexture and Immunoscore in cancer prognosis and therapeutic efficacy. Nat Rev Cancer. 2020; 20:662–80. https://doi.org/10.1038/s41568-020-0285-7 [PubMed]
- 44. Ou HB, Wei Y, Liu Y, Zhou FX, Zhou YF. Characterization of the immune cell infiltration landscape in lung adenocarcinoma. Arch Biochem Biophys. 2022; 721:109168. https://doi.org/10.1016/j.abb.2022.109168 [PubMed]
- 45. Farkona S, Diamandis EP, Blasutig IM. Cancer immunotherapy: the beginning of the end of cancer? BMC Med. 2016; 14:73. https://doi.org/10.1186/s12916-016-0623-5 [PubMed]
- 46. Berry J, Vreeland T, Trappey A, Hale D, Peace K, Tyler J, Walker A, Brown R, Herbert G, Yi F, Jackson D, Clifton G, Peoples GE. Cancer vaccines in colon and rectal cancer over the last decade: lessons learned and future directions. Expert Rev Clin Immunol. 2017; 13:235–45. https://doi.org/10.1080/1744666X.2016.1226132 [PubMed]
- 47. Toor SM, Sasidharan Nair V, Decock J, Elkord E. Immune checkpoints in the tumor microenvironment. Semin Cancer Biol. 2020; 65:1–12. https://doi.org/10.1016/j.semcancer.2019.06.021 [PubMed]
- 48. Friedel L, Loewer A. The guardian’s choice: how p53 enables context-specific decision-making in individual cells. FEBS J. 2022; 289:40–52. https://doi.org/10.1111/febs.15767 [PubMed]
- 49. Xu B, Wei Y, Liu F, Li L, Zhou S, Peng Y, Li B. Long noncoding RNA CERS6-AS1 modulates glucose metabolism and tumor progression in hepatocellular carcinoma by promoting the MDM2/p53 signaling pathway. Cell Death Discov. 2022; 8:348. https://doi.org/10.1038/s41420-022-01150-x [PubMed]
- 50. Pant V, Xiong S, Jackson JG, Post SM, Abbas HA, Quintás-Cardama A, Hamir AN, Lozano G. The p53-Mdm2 feedback loop protects against DNA damage by inhibiting p53 activity but is dispensable for p53 stability, development, and longevity. Genes Dev. 2013; 27:1857–67. https://doi.org/10.1101/gad.227249.113 [PubMed]
- 51. Kruse JP, Gu W. Modes of p53 regulation. Cell. 2009; 137:609–22. https://doi.org/10.1016/j.cell.2009.04.050 [PubMed]
- 52. Meng X, Franklin DA, Dong J, Zhang Y. MDM2-p53 pathway in hepatocellular carcinoma. Cancer Res. 2014; 74:7161–7. https://doi.org/10.1158/0008-5472.CAN-14-1446 [PubMed]
- 53. Shu B, Gan H, Wang C, Cao C, Tong H, Liang D. LINC01426 aggravates the malignant progression of glioma through miR-661/Mdm2 axis. Brain Res Bull. 2022; 188:110–21. https://doi.org/10.1016/j.brainresbull.2022.06.012 [PubMed]