


Introduction
Liver cancer seriously endangers people’s health. It is conservatively estimated that 1 million people will be affected by liver cancer each year [1]. Hepatocellular carcinoma (HCC) is the predominant type of liver cancer and is associated with persistent inflammation and fibrosis [2]. Post-treatment recurrence is noted up to 60% of patients following partial liver resection, and about 15% of liver transplant patients [3]. In previous studies, Macrovascular invasion, Lymphovascular invasion and poor differentiation have been used to speculate the clinical outcomes of patients [4]. However, liver cancer is an extraordinarily heterogeneous malignant disease, we need to search for novel biomarkers to provide a more precise prognosis for doctors.
HCC is a heterogeneous malignancy with dismal prognosis. TERT, TP53 and CTNNB1 mutations are the most common mutations that affect the prognosis of HCC. However, these mutations are not fully present in most patients, and their clinical use is not yet widely accepted. To date, specific biomarkers are still needed to improve the prognosis of HCC. Compared with a single biomarker, polygenic markers can improve the specificity of the prognosis of tumor patients.
In the past few decades, considerable progress has been made in understanding the biomarkers and molecular characteristics of HCC [5]. The most studied prognostic parameters were tumor number, size, α-Feto protein (AFP) level, cell differentiation, MVI and ES grades, presence of satellite nodule, and pTNM stage [6]. However, existing prognostic staging systems still have many limitations in guiding treatment and prognosis. Recently, there has been increasing evidence that oxidative stress plays a crucial role in the development of liver cancer [7]. The occurrence of liver cancer is closely related to oxidative stress and inflammation [8]. Excessive and long-term inflammation and oxidative stress can cause irreversible damage and may lead to cirrhosis and carcinogenic transformation, while liver cancer is the inevitable result of the development of liver cirrhosis. Therefore, understanding the molecular mechanism of oxidative stress in hepatocellular carcinoma and its effect on prognosis will help to provide new therapeutic strategies for the treatment of HCC. Shen et al. investigated that Facilitates Chromatin Transcription complex was remarkably upregulated in HCC, which mediated oxidative stress to promote HCC progression [9]. Similarly, as a biomarker for oxidative stress, high expression of 8-Hydroxy-2-deoxyguanosine is associated with poor survival in HCC patients [10]. Recent findings have reported that oxidative stress promotes thyroid cancer development by upregulating protein Tyrosine Phosphatases expression [11]. Furthermore, the degradation of mitogen-activated protein kinase phosphatase-3 mediated by oxidative stress contributes to tumorigenicity of human ovarian cancer cells [12].
The above studies support that those biomarkers are useful tools for oxidative stress, and they do have potential in determining the stage of tumor progression. However, compared with single biomarker, polygenic markers can improve the specificity of tumor patient prognosis [13]. Paik et al. found that a 21-gene recurrence score predicts response to chemotherapy in breast cancer [14], indicating the superiority of polygenic markers in predicting prognosis.
Here, we used Cox multiple regression models to evaluate gene expression in HCC cases from The Cancer Genome Atlas (TCGA; http://www.tcga.org/). Compared with the patients with high-risk scores, the survival rates of the patients with low-risk scores are significantly higher. The findings were further validated with training and complete test datasets. Furthermore, we found that risk scores can be independent of other clinical variables, has a greater advantage in judging the prognosis of HCC. Combining the risk score with other clinical factors to form a nomogram to predict the 5-year and 10-year survival rates of HCC patients is more accurate and convenient.
Results
Differential oxidative stress-related genes
Analysis of differential gene expression between liver cancer and normal tissues suggested that a total of 254 genes were dysregulated, of which 145 were up-regulated and 109 were down-regulated (Supplementary Table 1). We visualised the differences and created a volcano map and heat map, in volcano map the down-regulated genes were expressed in blue, the up-regulated genes in yellow and the genes that did not differ between groups were represented in grey (Figure 1A, 1B). LASSO regression results demonstrate that Lambda obtained minimum value (Figure 1C), model enrolled 11 important genes (Figure 1D).
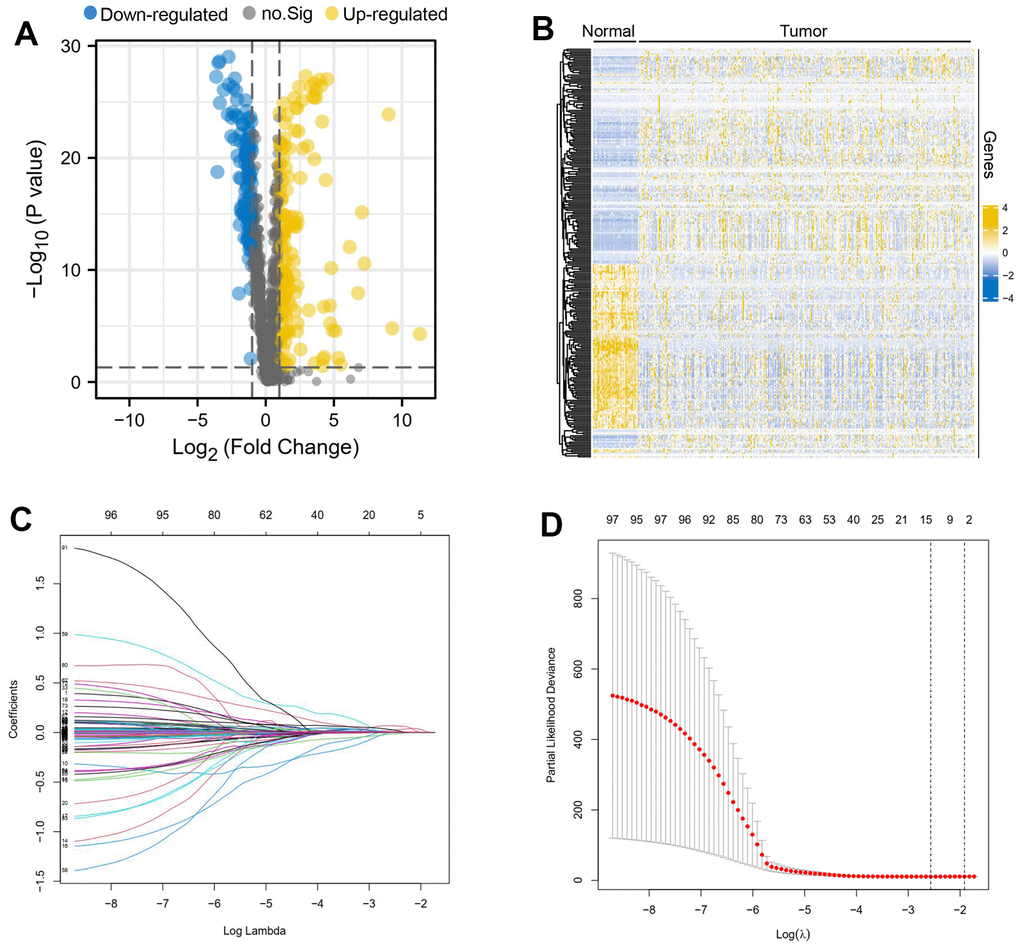
Figure 1. Differential oxidative stress-related genes between liver cancer and normal tissues. A volcano map (A) and heatmap (B) about differential oxidative stress-related genes was created, the down-regulated genes were expressed in blue, the up-regulated genes in yellow and the genes that did not differ between groups were represented in grey. Lambda obtained minimum value (C), model enrolled 11 important genes (D).
Seven gene signatures of oxidative stress-related genes can predict patient prognosis
Multifactorial Cox regression of 11 prognostic genes resulted in seven independent risk genes affecting the prognosis of patients with hepatocellular carcinoma, namely ENO1, NDRG1, NPM1, H2AX, IL33, MT3 and TXNRD1 (Table 1). Based on the expression of the genes and the model coefficients, we constructed a signature model for each of the 7 genes and calculated the risk score for each patient based on the model (Figure 2A). Survival analysis revealed that patients in the high-risk group had a worse prognosis, compared to patients in the low-risk group, who had a significantly longer survival time (Figure 2B). In addition, the area under the ROC curve was equal to 0.841, suggesting that the model was highly discriminatory in terms of patient stratification (Figure 2C). This conclusion is also supported by the data from this validation set (Figure 3A–3C).
Table 1. Multi-Cox regression of 11 prognostic genes resulted in seven independent risk genes affecting the prognosis of patients with hepatocellular carcinoma.
| Gene | coef | HR | HR.95L | HR.95H | p-value |
| ENO1 | 0.000568 | 1.000568 | 0.999953 | 1.001184 | 0.070251 |
| NDRG1 | 0.00858 | 1.008616 | 1.002766 | 1.014501 | 0.003848 |
| NPM1 | 0.003667 | 1.003673 | 0.999362 | 1.008003 | 0.095043 |
| MT3 | 0.106454 | 1.112326 | 1.047154 | 1.181556 | 0.000549 |
| TXNRD1 | 0.009974 | 1.010024 | 1.004602 | 1.015476 | 0.000282 |
| H2AX | 0.022586 | 1.022843 | 1.008564 | 1.037324 | 0.001639 |
| IL33 | -0.13473 | 0.87395 | 0.782905 | 0.975583 | 0.016378 |
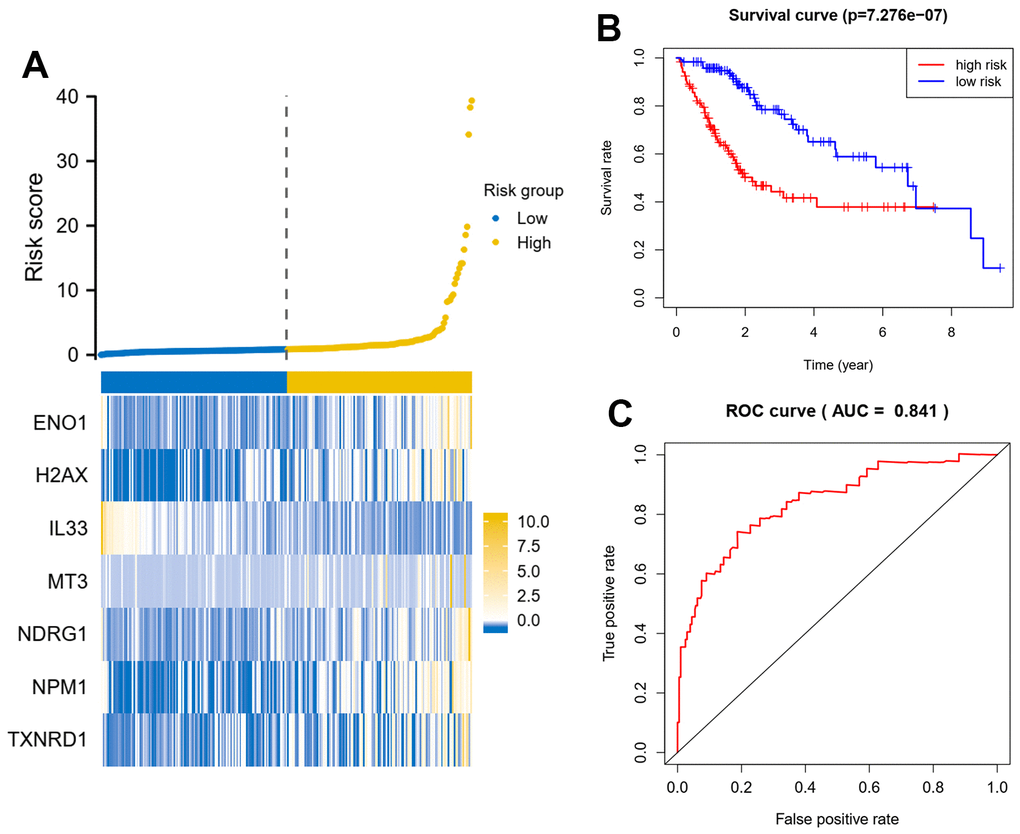
Figure 2. Seven oxidative stress-related genes predict patient prognosis model in training dataset. (A) A signature model for each of the 7 genes was constructed, and the risk score for each patient based on the model was calculated. X axis is number of patients. (B) Survival analysis about patients in the high-risk group and the low-risk group. (C) Analysis of the area under the ROC curve. The signature model based on Cox regression coefficients and gene expression, the riskscore = gene A expression* coefficients A+ gene B expression* coefficients B.
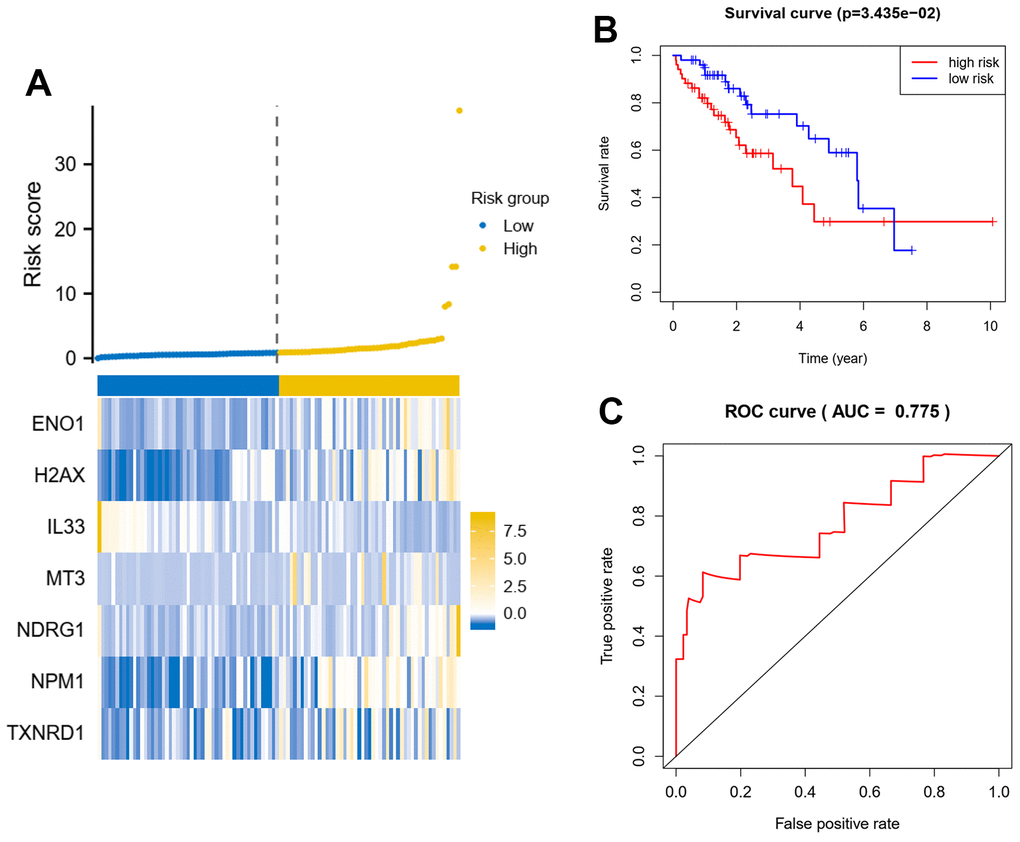
Figure 3. Seven oxidative stress-related genes predict patient prognosis model in test dataset. (A) A signature model for each of the 7 genes was constructed, and the risk score for each patient based on the model was calculated. X axis is number of patients. (B) Survival analysis about patients in the high-risk group and the low-risk group. (C) Analysis of the area under the ROC curve. The signature model based on Cox regression coefficients and gene expression, the riskscore = gene A expression* coefficients A+ gene B expression* coefficients B.
Seven oxidative stress-related genes detect early-stage liver cancer
The oxidative stress-related gene signature of the seven genes was derived from a differential analysis of cancer and paracancer, so we hypothesized that it could not only predict the prognosis of patients but also have the potential to detect early-stage liver cancer, and therefore we further analyzed the model genes in the signature using the BP network and visualized the network (Figure 4A and Supplementary Table 3). The results suggested that these seven genes could be used as a panel for early detection of liver cancer with high early detection efficacy (ROC=0.955) (Figure 4B).
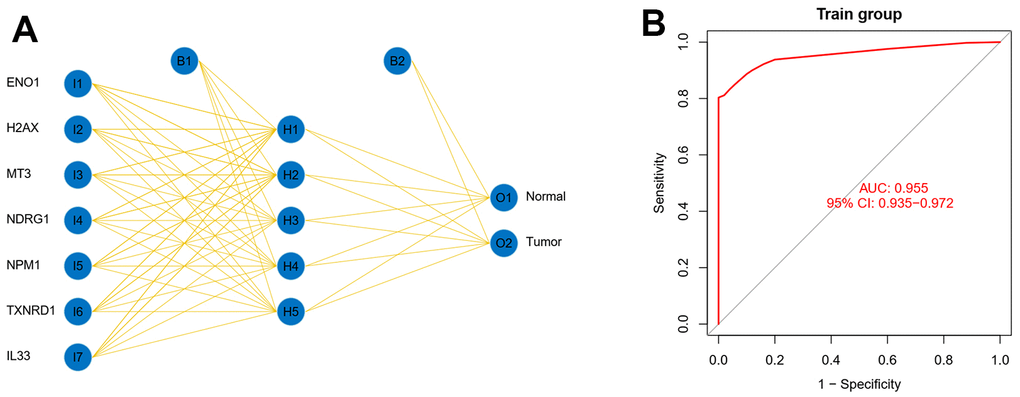
Figure 4. Seven oxidative stress-related genes detect early-stage liver cancer. (A) The model genes in the signature using the BP network were analyzed and the network was visualized. (B) The seven genes were used as a panel for early detection of liver cancer.
ENO1, NDGR1, NPM1 and TXNRD1 are highly expressed in HCC tissues from patients with poor prognosis
PPI network identifies ENO1 as hub gene of signature (Figure 5A). We examined the expression of ENO1 gene in hepatocellular carcinoma tissues at both transcriptomic levels and showed that ENO1 gene was significantly more highly expressed in both paired and unpaired hepatocellular carcinoma samples compared to paracellular tissues (Figure 5B, 5C). To further verify the effectiveness of ENO1, we performed the validation studies. As shown in Figure 5D, immunohistochemistry experiment was used to measure the expression of ENO1 in paracellular tissues and hepatocellular carcinoma sample. Compared with the paracellular tissues (Normal * group), the expression of ENO1 was increased in the hepatocellular carcinoma samples (Tumor * group). Furthermore, we found that ENO1 expression in the hepatocellular carcinoma samples from patients with poor prognosis (Tumor ** group) was higher than the samples from patients with better prognosis (Tumor * group). Additionally, we measured the expression of another four targets (NDRG1, NPM1, TXNRD1 and IL-33) to investigate the reliability of the multi-index prediction. As shown in Figure 5D, compared with the paracellular tissues, the expression of NDRG1, NPM1, TXNRD1 were both increased in the hepatocellular carcinoma samples. We also found that the expression of NDRG1, NPM1, TXNRD1 in the hepatocellular carcinoma samples from patients with poor prognosis were higher than the samples from patients with better prognosis. In contrast, the expression of IL-33 was decreased in the hepatocellular carcinoma samples. We also found that IL-33 expression in the hepatocellular carcinoma samples from patients with poor prognosis were lower than the samples from patients with better prognosis. Meanwhile, the samples were observed using haematoxylin and eosin (H&E) staining. As shown in Figure 5D, Normal (*): Normal liver morphology adjacent to cancer. Tumor (*): Organization type: trabecular type; Cell type: common type; EDMONDSON classification: II; Microvascular tumor thrombus: MVI grade 0. Tumor (**): Tissue type: trabecular type, pseudoadenoid type; Cell types: common, tumor giant cell type, hyaline cell type; EDMONDSON classification: III-IV; Microvascular tumor thrombus: MVI grade 1, the cells are heterotypic, the nucleus is large and divided. These data suggested that the oxidative stress-related polygenic biomarkers we screened were reliable and clinically significant in predicting prognosis.
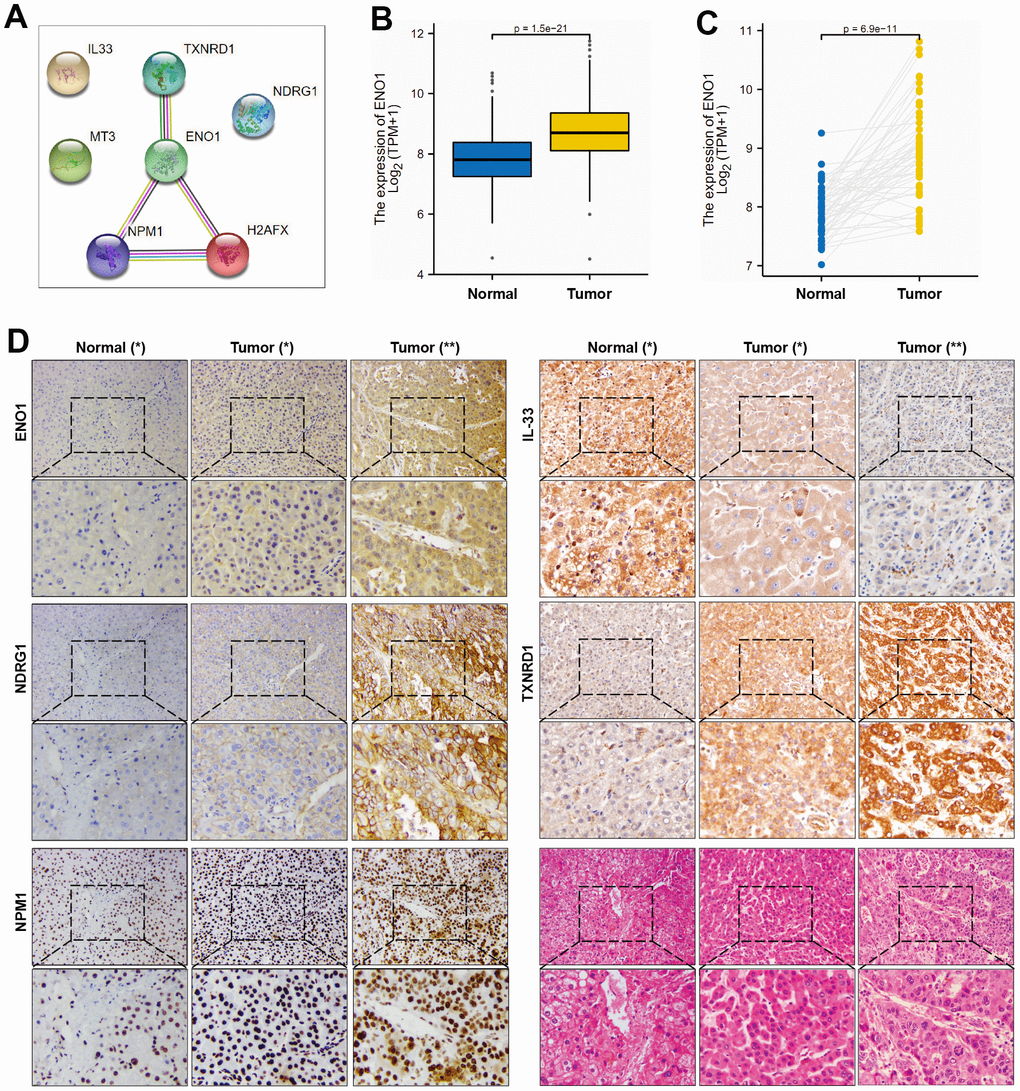
Figure 5. ENO1, NDGR1 and NPM1 expression in HCC tissues. (A) PPI network identifies ENO1 as hub gene of signature. (B, C) The expression of ENO1 gene in paracellular tissues and hepatocellular carcinoma tissues. (D) The protein expression of ENO1, NDGR1, NPM1, TXNRD1 and IL-33 in hepatocellular carcinoma tissues and paracellular tissues (n= 10 per group). Samples were stained with H&E staining to observe the structure of paracellular tissues and hepatocellular carcinoma tissues (n= 10 per group). Patients’ essential characteristics were shown in Supplementary Table 4. Normal (*): paracellular tissues; Tumor (*): hepatocellular carcinoma tissues, EDMONDSON Classification: II; Microvascular tumor thrombus: MVI grade 0; Tumor (**): hepatocellular carcinoma tissues, EDMONDSON Classification: III-IV; Microvascular tumor thrombus: MVI grade 1.
High expression of hub gene ENO1 suggests disease progression and correlates with tumor immune infiltration
The results of the clinical correlation analysis of ENO1 gene expression suggest that ENO1 is associated with tumor size and stage. The gene was less expressed in stage T1 compared to stage T2 and T3 (Figure 6A). The expression of ENO1 increased significantly with higher tumor stage in stage (Figure 6B), and in the pathological Grade stage, the expression of ENO1 was also increased in other Grade grades compared to Grade 1 (Figure 6C). However, unfortunately, our analysis revealed that ENO1 was not associated with lymph node status or distant metastatic status (Figure 6D, 6E). Furthermore, the immune infiltration results suggested that ENO1 correlated with Th2 cells, aDC, NK CD56bright cells, macrophages, pDC, CD8 T cells and Th17 cells in the tumor microenvironment, suggesting that ENO1 may promote liver cancer progression by regulating immune infiltrating cells in the tumor microenvironment (Figure 7).
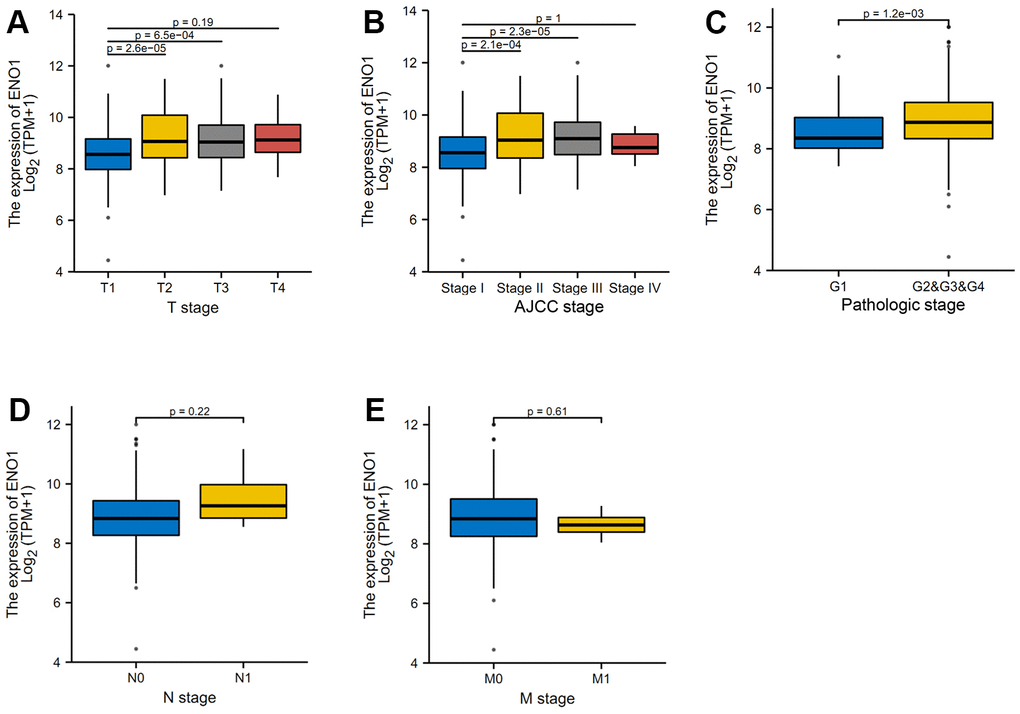
Figure 6. High expression of hub gene ENO1 suggests disease progression. (A) The clinical correlation analysis of ENO1 gene expression and tumor size and stage. The expression of ENO1 in different tumor stages (B), and in the pathological Grade stage (C). ENO1 was not associated with lymph node status (D) or distant metastatic status (E).
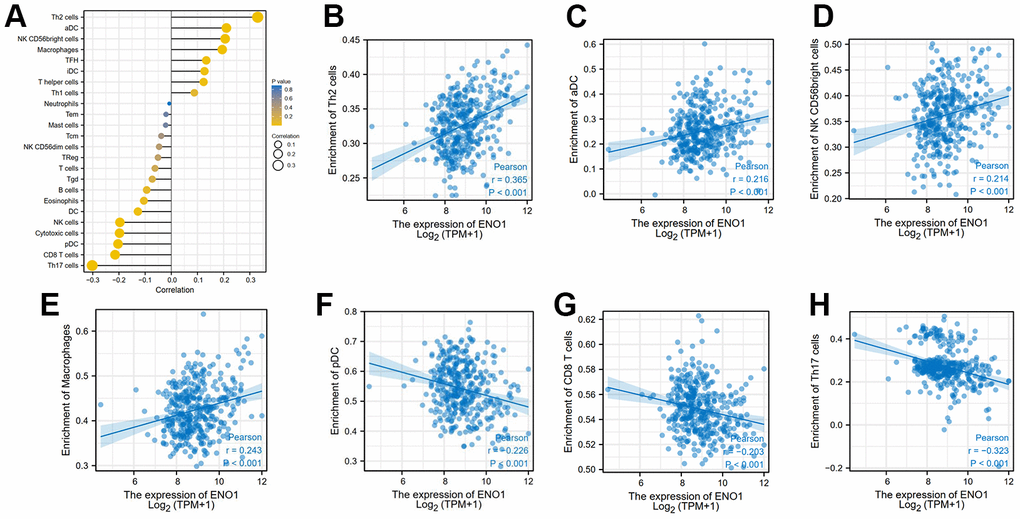
Figure 7. High expression of hub gene ENO1 correlates with tumor immune infiltration. The expression of ENO1 (A) correlated with Th2 cells (B), aDC (C), NK CD56bright cells (D), macrophages (E), pDC (F), CD8 T cells (G) and Th17 cells (H) in the tumor microenvironment.
Discussion
In this study, we screened seven gene biomarkers related to the prognosis of HCC from the perspective of oxidative stress, measured five targets expression (ENO1, NDRG1, NPM1, TXNRD1 and IL-33) of the seven gene biomarkers to investigate the reliability of the multi-index prediction in clinic, increasing the sensitivity and specificity of the predictive model and resulting in a significant increase in overall confidence.
Numerous previous studies have reported biomarkers associated with the prognosis of HCC. Liu et al. showed that the expression of PGM5 in HCC was significantly lower than that in adjacent tissues [15]. Wang et al. found that the expression of PPM1G gene in HCC tissues was lower than that in adjacent tissues [16]. However, the above studies were based on the evaluation of single-gene biomarkers, the clinical application was limited and there were also certain clinical biases. Therefore, it is particularly important to develop new polygenic models to predict the survival rate of HCC patients. Studies have reported that oxidative stress-related indicators are highly correlated with the prognosis of HCC patients. Huang et al. indicated that found that the level of glutathione in HCC tissues of patients was significantly higher than that in adjacent normal tissues [17]. Xiong et al. shown that PCK gene expression was down-regulated and was associated with poor prognosis in HCC patients [18]. Given the importance of oxidative stress, we tried to screen multi-gene biomarkers to predict the prognosis of liver cancer from the perspective of oxidative stress.
In this study, we performed Cox multiple regression analysis on the RNA sequencing data of HCC downloaded from the TCGA database, and identified the genes related to oxidative stress in patients. Among them, 7 genes met the selection criteria. We further analyzed related genes. Survival analysis showed that patients with high-risk scores had significantly shorter OS time compared with patients with low-risk scores. At the same time, risk score was a better predictor of patient survival than other specific medical parameters including age, tumor stage and histological type, suggesting these 7 genes deserve further study.
To more accurately predict patient 5- and 10-year survival, we developed a new nomogram in combination with other clinical factors. Compared with traditional classification systems for tumor nodules and metastases, or nomograms using only a single biomarker, the new nomogram we designed and developed may more accurately guide patients with poor survival rates to the correct treatment regimen. Among the seven genes identified, expression of ENO1, H2AX, MT3, NDRG1, NPM1 and TXNRD1 was risk-associated, suggesting that the expression levels of these genes are inversely correlated with HCC survival time. In contrast, the expression level of IL-33 was positively correlated with survival. ENO1, NDRG1 and NPM1 are reportedly associated with cancer as further discussed. We further measured the expression of ENO1, NDRG1, NPM1, TXNRD1 and IL-33 to investigate the reliability of the multi-index prediction. The data indicated that the oxidative stress-related polygenic biomarkers we screened are reliable and clinically significant in predicting prognosis.
As a hub gene of signature identified by PPI network, ENO1 is overexpressed in 70% of human cancers and is associated with poor cancer prognosis, converts 2-phosphoglycerate to phosphoenolpyruvate, plays an important role in the glycolytic pathway and the Warburg effect in cancer cells [19, 20]. High expression of ENO1 increased the risk score and the likelihood of poor prognosis, act as a biomarker in patients with hepatocellular carcinoma, and may be a favorable candidate for targeted treatment [21]. NDRG1, one member of NDR- and an α/β hydrolase-fold region family [22]. Both NDRG1 and ENO1 are closely related to glycolysis and carcinogenesis. Studies have shown that NDRG1 play important roles in tumor invasion and metastasis [23]. Compared to healthy controls, NDRG1 expression is upregulated in HCC patients and is associated with poorer prognosis and histological grade [24, 25]. NPM1, abundant nucleolar proteins that often shuttle between the nucleolus and the nucleoplasm or cytoplasm, is involved in chromatin remodeling, genome stabilization, cell cycle progression, and apoptosis in cancer [26]. The study showed that liver cancer patients with lower levels of NPM1 have a better prognosis [27]. MT3 protects the body from DNA damage, and H2AX is a biomarker of DNA damage [28, 29]. As one of the major REDOX regulators, TXNRD1 is associated with tumor aggressiveness and poor prognosis [30]. Patients with high expression of IL-33 in their tumors had higher survival rates. These indicate the importance of these 7 indicators in tumor prognosis.
Although we have used multigene biomarker analysis and the characteristics of the 7 genes screened can effectively predict the prognosis of HCC patients, this study still has certain limitations. Future studies are needed to improve the accuracy of the risk scoring model with additional patient cohorts. In addition, a patient’s treatment regimen is critical to cancer prognosis, incorporating patient treatment regimen data into these analyses will add value to subsequent results.
Conclusions
The seven gene signatures established in this study are effective and stable in HCC samples from TCGA. These 7 gene signatures are autonomous factors for the prognosis of HCC patients. These results may help develop more effective prognostic tools and ultimately improve patient outcomes.
Materials and Methods
Data acquisition and pre-processing
Data from sequenced liver cancer samples were obtained from the public database TCGA, a dataset containing a total of 50 paraneoplastic and 371 cancerous tissues. Clinical information matching the patient samples was likewise downloaded. Patients with less than 30 days of follow-up were also removed based on survival information. Oxidative stress-related genes were obtained from the gene card database and these genes have been confirmed by previous experiments.
Differential gene analysis
We extracted oxidation-related gene expression profiles from transcriptomic data based on information from screened clinical samples and performed differential analysis using the limma package, differential genes were defined as those genes whose gene expression in cancer and paracancer met |LogFC| > 1 while p < 0.05. FC: Fold change.
Univariate Cox regression and LASSO regression
Univariate Cox regression was used to filter prognostic genes associated with patients’ overall survival (OS), and genes that met the criteria were further entered into the LASSO regression model for selection of significant genes among these genes, which were done by the survival package and the caret package respectively. A p-value less than 0.05 was defined as statistically significant in the univariate Cox regression. The best model variable was obtained by taking the minimum value of Lambda in the LASSO regression. The lambda.min is the optimal value of λ found during the cross-validation process, used to minimize prediction error, rather than just being the smallest possible value of λ.
Multi-Cox regression and prognostic model construction
The results of the above analysis were further incorporated into a multifactorial Cox regression model to identify independent prognostic genes, a procedure performed by the survival package. Finally, we constructed a multi-gene prognostic model based on the coefficients of this regression model and the expression profile of the genes. Based on the scores of the model, we stratified patients and compared survival differences between groups, using ROC to assess the predictive efficacy of the model. To test the robustness of the model, we also randomly extracted 30% of the data for validation.
Prognostic model with tumor detection
Back propagation (BP) network was used to assess the ability of the model genes to detect early-stage liver cancer. We first transformed the raw count into TPM data and calculated the genescore of the model genes based on the results of the difference analysis and the expression of the model genes in the genescore matrix, where genescore in the genescore matrix, genescore greater than the median expression value is defined as 1, and those less than the median expression value is defined as 0. Finally, we input the genescore matrix into the BP network and visualise it, and the area under the ROC curve is used to assess the predictive power.
PPI identify hub gene of model and validate expression
We performed PPI protein interaction network analysis on the genes in the model through an online database, STRING database, and defined the hub genes with multiple gene links as core genes. We further validated the expression of the core genes at the transcriptional and post-transcriptional levels.
Hub gene with clinical factors and immune infiltration
To further assess the clinical value of the core gene, we correlated the core gene with common clinical variables (T, N, M, stage, grade and tumor status). We removed samples missing the above variables from the original clinical samples and looked at the differences in expression of hub gene between the variable groups. ssGSEA was used to assess the relationship between hub gene expression and immune infiltration cells in the tumor microenvironment.
Clinical information of the patients
20 patients with HCC confirmed by histopathology who received routine surgical resection at The First Affiliated Hospital of Nanjing Medical University from 2022 to 2023 were included in this study. The inclusion criteria for patients (all three items needed to be met simultaneously) were as follows: 1) patho-logically confirmed HCC; 2) no preoperative surgery, chemotherapy or radiotherapy for tumours; and 3) complete matched tumour and adjacent nontumour paraffin-embedded specimens. These patients included 16 males and 4 females, ranging in age from 43 to 74 years, and the median age was 59 years.
The clinicopathological information of all patients, including tumour size, tumour number, Edmondson and Steiner system of HCC (ES) grading, and Micro vascular (MVI) invasion, was collected. The use of tissue specimens in this study was approved by the Ethics Committee of the First Affiliated Hospital of Nanjing Medical University before the start of the study.
The essential clinical information of the patients is presented in Supplementary Table 4.
Immunohistochemical analysis
The antibody including against ENO1 (1:100, 11204-1-AP, Proteintech, CA, USA), NDGR1 (1:100, 26902-1-AP, Proteintech, CA, USA) and NPM1 (1:100, 60096-1-AP, Proteintech, CA, USA) TXNRD1 (1:100, 11117-1-AP, Proteintech, CA, USA), IL-33 (1:100, 123726-1-AP, Proteintech, CA, USA) were incubated at room temperature for 2 h. Subsequently, the secondary antibody was used in incubating the slice at 37° C for 30 min, more details were shown in the Supplementary Materials.
Histological analysis
Samples were fixed in 4% paraformaldehyde (PFA) at 4° C overnight. Samples were processed using conventional techniques. 5 μm sections were cut and stained with haematoxylin and eosin (H&E) to observe the morphology of the tissue.
Data availability
The datasets were obtained from the TCGA databases. Oxidative Stress (OS) related genes were checked by the Gencard database (https://www.genecards.org/). The datasets during and/or analyzed during the current study are available from the corresponding author on reasonable request.
Supplementary Materials
Author Contributions
CM, XH and GC performed the immunohistochemical analysis and H&E staining. CM, KU, CC Y and WJ S performed Cox’s multiple regression to establish a risk score staging classification and to predict the HCC patients’ prognosis. WJ S, SD M, HL and ZH Z conceived of the study, and participated in its design and coordination and helped to draft the manuscript. All authors approved the final manuscript.
Conflicts of Interest
The authors declare that there are no conflicts of interest regarding the publication of this paper.
Ethical Statement and Consent
This study was conducted in accordance with the Council for International Organizations of Medical Sciences International Ethical Guidelines for Biomedical Research Involving Human Subjects. The procedures were performed according to a protocol approved by the Ethics Committee of The First Affiliated Hospital of Nanjing Medical University (Nanjing, China; 2021-SR-445). Written informed consent was obtained from all participants.
Funding
This work was supported by National Natural Science Foundation of China (82204542), Natural Science Research Project of Universities in Jiangsu Province (21KJB310019).
References
- 1. Affo S, Filliol A, Gores GJ, Schwabe RF. Fibroblasts in liver cancer: functions and therapeutic translation. Lancet Gastroenterol Hepatol. 2023; 8:748–59. https://doi.org/10.1016/S2468-1253(23)00111-5 [PubMed]
- 2. Vucur M, Ghallab A, Schneider AT, Adili A, Cheng M, Castoldi M, Singer MT, Büttner V, Keysberg LS, Küsgens L, Kohlhepp M, Görg B, Gallage S, et al. Sublethal necroptosis signaling promotes inflammation and liver cancer. Immunity. 2023; 56:1578–95.e8. https://doi.org/10.1016/j.immuni.2023.05.017 [PubMed]
- 3. Hoffman D, Mehta N. Recurrence of hepatocellular carcinoma following liver transplantation. Expert Rev Gastroenterol Hepatol. 2021; 15:91–102. https://doi.org/10.1080/17474124.2021.1823213 [PubMed]
- 4. Llovet JM, Kelley RK, Villanueva A, Singal AG, Pikarsky E, Roayaie S, Lencioni R, Koike K, Zucman-Rossi J, Finn RS. Hepatocellular carcinoma. Nat Rev Dis Primers. 2021; 7:6. https://doi.org/10.1038/s41572-020-00240-3 [PubMed]
- 5. Pinyol R, Montal R, Bassaganyas L, Sia D, Takayama T, Chau GY, Mazzaferro V, Roayaie S, Lee HC, Kokudo N, Zhang Z, Torrecilla S, Moeini A, et al. Molecular predictors of prevention of recurrence in HCC with sorafenib as adjuvant treatment and prognostic factors in the phase 3 STORM trial. Gut. 2019; 68:1065–75. https://doi.org/10.1136/gutjnl-2018-316408 [PubMed]
- 6. Liu B, Zeng Q, Huang J, Zhang J, Zheng Z, Liao Y, Deng K, Zhou W, Xu Y. IVIM using convolutional neural networks predicts microvascular invasion in HCC. Eur Radiol. 2022; 32:7185–95. https://doi.org/10.1007/s00330-022-08927-9 [PubMed]
- 7. Wang L, Liu X. An oxidative stress-related signature for predicting the prognosis of liver cancer. Front Genet. 2023; 13:975211. https://doi.org/10.3389/fgene.2022.975211 [PubMed]
- 8. Kuo CL, Ponneri Babuharisankar A, Lin YC, Lien HW, Lo YK, Chou HY, Tangeda V, Cheng LC, Cheng AN, Lee AYL. Mitochondrial oxidative stress in the tumor microenvironment and cancer immunoescape: foe or friend? J Biomed Sci. 2022; 29:74. https://doi.org/10.1186/s12929-022-00859-2 [PubMed]
- 9. Shen J, Chen M, Lee D, Law CT, Wei L, Tsang FH, Chin DW, Cheng CL, Lee JM, Ng IO, Wong CC, Wong CM. Histone chaperone FACT complex mediates oxidative stress response to promote liver cancer progression. Gut. 2020; 69:329–42. https://doi.org/10.1136/gutjnl-2019-318668 [PubMed]
- 10. Ma-On C, Sanpavat A, Whongsiri P, Suwannasin S, Hirankarn N, Tangkijvanich P, Boonla C. Oxidative stress indicated by elevated expression of Nrf2 and 8-OHdG promotes hepatocellular carcinoma progression. Med Oncol. 2017; 34:57. https://doi.org/10.1007/s12032-017-0914-5 [PubMed]
- 11. Zhang Z, Xu T, Qin W, Huang B, Chen W, Li S, Li J. Upregulated PTPN2 induced by inflammatory response or oxidative stress stimulates the progression of thyroid cancer. Biochem Biophys Res Commun. 2020; 522:21–5. https://doi.org/10.1016/j.bbrc.2019.11.047 [PubMed]
- 12. Tong X, Mu P, Zhang Y, Zhao J, Wang X. TRIM59, amplified in ovarian cancer, promotes tumorigenesis through the MKP3/ERK pathway. J Cell Physiol. 2020; 235:8236–45. https://doi.org/10.1002/jcp.29478 [PubMed]
- 13. Salomaa V, Havulinna A, Saarela O, Zeller T, Jousilahti P, Jula A, Muenzel T, Aromaa A, Evans A, Kuulasmaa K, Blankenberg S. Thirty-one novel biomarkers as predictors for clinically incident diabetes. PLoS One. 2010; 5:e10100. https://doi.org/10.1371/journal.pone.0010100 [PubMed]
- 14. Paik S, Tang G, Shak S, Kim C, Baker J, Kim W, Cronin M, Baehner FL, Watson D, Bryant J, Costantino JP, Geyer CE
Jr , Wickerham DL, Wolmark N. Gene expression and benefit of chemotherapy in women with node-negative, estrogen receptor-positive breast cancer. J Clin Oncol. 2006; 24:3726–34. https://doi.org/10.1200/JCO.2005.04.7985 [PubMed] - 15. Jiao Y, Li Y, Jiang P, Han W, Liu Y. PGM5: a novel diagnostic and prognostic biomarker for liver cancer. PeerJ. 2019; 7:e7070. https://doi.org/10.7717/peerj.7070 [PubMed]
- 16. Xiao Q, Cheng Z, Kuang W, Wu H, Luo X, Wang R. Clinical Value of PPM1G Gene in Survival Prognosis and Immune Infiltration of Hepatocellular Carcinoma. Appl Bionics Biomech. 2022; 2022:8926221. https://doi.org/10.1155/2022/8926221 [PubMed]
- 17. Hsiao YF, Cheng SB, Lai CY, Liu HT, Huang SC, Huang YC. The Prognostic Role of Glutathione and Its Related Antioxidant Enzymes in the Recurrence of Hepatocellular Carcinoma. Nutrients. 2021; 13:4071. https://doi.org/10.3390/nu13114071 [PubMed]
- 18. Liu MX, Jin L, Sun SJ, Liu P, Feng X, Cheng ZL, Liu WR, Guan KL, Shi YH, Yuan HX, Xiong Y. Metabolic reprogramming by PCK1 promotes TCA cataplerosis, oxidative stress and apoptosis in liver cancer cells and suppresses hepatocellular carcinoma. Oncogene. 2018; 37:1637–53. https://doi.org/10.1038/s41388-017-0070-6 [PubMed]
- 19. Zhou J, Zhang S, Chen Z, He Z, Xu Y, Li Z. CircRNA-ENO1 promoted glycolysis and tumor progression in lung adenocarcinoma through upregulating its host gene ENO1. Cell Death Dis. 2019; 10:885. https://doi.org/10.1038/s41419-019-2127-7 [PubMed]
- 20. Gao J, Zhao R, Xue Y, Niu Z, Cui K, Yu F, Zhang B, Li S. Role of enolase-1 in response to hypoxia in breast cancer: exploring the mechanisms of action. Oncol Rep. 2013; 29:1322–32. https://doi.org/10.3892/or.2013.2269 [PubMed]
- 21. Zhu W, Li H, Yu Y, Chen J, Chen X, Ren F, Ren Z, Cui G. Enolase-1 serves as a biomarker of diagnosis and prognosis in hepatocellular carcinoma patients. Cancer Manag Res. 2018; 10:5735–45. https://doi.org/10.2147/CMAR.S182183 [PubMed]
- 22. Cai K, El-Merahbi R, Loeffler M, Mayer AE, Sumara G. Ndrg1 promotes adipocyte differentiation and sustains their function. Sci Rep. 2017; 7:7191. https://doi.org/10.1038/s41598-017-07497-x [PubMed]
- 23. Li A, Zhu X, Wang C, Yang S, Qiao Y, Qiao R, Zhang J. Upregulation of NDRG1 predicts poor outcome and facilitates disease progression by influencing the EMT process in bladder cancer. Sci Rep. 2019; 9:5166. https://doi.org/10.1038/s41598-019-41660-w [PubMed]
- 24. Cheng J, Xie HY, Xu X, Wu J, Wei X, Su R, Zhang W, Lv Z, Zheng S, Zhou L. NDRG1 as a biomarker for metastasis, recurrence and of poor prognosis in hepatocellular carcinoma. Cancer Lett. 2011; 310:35–45. https://doi.org/10.1016/j.canlet.2011.06.001 [PubMed]
- 25. Zhou W, Huang K, Zhang Q, Ye S, Zhong Z, Zeng C, Peng G, Li L, Ye Q. LINC00844 promotes proliferation and migration of hepatocellular carcinoma by regulating NDRG1 expression. PeerJ. 2020; 8:e8394. https://doi.org/10.7717/peerj.8394 [PubMed]
- 26. Sekhar KR, Freeman ML. Nucleophosmin Plays a Role in Repairing DNA Damage and Is a Target for Cancer Treatment. Cancer Res. 2023; 83:1573–80. https://doi.org/10.1158/0008-5472.CAN-22-3631 [PubMed]
- 27. Xu G, Wu M, Chen LL. LETN and NPM1 tango in human nucleoli. Cell Res. 2021; 31:609–10. https://doi.org/10.1038/s41422-021-00471-3 [PubMed]
- 28. Singh AK, Krężel A. Calcium-assisted sortase A cleavage of SUMOylated metallothionein constructs leads to high-yield production of human MT3. Microb Cell Fact. 2023; 22:125. https://doi.org/10.1186/s12934-023-02134-x [PubMed]
- 29. Born E, Lipskaia L, Breau M, Houssaini A, Beaulieu D, Marcos E, Pierre R, Do Cruzeiro M, Lefevre M, Derumeaux G, Bulavin DV, Delcroix M, Quarck R, et al. Eliminating Senescent Cells Can Promote Pulmonary Hypertension Development and Progression. Circulation. 2023; 147:650–66. https://doi.org/10.1161/CIRCULATIONAHA.122.058794 [PubMed]
- 30. Gao Q, Zhang G, Zheng Y, Yang Y, Chen C, Xia J, Liang L, Lei C, Hu Y, Cai X, Zhang W, Tang H, Chen Y, et al. SLC27A5 deficiency activates NRF2/TXNRD1 pathway by increased lipid peroxidation in HCC. Cell Death Differ. 2020; 27:1086–104. https://doi.org/10.1038/s41418-019-0399-1 [PubMed]