


Introduction
Telomeres are recurring sequences that are situated at the ends of eukaryotic chromosomes. They serve to protect the chromosome ends from being released in the process of cell division [1]. The length of the telomere shortens with age, but the attrition rate varies among individuals [2]. Leukocyte telomere length (LTL) is a widely used biomarker for physiological aging, which reflects aging-related diseases and environmental factors [3]. A shorter LTL is reported to be associated with chronological age, paternal age, male sex, ethnicity, psychiatric disorders (i.e., major depressive disorder and affective disorder), low physical activity, low socioeconomic status, heavy alcohol consumption, smoking, late sleep-onset, short sleep duration, and obstructive sleep apnea [4–9]. In terms of attrition rate, shortening of LTL is related to chronological age, male sex, baseline LTL, smoking, obesity, less exercise, perceived stress, and high childhood trauma index [4, 8]. However, the association between sleep parameters and attrition of LTL is unclear.
Sleep disturbances are common in the elderly, and prevalence increases as the population ages [10]. Shorter telomere length was associated with both sleep quality and duration. Sleep quality measured by the Pittsburgh Sleep Quality Index (PSQI) attenuated the relationship between age and telomere length [11]. For sleep duration, both shorter and longer sleep durations are related to increased all-cause mortality and cardiovascular events [12]. Similarly, short sleep duration was associated with shorter LTL [5, 11, 13], while long sleep duration (>9 hours) showed a marginal association with faster LTL attrition [8]. Although the pathophysiological mechanism between sleep parameters and LTL is unclear, sleep disturbance might be related to cellular aging and damage [14]. Inappropriate sleep duration can cause inflammation, oxidative stress, and neuroendocrine control disorders [15–18]. These factors might contribute to the relationship between sleep and LTL.
To our knowledge, no reports have shown a significant correlation between sleep parameters and accelerated attrition of LTL (faster shortening of telomere length over time). We aimed to investigate the relationship between sleep parameters (including sleep duration, sleep latency, sleep quality, sleep efficiency, sleep disturbance, sleep medications, and daytime sleep dysfunction) and LTL attrition over two years, using data from an independent validation cohort of the Korea Brain Aging Study for the Early Diagnosis and Prediction of Alzheimer’s Disease (KBASE-V). Initially, the correlation between LTL attrition and sleep parameters was analyzed. Then, participants were dichotomized according to the degree of LTL attrition, and we investigated factors that could independently predict the faster shortening of LTL.
Methods
Participants
This study was performed by analyzing the data of participants in the KBASE-V, as described in a previous study [19], performed in accordance with the Good Clinical Practice guidelines and the Declaration of Helsinki, and approved by the institutional review board of each participating center (INHAUH 2015-03-021). The KBASE-V contains a nationwide cohort, including 167 cognitively unimpaired (CU), 72 mild cognitively impaired (MCI), and 56 Alzheimer’s disease dementia (ADD) participants from nine hospitals. All participants in the KBASE-V were aged 55–90 years. Each participant had a reliable informant, who provided investigators with required information. Each participant had a reliable informant who provided the investigators with required information. The exclusion criteria for this study included: (1) the presence of major psychiatric illness; (2) significant neurological or medical conditions, or comorbidities that could affect cognitive functions (except MCI or ADD); (3) contraindications for magnetic resonance imaging (MRI) (e.g., pacemaker, claustrophobia); (4) illiteracy; (5) severe visual or hearing difficulty, or serious communication or behavioral problems that could make a clinical examination or brain scan difficult; (6) use of an investigational drug; and (7) pregnancy or breastfeeding. Participants were eligible for inclusion in this study if they had both baseline and follow-up LTL measurements. We included 238 participants (143 CU, 51 MCI, and 44 ADD) in this study (Figure 1).
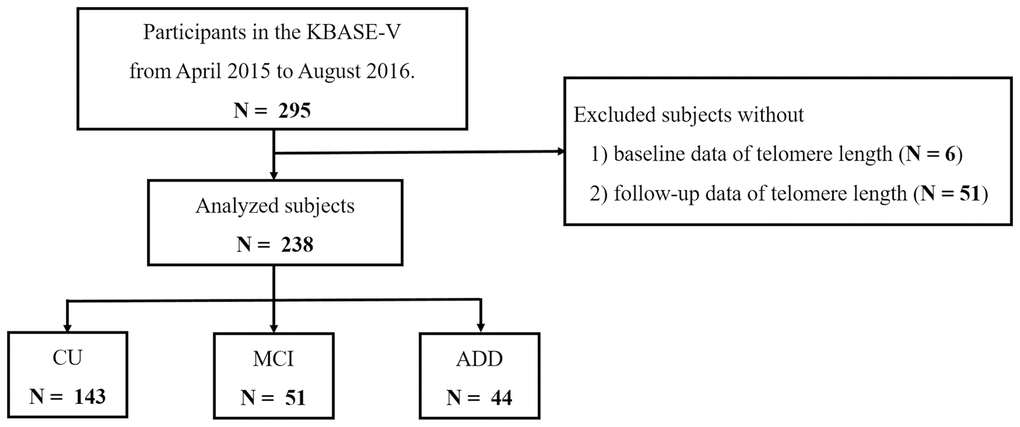
Figure 1. Flowchart of the analyzed subjects. Abbreviations: KBASE-V: Korea Brain Aging Study for the Early Diagnosis and Prediction of Alzheimer’s Disease; CU: cognitively unimpaired; MCI: mild cognitively impaired; ADD: Alzheimer’s disease dementia.
Clinical assessment including sleep parameters
All participants underwent physical and neurological examinations, including thorough diagnostic procedures that assessed participants’ cognition, abnormal behaviors, activities of daily living (ADL), demographic characteristics, family history, current medications, vascular risk factors (the presence of hypertension, diabetes, dyslipidemia, and smoking status), and other comorbidities using the Mini-Mental State Examination (MMSE) [20], Geriatric Depression Scale (GDS) [21], Blessed Dementia Scale-ADL [22], clinical dementia rating scale [23], and Consortium to Establish a Registry for Alzheimer’s Disease yearly [19, 20]. Brain MRI and laboratory tests, such as APOE genotyping, were performed at baseline.
Hypertension was defined as systolic blood pressure higher than or equal to 140 mmHg, diastolic blood pressure higher than or equal to 90 mmHg, or use of antihypertensive medication [24]. Diabetes mellitus was defined based on current treatment with insulin or oral hypoglycemic medication, 8-hour fasting plasma glucose ≥126 mg/dL, or HbA1c levels ≥6.5% [25]. Dyslipidemia was defined as total cholesterol ≥200 mg/dL, low-density lipoprotein cholesterol ≥130 mg/dL, high-density lipoprotein cholesterol level <40 mg/dl, and triglyceride level ≥150 mg/dL, or the use of lipid-lowering drugs [26]. We measured the participants’ weight, height, and handgrip. Body mass index (BMI) was calculated as weight (kg) divided by the square of height (m2).
The Pittsburgh Sleep Quality Index (PSQI), Stanford Sleepiness Scale (SSS), and Epworth Sleepiness Scale (ESS) were used for sleep evaluation. Global PSQI score greater than five was considered as poor quality of sleep [27], and ESS score greater than or equal to eleven was considered as excessive day time sleepiness [28]. The SSS (scores ranging from 1 to 7) was used to quantify the progressive steps in daytime sleepiness [29]. Based on the PSQI, each participant was instructed to report their respective subjective sleep quality, sleep duration, sleep latency, habitual sleep efficiency, use of sleeping medication, sleep disturbances, and daytime dysfunction during the last month [27]. We used bioelectrical impedance analysis to measure the appendicular skeletal muscle mass index (ASMI) and proportion of fat.
Brain MRI
All participants underwent brain MRI; a 3.0 T magnetic resonance scanner was used to capture 3D T1- and T2-weighted SPACE sagittal images with 0.8-mm thickness. Alzheimer’s disease neuroimaging initiative phase 2 MRI protocols were used in the brain MRI of this study [19, 30]. The 3D T1-weighted MRI parameters were as follows: repetition time (TR) = 2300 ms, echo time (TE) = 2.14 ms, inversion time (TI) = 900 ms, flip angle (FA) = 9°, and voxel resolution = 0.8 × 0.8 × 0.8 mm3, in the Skyra and Trio Tim scanners (Siemens, Washington, DC, USA); TR = 7.32 ms, TE = 3.02 ms, TI = 400 ms, FA = 11°, and voxel resolution = 0.8 × 0.8 × 0.8 mm3, in the General Electric (GE) Discovery MR750 scanner (GE Healthcare, Milwaukee, WI, USA); and TR = shortest (6.8 ms), TE = shortest (3.1 ms), FA = 9°, and voxel resolution = 0.8 × 0.8 × 0.8 mm3, in the Achieva scanner (Philips Healthcare, Andover, MA, USA).
The measured MRI data were analyzed as described previously using CIVET pipeline version 2.1, (http://mcin-cnim.ca/neuroimagingtechnologies/civet/) [19, 31]. The corrected T1-weighted images were segmented into the left and right sides of the hippocampus using FMRIB’s integrated registration and segmentation tool [32]. The volumes of the hippocampus were normalized to the total intracranial volume.
Positive amyloid pathologic change (amyloid β biomarkers)
Amyloid pathologic change was considered positive when individuals displayed an abnormal Aβ biomarker considered by cortical amyloid positron electron tomography (PET) ligand binding and/or low cerebrospinal fluid (CSF) Aβ42 [33]. Of the total 199 participants in this study, 159 (79.9%) underwent amyloid PET at baseline. Sixty participants underwent 11C-PiB PET and ninety-nine underwent 18F-flutemetamol PET. CSF was collected from 100 participants (50.3%). In total, 184 (92.5%) participants were tested for Aβ biomarkers and 49 (24.6%) were positive.
The PET methods for each tracer and CSF analysis have been previously described [19, 34]. The standard uptake value ratio (SUVR) was obtained using the pons as a reference region on 18F-flutemetamol PET and the cerebellar gray matter as the reference region on 11C-PiB PET. Composite SUVR values were obtained by averaging the SUVR values for the frontal, temporal, parietal, occipital, anterior cingulate, and posterior cingulate/precuneus cortices. Based on previous work, elevated Aβ PET was defined as a composite SUVR higher than or equal to 0.634 on 18F-flutemetamol PET, and a composite SUVR higher than 1.21 on 11C-PiB PET [33]. The levels of Aβ42, t-tau, and p-tau in the CSF were measured using the multiplex xMAP Luminex platform with INNO-BIA AlzBio3 kits (Fujirebio Europe, Ghent, Belgium) as described in detail in a previous paper [19]. Based on the previous work, participants who underwent CSF studies were deemed to have Alzheimer’s disease pathology when the CSF Aβ42 was 433.68 pg/ml or lower.
Telomere length assay
LTL was examined at the time when blood is collected (baseline and after 1 year) from participants. DNA was extracted from whole blood using G-DEXTM IIb RBC lysis buffer and G-DEXTM IIb cell lysis buffer (Intron, MA, USA). DNA hydration was performed using 300 μL of DNA hydration solution (QIAGEN, Hilden, Germany). Telomere length (TL) analysis was carried out using a nonradioactive TeloTAGGG TL Assay (Roche Boehringer-Mannheim, Grenzach-Wyhlen, Germany), as described by the manufacturer. Approximately 2–4 μg of DNA from each sample was digested with Hinf I/RsaI enzyme mix and isolated by gel electrophoresis. DNA fragments were transferred to a nylon membrane (Millipore, Bedford, MA, USA) by Southern transfer and hybridized to a digoxigenin (DIG)-labeled probe specific for telomeric repeats. The membrane was incubated with DIG-specific antibodies conjugated to alkaline phosphatase, and the probe was visualized by chemiluminescence using an image analyzer (ImageQuant LAS 4000, GE Healthcare, Little Chalfont, UK). The mean telomeric repeat-binding factor lengths were determined by comparison with the molecular weight standards.
LTL was measured in all participants who provided blood samples. All LTLs were analyzed by two researchers who were blinded to the patient information. The intraclass correlation coefficient (ICC) of the two raters was 0.905, indicating excellent reliability.
Statistical analysis
Sample distribution was tested using the Kolmogorov-Smirnov test for factors, including sleep parameters and LTL. Data on LTL, education, ASMI, hand grip, sleep duration, sleep latency, PSQI, and ESS score are presented as median (interquartile range) as they did not present with normal distribution. Participants were grouped by initial diagnosis, sleep duration, sleep latency, and sleep efficacy, according to PSQI. Changes in LTL were compared among the groups using the Kruskal-Wallis test. When statistically significant overall differences were detected, the Mann-Whitney U test with Bonferroni correction was performed to analyze differences among subgroups. Within each group, differences in LTL between baseline and follow-up (two years later) were compared using the Wilcoxon signed-rank test (Supplementary Figures 1–4). Nonparametric correlations between sleep parameters and changes in LTL were calculated using Spearman’s test. All LTL levels were measured twice by independent researchers to reduce the expected error in measurements. The ICC was calculated to assess the reliability of LTL measurement. The ICC values between 0.75 and 0.9 indicate good reliability and values higher than 0.9 indicate excellent reliability [35]. The average LTL of the two raters was used in this study. As there are no criteria for faster shortening of LTL, the median value of LTL shortening (cut-off point: −0.710 kbp) was used to dichotomize the participants. Participants with faster shortening of LTL were considered as group 1, while those with slower shortening of LTL as group 2. We compared two groups using Pearson’s chi-square test for categorical variables and Student t-test and the Mann-Whitney U test for continuous variables. To assess the relationship between various parameters, including sleep factors and changes in LTL, logistic regression analyses were performed. Adjusted variables were age, sex, and factors selected from the results of the univariate analysis [P < 0.1 in univariate analysis (dyslipidemia and osteoporosis) (model 1)]. We additionally adjusted for the average of baseline and follow-up LTL in the final analysis (model 2). Statistical significance was set at a two-tailed p-value of < 0.05. All statistical analyses were performed using SPSS for Windows (version 21.0; SPSS Inc., Chicago, IL, USA).
Results
A total of 238 (143 CU, 51 MCI, and 44 ADD) patients having both baseline and follow-up LTL measurements and were included in this study. Among them, 143 (60.1%) were women. Participants’ ages ranged from 55 to 88 years, with a mean ± SD of 70.2 ± 8.2 years. Overall, the average BMI was 24.2 ± 3.1 kg/m2 and the global PSQI score was 7.6 ± 3.6. The mean duration of sleep was 6.4 ± 1.7 hours and sleep latency (mean ± SD) was 26.7 ± 28.9 minutes. Baseline LTL (mean ± SD) was 7.82 ± 1.81 (CU: 8.01 ± 2.00, MCI: 7.57 ± 1.32, AD: 7.53 ± 1.55) kbp and follow-up LTL was 6.69 ± 0.85 (CU: 6.808 ± 0.85, MCI: 6.53 ± 0.84, AD: 6.53 ± 0.81) kbp. Shortening of LTL was significantly higher in patients who sleep <5 hours than in those who sleep ≥7 hours (Figure 2B). Also shortening of LTL was higher in patients with sleep efficiency <65% than in those with sleep efficiency ≥85% (Figure 2D). However, there were no significant differences in LTL shortening based on initial diagnosis or sleep latency (Figure 2A, 2C).
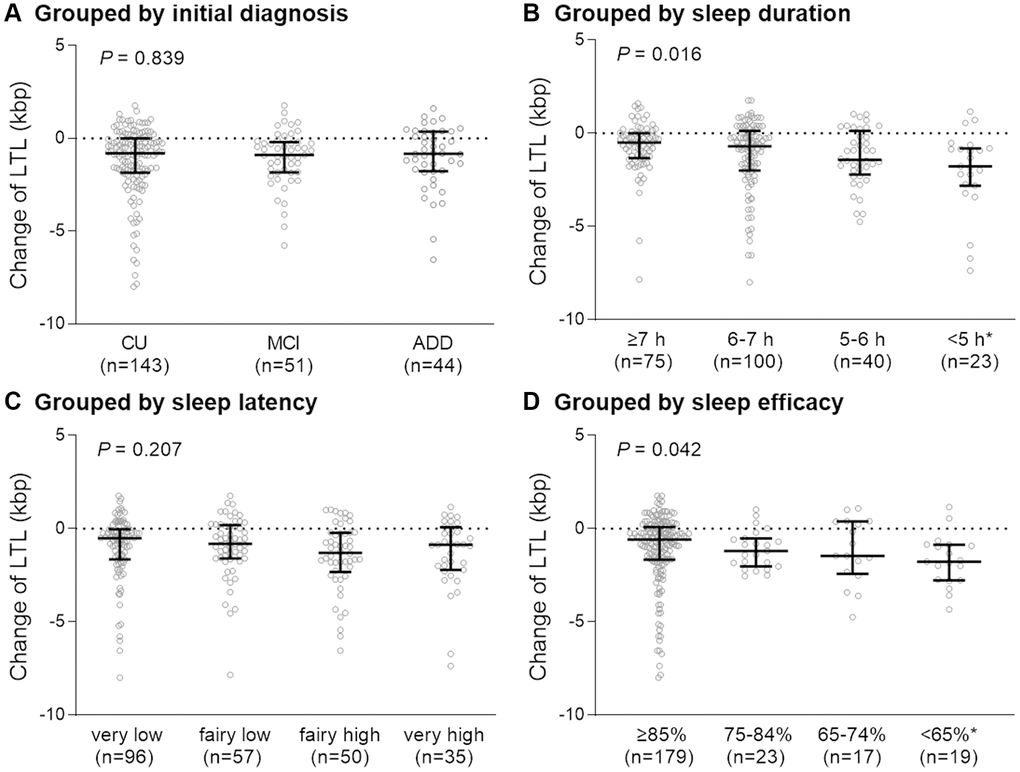
Figure 2. Degree of change in telomere length over two years in each group. Participants were grouped according to initial diagnosis (A), sleep duration (B), sleep latency (C), and sleep efficacy (D). Abbreviations: LTL: leukocyte telomere length; CU: cognitively unimpaired, MCI: mild cognitively impaired; ADD: Alzheimer’s disease dementia; h: hours. P-value for the Kruskal-Wallis test. *P < 0.05 compared with the first group (sleep ≥7 h or sleep efficiency ≥85%).
Participants were dichotomized according to the shortening of LTL and compared as follows: faster shortening of LTL (group 1) vs. slower shortening of LTL (group 2). The baseline demographic and clinical characteristics of the two groups are shown in Table 1. Osteoporosis was more prevalent in group 1. Participants in group 1 had longer baseline LTL and shorter follow-up LTL. Other factors, including cognitive stage, being a current smoker, past medical history (except osteoporosis), positive amyloid pathology, APOE e4 carrier status, MMSE score, GDS score, exercise status, and power of handgrip, did not differ between the two groups.
Table 1. Baseline characteristics of patients according to attrition of LTL.
| Attrition of LTL | p | ||||||||||||||||||||||||||||||||||||||||||||||||||||||||||||||||||||||||||||||||||||||||||||||||||
| Faster, group 1 (n = 119) | Slower, group 2 (n = 119) | ||||||||||||||||||||||||||||||||||||||||||||||||||||||||||||||||||||||||||||||||||||||||||||||||||
| Demographics | |||||||||||||||||||||||||||||||||||||||||||||||||||||||||||||||||||||||||||||||||||||||||||||||||||
| Age, years | 70.5 ± 8.0 | 69.9 ± 8.6 | 0.583 | ||||||||||||||||||||||||||||||||||||||||||||||||||||||||||||||||||||||||||||||||||||||||||||||||
| Sex, female (%) | 77 (64.7) | 66 (55.5) | 0.145 | ||||||||||||||||||||||||||||||||||||||||||||||||||||||||||||||||||||||||||||||||||||||||||||||||
| Live alone | 18 (15.3) | 17 (14.5) | 0.876 | ||||||||||||||||||||||||||||||||||||||||||||||||||||||||||||||||||||||||||||||||||||||||||||||||
| BMI, kg/m2 | 24.2 ± 2.8 | 24.2 ± 3.1 | 0.974 | ||||||||||||||||||||||||||||||||||||||||||||||||||||||||||||||||||||||||||||||||||||||||||||||||
| Education, years (IQR) | 9.0 (6.0, 13.0) | 10.0 (6.0, 13.0) | 0.783* | ||||||||||||||||||||||||||||||||||||||||||||||||||||||||||||||||||||||||||||||||||||||||||||||||
| Baseline telomere length (kbp) | 8.215 (7.355, 9.815) | 6.87 (6.375, 7.16) | <0.001* | ||||||||||||||||||||||||||||||||||||||||||||||||||||||||||||||||||||||||||||||||||||||||||||||||
| Follow up telomere length (kbp) | 6.265 (5.79, 6.95) | 6.84 (6.365, 7.465) | <0.001* | ||||||||||||||||||||||||||||||||||||||||||||||||||||||||||||||||||||||||||||||||||||||||||||||||
| Change of telomere length (kbp) | −1.81 (−2.805, −1.25) | −0.005 (−0.415, 0.475) | <0.001* | ||||||||||||||||||||||||||||||||||||||||||||||||||||||||||||||||||||||||||||||||||||||||||||||||
| Cognitive stage | 0.987 | ||||||||||||||||||||||||||||||||||||||||||||||||||||||||||||||||||||||||||||||||||||||||||||||||||
| Cognitive unimpaired (%) | 71 (59.7) | 72 (60.5) | |||||||||||||||||||||||||||||||||||||||||||||||||||||||||||||||||||||||||||||||||||||||||||||||||
| Mild cognitive impairment (%) | 26 (21.8) | 25 (21.0) | |||||||||||||||||||||||||||||||||||||||||||||||||||||||||||||||||||||||||||||||||||||||||||||||||
| Dementia (%) | 22 (18.5) | 22 (18.5) | |||||||||||||||||||||||||||||||||||||||||||||||||||||||||||||||||||||||||||||||||||||||||||||||||
| Medical History | |||||||||||||||||||||||||||||||||||||||||||||||||||||||||||||||||||||||||||||||||||||||||||||||||||
| Hypertension** | 53/118 (44.9) | 53/118 (44.9) | 1.000 | ||||||||||||||||||||||||||||||||||||||||||||||||||||||||||||||||||||||||||||||||||||||||||||||||
| Diabetes mellitus | 17 (14.3) | 20 (16.8) | 0.591 | ||||||||||||||||||||||||||||||||||||||||||||||||||||||||||||||||||||||||||||||||||||||||||||||||
| Dyslipidemia** | 47/115 (40.9) | 36/118 (30.5) | 0.099 | ||||||||||||||||||||||||||||||||||||||||||||||||||||||||||||||||||||||||||||||||||||||||||||||||
| Coronary artery disease** | 7/119 (5.9) | 6 (5.1) | 0.787 | ||||||||||||||||||||||||||||||||||||||||||||||||||||||||||||||||||||||||||||||||||||||||||||||||
| Cerebrovascular disease | 4 (3.4) | 7 (5.9) | 0.354 | ||||||||||||||||||||||||||||||||||||||||||||||||||||||||||||||||||||||||||||||||||||||||||||||||
| Osteoporosis | 20 (16.8) | 9 (7.6) | 0.029 | ||||||||||||||||||||||||||||||||||||||||||||||||||||||||||||||||||||||||||||||||||||||||||||||||
| Osteoarthritis | 25 (21.0) | 19 (16.0) | 0.378 | ||||||||||||||||||||||||||||||||||||||||||||||||||||||||||||||||||||||||||||||||||||||||||||||||
| Current smoker | 3 (2.5) | 4 (2.5) | 0.667 | ||||||||||||||||||||||||||||||||||||||||||||||||||||||||||||||||||||||||||||||||||||||||||||||||
| Taking more than three pills | 67 (56.8) | 70 (59.3) | 0.692 | ||||||||||||||||||||||||||||||||||||||||||||||||||||||||||||||||||||||||||||||||||||||||||||||||
| Hippocampal volume, cm3 | 48.0 ± 9.2 | 48.6 ± 8.6 | 0.598 | ||||||||||||||||||||||||||||||||||||||||||||||||||||||||||||||||||||||||||||||||||||||||||||||||
| Positive amyloid pathology | 41 (41.4) | 35 (35.7) | 0.411 | ||||||||||||||||||||||||||||||||||||||||||||||||||||||||||||||||||||||||||||||||||||||||||||||||
| APOE ε4 carrier | 36 (30.3) | 25 (21.0) | 0.102 | ||||||||||||||||||||||||||||||||||||||||||||||||||||||||||||||||||||||||||||||||||||||||||||||||
| MMSE score, median (IQR) | 26.0 (22.0, 29.0) | 25·0 (21.0, 28.0) | 0.150* | ||||||||||||||||||||||||||||||||||||||||||||||||||||||||||||||||||||||||||||||||||||||||||||||||
| CDR score, median (IQR) | 0.0 (0.0, 0.5) | 0·0 (0.0, 0.5) | 0.887* | ||||||||||||||||||||||||||||||||||||||||||||||||||||||||||||||||||||||||||||||||||||||||||||||||
| CDR-SOB score, median (IQR) | 0.0 (0.0, 1.0) | 0·0 (0.0, 1.0) | 0.829* | ||||||||||||||||||||||||||||||||||||||||||||||||||||||||||||||||||||||||||||||||||||||||||||||||
| GDS score, median (IQR) | 8.0 (4.0, 14.0) | 8·0 (4.0, 12.5) | 0.708* | ||||||||||||||||||||||||||||||||||||||||||||||||||||||||||||||||||||||||||||||||||||||||||||||||
| Active exercise† | 20 (16.8) | 23 (19.3) | 0.613 | ||||||||||||||||||||||||||||||||||||||||||||||||||||||||||||||||||||||||||||||||||||||||||||||||
| Passive exercise† | 27 (22.7) | 30 (25.2) | 0.649 | ||||||||||||||||||||||||||||||||||||||||||||||||||||||||||||||||||||||||||||||||||||||||||||||||
| Meeting the PA guideline‡ | 28 (23.5) | 28 (23.5) | 1.000 | ||||||||||||||||||||||||||||||||||||||||||||||||||||||||||||||||||||||||||||||||||||||||||||||||
| ASMI, kg/m2 (IQR) | 8.42 (7.85, 9.68) | 8.70 (7.87, 9.89) | 0.283* | ||||||||||||||||||||||||||||||||||||||||||||||||||||||||||||||||||||||||||||||||||||||||||||||||
| Percentage of body fat, % | 30.6 ± 7.2 | 30.4 ± 7.2 | 0.859 | ||||||||||||||||||||||||||||||||||||||||||||||||||||||||||||||||||||||||||||||||||||||||||||||||
| Handgrip, kg (IQR) | 24.9 (19.6, 30.8) | 24.5 (19.3, 32.3) | 0.942* | ||||||||||||||||||||||||||||||||||||||||||||||||||||||||||||||||||||||||||||||||||||||||||||||||
| MNA (IQR, range: 0–30) | 25.0 (23.0, 26.0) | 24.5 (23.0, 26.0) | 0.752* | ||||||||||||||||||||||||||||||||||||||||||||||||||||||||||||||||||||||||||||||||||||||||||||||||
| Data are presented as mean ± SD or number (%), unless otherwise indicated. Abbreviations: LTL: leukocyte telomere length; MMSE: Mini-Mental State Examination; IQR: interquartile range; CDR-SOB: Clinical Rating Scale Sum of Boxes; GDS: Geriatric Depression Scale; PA: physical activity; ASMI: appendicular skeletal muscle mass index; MNA: Mini Nutritional Assessment. *Missing values are presented. Student’s t-test, Pearson’s chi-square test, and **Mann-Whitney U test were used. †Once or more during the last one week. ‡≥600 metabolic equivalent minutes of physical activity per week. | |||||||||||||||||||||||||||||||||||||||||||||||||||||||||||||||||||||||||||||||||||||||||||||||||||
The sleep parameters in relation to the degree of longitudinal shortening of LTL are shown in Table 2. Group 1 had a shorter duration of sleep (P = 0.013) and longer sleep latency (P = 0.007). Among the components of the PSQI, subjective measures of sleep quality (P = 0.037), sleep latency (P = 0.014), sleep duration (P < 0.001), and sleep efficiency (P < 0.001) were significantly worse in group 1. Other factors, including sleep disturbance, sleep medication, daytime sleep dysfunction, ESS score, and SSS score, were not different between the two groups.
Table 2. Sleep parameters in relation to longitudinal shortening of LTL.
| Attrition of LTL | p | ||||||||||||||||||||||||||||||||||||||||||||||||||||||||||||||||||||||||||||||||||||||||||||||||||
| Faster (n = 119) | Slower (n = 119) | ||||||||||||||||||||||||||||||||||||||||||||||||||||||||||||||||||||||||||||||||||||||||||||||||||
| Duration of sleep, hour (IQR) | 6.0 (5.0, 7.0) | 7.0 (6.0, 8.0) | 0.008* | ||||||||||||||||||||||||||||||||||||||||||||||||||||||||||||||||||||||||||||||||||||||||||||||||
| Sleep latency, minute (IQR) | 25.0 (10.0, 30.0) | 10.0 (5.0, 30.0) | 0.016* | ||||||||||||||||||||||||||||||||||||||||||||||||||||||||||||||||||||||||||||||||||||||||||||||||
| PSQI | |||||||||||||||||||||||||||||||||||||||||||||||||||||||||||||||||||||||||||||||||||||||||||||||||||
| Global score (range: 0–21) | 7.0 (5.0, 11.0) | 6.0 (5.0, 8.0) | 0.002* | ||||||||||||||||||||||||||||||||||||||||||||||||||||||||||||||||||||||||||||||||||||||||||||||||
| Sleep quality (IQR, range: 0–3) | 2.0 (2.0, 3.0) | 2.0 (2.0, 2.0) | 0.037* | ||||||||||||||||||||||||||||||||||||||||||||||||||||||||||||||||||||||||||||||||||||||||||||||||
| Sleep latency (IQR, range: 0–3) | 1.0 (0.0, 2.0) | 1.0 (0.0, 2.0) | 0.014* | ||||||||||||||||||||||||||||||||||||||||||||||||||||||||||||||||||||||||||||||||||||||||||||||||
| Sleep duration (IQR, range: 0–3) | 1.0 (1.0, 2.0) | 1.0 (0.0, 1.0) | <0.001* | ||||||||||||||||||||||||||||||||||||||||||||||||||||||||||||||||||||||||||||||||||||||||||||||||
| Sleep efficiency (IQR, range: 0–3) | 0.0 (0.0, 1.0) | 0.0 (0.0, 0.0) | 0.001* | ||||||||||||||||||||||||||||||||||||||||||||||||||||||||||||||||||||||||||||||||||||||||||||||||
| Sleep disturbance (IQR, range: 0–3) | 1.0 (1.0, 1.0) | 1.0 (1.0, 1.0) | 0.269* | ||||||||||||||||||||||||||||||||||||||||||||||||||||||||||||||||||||||||||||||||||||||||||||||||
| Sleep medication (IQR, range: 0–3) | 0.0 (0.0, 0.0) | 0.0 (0.0, 0.0) | 0.749* | ||||||||||||||||||||||||||||||||||||||||||||||||||||||||||||||||||||||||||||||||||||||||||||||||
| Daytime sleep dysfunction (IQR, range: 0–3) | 1.0 (1.0, 2.0) | 1.0 (1.0, 2.0) | 0.307* | ||||||||||||||||||||||||||||||||||||||||||||||||||||||||||||||||||||||||||||||||||||||||||||||||
| Poor quality sleep (PSQI > 5) | 86 (72.3) | 73 (61.3) | 0.074† | ||||||||||||||||||||||||||||||||||||||||||||||||||||||||||||||||||||||||||||||||||||||||||||||||
| ESS score (IQR) | 4.0 (2.0, 5.0) | 4.0 (2.0, 6.0) | 0.350 | ||||||||||||||||||||||||||||||||||||||||||||||||||||||||||||||||||||||||||||||||||||||||||||||||
| Excessive daytime sleepiness (ESS > 11) | 6 (5.0) | 5 (4.2) | 0.758† | ||||||||||||||||||||||||||||||||||||||||||||||||||||||||||||||||||||||||||||||||||||||||||||||||
| Stanford Sleepiness Scale (IQR) | 2.0 (1.0, 3.0) | 2.0 (1.0, 2.0) | 0.734* | ||||||||||||||||||||||||||||||||||||||||||||||||||||||||||||||||||||||||||||||||||||||||||||||||
| Severe snoring, ≥1/week | 73 (61.3) | 59 (49.6) | 0.068† | ||||||||||||||||||||||||||||||||||||||||||||||||||||||||||||||||||||||||||||||||||||||||||||||||
| Witnessed apnea, ≥1/week | 72 (60.5) | 59 (49.6) | 0.090† | ||||||||||||||||||||||||||||||||||||||||||||||||||||||||||||||||||||||||||||||||||||||||||||||||
| Data are presented as mean ± SD, number (%), or indicated. Abbreviations: LTL: leukocyte telomere length; IQR: interquartile range; PSQI: Pittsburgh Sleep Quality Index; ESS: Epworth sleepiness scale. Student’s t-test, †Pearson chi-square test, and *Mann-Whitney U test were use. | |||||||||||||||||||||||||||||||||||||||||||||||||||||||||||||||||||||||||||||||||||||||||||||||||||
Multivariate logistic regression analysis after adjusting for age, sex, osteoporosis, and dyslipidemia showed that sleep duration (odds ratio [OR] = 0.829, 95% confidence interval [CI] = 0.701–0.982, 90% CI = 0.720–0.955, P = 0.030), sleep latency (OR = 1.012, 95% CI = 1.001–1.022, 90% CI = 1.003–1.021, P = 0.030), and global PSQI score (OR =1.117, 95% CI = 1.030–1.213, 90% CI = 1.043–1.197, P = 0.008) predicted faster LTL shortening. Among the PSQI, fairly bad to very good subjective sleep quality ratio (OR = 2.623, 95% CI = 1.054–6.527, 90% CI = 1.221–5.637, P = 0.038), shortest to longest sleep duration ratio (OR = 5.587, 95% CI = 1.781–17.529, 90% CI = 2.140–14.586, P = 0.003), 5–6 hours to longest sleep duration ratio (OR = 2.774, 95% CI = 1.201–6.408, 90% CI = 1.374–5.601, P = 0.017), and lowest to highest sleep efficiency ratio (OR = 6.093, 95% CI = 1.662–22.339, 90% CI 2.048–18.128, P = 0.006) were associated with faster LTL shortening (Table 3).
Table 3. Multivariable logistic regression analysis predicting faster shortening of telomere length by sleep parameters.
| Unadjusted OR | Model 1 | p | Model 2 | p | |||||||||||||||||||||||||||||||||||||||||||||||||||||||||||||||||||||||||||||||||||||||||||||||
| Sleep duration, per 1 hour | 0.818 (0.696–0.962) | 0.829 (0.701–0.982) | 0.030 | 0.831 (0.698–0.989) | 0.037 | ||||||||||||||||||||||||||||||||||||||||||||||||||||||||||||||||||||||||||||||||||||||||||||||
| Sleep latency, per 1 minute | 1.014 (1.003–1.025) | 1.012 (1.001–1.022) | 0.030 | 1.013 (1.002–1.024) | 0.020 | ||||||||||||||||||||||||||||||||||||||||||||||||||||||||||||||||||||||||||||||||||||||||||||||
| Global PSQI score | 1.140 (1.055–1.233) | 1.117 (1.030–1.213) | 0.008 | 1.134 (1.040–1.236) | 0.004 | ||||||||||||||||||||||||||||||||||||||||||||||||||||||||||||||||||||||||||||||||||||||||||||||
| Sleep quality | |||||||||||||||||||||||||||||||||||||||||||||||||||||||||||||||||||||||||||||||||||||||||||||||||||
| 0 (very good) | 1 [ref] | 1 [ref] | 1 [ref] | ||||||||||||||||||||||||||||||||||||||||||||||||||||||||||||||||||||||||||||||||||||||||||||||||
| 1 (fairly good) | 1.171 (0.566–2.420) | 1.084 (0.516–2.279) | 0.832 | 1.187 (0.533–2.644) | 0.673 | ||||||||||||||||||||||||||||||||||||||||||||||||||||||||||||||||||||||||||||||||||||||||||||||
| 2 (fairly bad) | 3.117 (1.286–7.554) | 2.623 (1.054–6.527) | 0.038 | 2.876 (1.080–7.661) | 0.035 | ||||||||||||||||||||||||||||||||||||||||||||||||||||||||||||||||||||||||||||||||||||||||||||||
| 3 (very bad) | 0.786 (0.196–3.145) | 0.574 (0.134–2.465) | 0.455 | 0.645 (0.135–3.096) | 0.584 | ||||||||||||||||||||||||||||||||||||||||||||||||||||||||||||||||||||||||||||||||||||||||||||||
| Sleep latency | |||||||||||||||||||||||||||||||||||||||||||||||||||||||||||||||||||||||||||||||||||||||||||||||||||
| 0 (very low) | 1 [ref] | 1 [ref] | 1 [ref] | ||||||||||||||||||||||||||||||||||||||||||||||||||||||||||||||||||||||||||||||||||||||||||||||||
| 1 (fairly low) | 1.514 (0.782–2.929) | 1.510 (0.764–2.987) | 0.236 | 2.055 (0.964–4.385) | 0.062 | ||||||||||||||||||||||||||||||||||||||||||||||||||||||||||||||||||||||||||||||||||||||||||||||
| 2 (fairly high) | 2.385 (1.182–4.809) | 1.950 (0.937–4.060) | 0·074 | 1.982 (0.905–4.341) | 0.087 | ||||||||||||||||||||||||||||||||||||||||||||||||||||||||||||||||||||||||||||||||||||||||||||||
| 3 (very high) | 1.949 (0.890–4.266) | 1.625 (0.716–3.688) | 0.264 | 1.823 (0.775–4.290) | 0.169 | ||||||||||||||||||||||||||||||||||||||||||||||||||||||||||||||||||||||||||||||||||||||||||||||
| Sleep duration | |||||||||||||||||||||||||||||||||||||||||||||||||||||||||||||||||||||||||||||||||||||||||||||||||||
| 0 (≥7 h) | 1 [ref] | 1 [ref] | 1 [ref] | ||||||||||||||||||||||||||||||||||||||||||||||||||||||||||||||||||||||||||||||||||||||||||||||||
| 1 (6–7 h) | 1.407 (0.765–2.585) | 1.472 (0.774–2.801) | 0.239 | 1.124 (0.559–2.259) | 0.744 | ||||||||||||||||||||||||||||||||||||||||||||||||||||||||||||||||||||||||||||||||||||||||||||||
| 2 (5–6 h) | 2.644 (1.199–5.831) | 2.774 (1.201–6.408) | 0.017 | 2.659 (1.098–6.438) | 0.030 | ||||||||||||||||||||||||||||||||||||||||||||||||||||||||||||||||||||||||||||||||||||||||||||||
| 3 (<5 h) | 5.710 (1.912–17.059) | 5.587 (1.781–17.529) | 0.003 | 5.173 (1.563–17.126) | 0.007 | ||||||||||||||||||||||||||||||||||||||||||||||||||||||||||||||||||||||||||||||||||||||||||||||
| Sleep efficiency | |||||||||||||||||||||||||||||||||||||||||||||||||||||||||||||||||||||||||||||||||||||||||||||||||||
| 0 (≥85%) | 1 [ref] | 1 [ref] | 1 [ref] | ||||||||||||||||||||||||||||||||||||||||||||||||||||||||||||||||||||||||||||||||||||||||||||||||
| 1 (75–84%) | 2.373 (0.958–5.881) | 2.124 (0.834–5.413) | 0.114 | 3.072 (1.147–8.231) | 0.026 | ||||||||||||||||||||||||||||||||||||||||||||||||||||||||||||||||||||||||||||||||||||||||||||||
| 2 (65–74%) | 1.424 (0.525–3.859) | 1.298 (0.467–3.605) | 0.617 | 0.987 (0.322–3.021) | 0.987 | ||||||||||||||||||||||||||||||||||||||||||||||||||||||||||||||||||||||||||||||||||||||||||||||
| 3 (<65%) | 6.751 (1.900–23.990) | 6.093 (1.662–22.339) | 0.006 | 7.351 (1.934–27.946) | 0.003 | ||||||||||||||||||||||||||||||||||||||||||||||||||||||||||||||||||||||||||||||||||||||||||||||
| Osteoporosis | 2.469 (1.074–5.675) | 2.288 (0.961–5.445) | 0.061 | 2.197 (0.884–5.462) | 0.090 | ||||||||||||||||||||||||||||||||||||||||||||||||||||||||||||||||||||||||||||||||||||||||||||||
| p for multivariate models. Data are presented as odds ratios (95% confidence interval). Model 1: Adjusted for age, sex, osteoporosis, and dyslipidemia. Model 2: Additionally adjusted for the average of baseline and follow-up leukocyte telomere length (LTL). | |||||||||||||||||||||||||||||||||||||||||||||||||||||||||||||||||||||||||||||||||||||||||||||||||||
After additional adjustment for the average of baseline and follow-up LTL, sleep duration (OR = 0.831, 95% CI = 0.698–0.989, 90% CI = 0.718–0.961, P = 0.037), sleep latency (OR = 1.013, 95% CI = 1.002–1.024, 90% CI = 1.004–1.022, P = 0.020), global PSQI score (OR = 1.134, 95% CI = 1.040–1.236, 90% CI = 1.054–1.219, P = 0.004), shortest to longest sleep duration ratio (OR = 5.173, 95% CI = 1.563–17.126, 90% CI = 1.894–14.128, P = 0.007), 5–6 hours to longest sleep duration ratio (OR = 2.659, 95% CI = 1.098–6.438, 90% CI = 1.266–5.585, P = 0.030), and lowest to highest sleep efficiency ratio (OR = 7.351, 95% CI = 1.934–27.946, 90% CI = 2.397–22.547, P = 0.003) were independently associated with faster LTL shortening.
Discussion
This study demonstrated that a higher global PSQI score, shorter sleep duration, and longer sleep latency were consistently associated with faster LTL shortening. Among the components of the PSQI, the shortest sleep duration (<5 hours), and lowest sleep efficiency (<65%) were significantly associated with faster shortening of LTL. To our knowledge, this study is the first to show a significant relationship between sleep parameters and accelerated attrition of LTL.
Previous cross-sectional studies that examined the association between sleep parameters and LTL showed conflicting results. From the Whitehall II cohort study, Jackowska and colleagues found a significant linear relationship between sleep duration and LTL in men but not in women [13]. Sleep duration of at least 7 hours had longer LTL than those with sleep duration of less than 7 hours, in patients with human immunodeficiency virus [36]. However, sleep quality was not associated with LTL [36]. Sleep duration or sleep quality did not predict LTL on their own in a sample of middle-aged to older adults, but they moderated the relationship between age and LTL [11]. However, another study showed that poor sleep quality predicts shorter LTL in women aged 49–66 years [37]. Sleep quality was related to shorter TL of specific immune cells in obese individuals [38]. In children, shorter sleep duration was associated with shorter LTL [17]. Insomnia was associated with short LTL at age 70–88 years, but this was not significant at age 60–69 years [14]. The reason the results differ between studies seems to be that diverse factors influence the attrition rate of telomere length, and the degree of this influence may differ according to age, sex, and comorbidities of participants.
A recent report analyzed the association between sleep parameters and attrition of LTL over six years using data from the Netherlands Study of Depression and Anxiety (NESDA) [5]. However, they could not find any sleep parameters that predicted faster shortening of LTL [5]. Including older individuals (initial mean age ± SD of the current study vs. the NESDA, 70.2 ± 8.2, vs. 41.8 ± 13.1 years) in our study might reveal a significant relationship between sleep parameters and changes in LTL over time.
The biological mechanisms linking sleep quality and LTL need to be further elucidated. However, inflammation, oxidative stress, increment of sympathetic tone, and secretion of cortisol are possible mechanisms that explain the association between them. Sleep deprivation and disrupted sleep quality increase inflammatory cytokines and oxidative stress [39, 40]. Accumulation of inflammatory burden and oxidative stress may increase LTL loss [41]. Oxidative stress is also known to be associated with premature aging and shortening of LTL [42]. Sleep disturbance has effects on autonomic dysfunction [16], catecholamine level [43], and cortisol secretion [44], which might also contribute to the shortening of LTL [45].
There are some limitations in our study. First, objective measurements, such as actinography, polysomnography, melatonin level, or telomerase activity, were not analyzed. Therefore, we could not evaluate obstructive sleep apnea, which is known to be associated with LTL [7]. Although PSQI is well validated and self-reported sleep duration is similar to objective measurements [38, 46], future studies should consider including objective measurements. Second, the two-year follow-up period may be too short to reveal a significant relationship between LTL attrition and other factors (such as osteoporosis and APOE ε4 carrier status), and the number of patients was small. There is a possibility that the expected error in the measurement is higher than the expected shortening of telomere length over two years. To reduce measurement errors, independent researchers analyzed all telomere lengths twice. In addition, to minimize the effect of measurement error and overcome the fact that LTL did not follow a normal distribution, we dichotomized the participants according to the shortening of LTL. It is encouraging that sleep duration, latency, and efficacy showed statistically significant associations with changes in LTL over just two years. Third, participants were of a single ethnicity (Korean) with old age and a high proportion (39.9%) of cognitive impairments. Therefore, caution should be taken when extrapolating the results of the current study to the general population.
In conclusion, poor sleep quality measured by the PSQI score, specifically, long sleep latency, short sleep duration (<5 hours), and low sleep efficiency (<65%), are associated with accelerated shortening of LTL. These results suggest that sleep latency, sleep duration, and sleep efficiency may be added as the modifiable risk factors associated with cellular aging. Further longitudinal studies with longer follow-up durations and measurements of objective markers may clarify these results. If these associations are further demonstrated, such interventions (i.e., sleep hygiene interventions and medical treatments) to improve sleep quality might attenuate the shortening of telomere length.
Supplementary Materials
Author Contributions
Jin JH, Kwon HS, Choi SH, and Koh.SH made substantial contributions to the conception and design of the work. Jin JH, and Kwon HS drafted the manuscript. Choi SH, and Koh SH revised the manuscript. All authors made substantial contributions to acquisition, analysis, or interpretation of data. Kwon HS made substantial contributions to statistical analysis. Jin JH, Lee EH, Park HH, and Ha J made substantial contributions to administrative, technical, or material support. Jeong JH, Jang JW, Park KW, Kim EJ, Kim HJ, Hong JY, Yoon SJ, Yoon B, Park JE, and Han MH supervised the study. All authors give final approval of the version published.
Acknowledgments
We thank Jiyeong Kim PhD, in the Biostatistical Consulting and Research Lab, Medical Research Collaborating Center, Industry-University Cooperation Foundation, Hanyang University for statistical advice.
Conflicts of Interest
The authors declare no conflicts of interest related to this study.
Funding
This research was supported by a grant from the Korea Health Technology R&D Project through the Korea Health Industry Development Institute, funded by the Ministry of Health and Welfare, Republic of Korea (grant number: HI20C0253, HU21C0007, HU21C0016, and HU21C0113), the Medical Research Center (2017R1A5A2015395), the research fund of Hanyang University (HY-202200000000845) and a grant from the Brain Convergence Research Program of the National Research Foundation, funded by the Ministry of Science and ICT, Republic of Korea (NRF-2020M3E5D2A01084721 and 2018M3A9F1023697).
References
- 1. Blackburn EH, Epel ES, Lin J. Human telomere biology: A contributory and interactive factor in aging, disease risks, and protection. Science. 2015; 350:1193–8. https://doi.org/10.1126/science.aab3389 [PubMed]
- 2. Aubert G, Lansdorp PM. Telomeres and aging. Physiol Rev. 2008; 88:557–79. https://doi.org/10.1152/physrev.00026.2007 [PubMed]
- 3. Aviv A. Genetics of leukocyte telomere length and its role in atherosclerosis. Mutat Res. 2012; 730:68–74. https://doi.org/10.1016/j.mrfmmm.2011.05.001 [PubMed]
- 4. Starkweather AR, Alhaeeri AA, Montpetit A, Brumelle J, Filler K, Montpetit M, Mohanraj L, Lyon DE, Jackson-Cook CK. An integrative review of factors associated with telomere length and implications for biobehavioral research. Nurs Res. 2014; 63:36–50. https://doi.org/10.1097/NNR.0000000000000009 [PubMed]
- 5. Wynchank D, Bijlenga D, Penninx BW, Lamers F, Beekman AT, Kooij JJS, Verhoeven JE. Delayed sleep-onset and biological age: late sleep-onset is associated with shorter telomere length. Sleep. 2019; 42:zsz139. https://doi.org/10.1093/sleep/zsz139 [PubMed]
- 6. Wang H, Kim H, Baik I. Associations of alcohol consumption and alcohol flush reaction with leukocyte telomere length in Korean adults. Nutr Res Pract. 2017; 11:334–9. https://doi.org/10.4162/nrp.2017.11.4.334 [PubMed]
- 7. Barceló A, Piérola J, López-Escribano H, de la Peña M, Soriano JB, Alonso-Fernández A, Ladaria A, Agustí A. Telomere shortening in sleep apnea syndrome. Respir Med. 2010; 104:1225–9. https://doi.org/10.1016/j.rmed.2010.03.025 [PubMed]
- 8. Révész D, Milaneschi Y, Terpstra EM, Penninx BW. Baseline biopsychosocial determinants of telomere length and 6-year attrition rate. Psychoneuroendocrinology. 2016; 67:153–62. https://doi.org/10.1016/j.psyneuen.2016.02.007 [PubMed]
- 9. Unryn BM, Cook LS, Riabowol KT. Paternal age is positively linked to telomere length of children. Aging Cell. 2005; 4:97–101. https://doi.org/10.1111/j.1474-9728.2005.00144.x [PubMed]
- 10. Miner B, Kryger MH. Sleep in the Aging Population. Sleep Med Clin. 2017; 12:31–8. https://doi.org/10.1016/j.jsmc.2016.10.008 [PubMed]
- 11. Cribbet MR, Carlisle M, Cawthon RM, Uchino BN, Williams PG, Smith TW, Gunn HE, Light KC. Cellular aging and restorative processes: subjective sleep quality and duration moderate the association between age and telomere length in a sample of middle-aged and older adults. Sleep. 2014; 37:65–70. https://doi.org/10.5665/sleep.3308 [PubMed]
- 12. Yin J, Jin X, Shan Z, Li S, Huang H, Li P, Peng X, Peng Z, Yu K, Bao W, Yang W, Chen X, Liu L. Relationship of Sleep Duration With All-Cause Mortality and Cardiovascular Events: A Systematic Review and Dose-Response Meta-Analysis of Prospective Cohort Studies. J Am Heart Assoc. 2017; 6:e005947. https://doi.org/10.1161/JAHA.117.005947 [PubMed]
- 13. Jackowska M, Hamer M, Carvalho LA, Erusalimsky JD, Butcher L, Steptoe A. Short sleep duration is associated with shorter telomere length in healthy men: findings from the Whitehall II cohort study. PLoS One. 2012; 7:e47292. https://doi.org/10.1371/journal.pone.0047292 [PubMed]
- 14. Carroll JE, Esquivel S, Goldberg A, Seeman TE, Effros RB, Dock J, Olmstead R, Breen EC, Irwin MR. Insomnia and Telomere Length in Older Adults. Sleep. 2016; 39:559–64. https://doi.org/10.5665/sleep.5526 [PubMed]
- 15. Vgontzas AN, Zoumakis M, Bixler EO, Lin HM, Prolo P, Vela-Bueno A, Kales A, Chrousos GP. Impaired nighttime sleep in healthy old versus young adults is associated with elevated plasma interleukin-6 and cortisol levels: physiologic and therapeutic implications. J Clin Endocrinol Metab. 2003; 88:2087–95. https://doi.org/10.1210/jc.2002-021176 [PubMed]
- 16. Meerlo P, Sgoifo A, Suchecki D. Restricted and disrupted sleep: effects on autonomic function, neuroendocrine stress systems and stress responsivity. Sleep Med Rev. 2008; 12:197–210. https://doi.org/10.1016/j.smrv.2007.07.007 [PubMed]
- 17. James S, McLanahan S, Brooks-Gunn J, Mitchell C, Schneper L, Wagner B, Notterman DA. Sleep Duration and Telomere Length in Children. J Pediatr. 2017; 187:247–52.e1. https://doi.org/10.1016/j.jpeds.2017.05.014 [PubMed]
- 18. Irwin MR, Wang M, Campomayor CO, Collado-Hidalgo A, Cole S. Sleep deprivation and activation of morning levels of cellular and genomic markers of inflammation. Arch Intern Med. 2006; 166:1756–62. https://doi.org/10.1001/archinte.166.16.1756 [PubMed]
- 19. Hwang J, Jeong JH, Yoon SJ, Park KW, Kim EJ, Yoon B, Jang JW, Kim HJ, Hong JY, Lee JM, Park H, Kang JH, Choi YH, et al. Clinical and Biomarker Characteristics According to Clinical Spectrum of Alzheimer's Disease (AD) in the Validation Cohort of Korean Brain Aging Study for the Early Diagnosis and Prediction of AD. J Clin Med. 2019; 8:341. https://doi.org/10.3390/jcm8030341 [PubMed]
- 20. Lee DY, Lee KU, Lee JH, Kim KW, Jhoo JH, Kim SY, Yoon JC, Woo SI, Ha J, Woo JI. A normative study of the CERAD neuropsychological assessment battery in the Korean elderly. J Int Neuropsychol Soc. 2004; 10:72–81. https://doi.org/10.1017/S1355617704101094 [PubMed]
- 21. Bae JN, Cho MJ. Development of the Korean version of the Geriatric Depression Scale and its short form among elderly psychiatric patients. J Psychosom Res. 2004; 57:297–305. https://doi.org/10.1016/j.jpsychores.2004.01.004 [PubMed]
- 22. Blessed G, Tomlinson BE, Roth M. The association between quantitative measures of dementia and of senile change in the cerebral grey matter of elderly subjects. Br J Psychiatry. 1968; 114:797–811. https://doi.org/10.1192/bjp.114.512.797 [PubMed]
- 23. Choi SH, Lee BH, Kim S, Hahm DS, Jeong JH, Yoon SJ, Jeong Y, Ha CK, Nab DL. Interchanging scores between clinical dementia rating scale and global deterioration scale. Alzheimer Dis Assoc Disord. 2003; 17:98–105. https://doi.org/10.1097/00002093-200304000-00008 [PubMed]
- 24. 1999 World Health Organization-International Society of Hypertension Guidelines for the Management of Hypertension. Guidelines Subcommittee. J Hypertens. 1999; 17:151–83. [PubMed]
- 25. Report of the Expert Committee on the Diagnosis and Classification of Diabetes Mellitus. Diabetes Care. 1997; 20:1183–97. https://doi.org/10.2337/diacare.20.7.1183 [PubMed]
- 26. National Cholesterol Education Program (NCEP) Expert Panel on Detection, Evaluation, and Treatment of High Blood Cholesterol in Adults (Adult Treatment Panel III). Third Report of the National Cholesterol Education Program (NCEP) Expert Panel on Detection, Evaluation, and Treatment of High Blood Cholesterol in Adults (Adult Treatment Panel III) final report. Circulation. 2002; 106:3143–421. https://doi.org/10.1161/circ.106.25.3143 [PubMed]
- 27. Buysse DJ, Reynolds CF
3rd , Monk TH, Berman SR, Kupfer DJ. The Pittsburgh Sleep Quality Index: a new instrument for psychiatric practice and research. Psychiatry Res. 1989; 28:193–213. https://doi.org/10.1016/0165-1781(89)90047-4 [PubMed] - 28. Ogilvie RP, Lakshminarayan K, Iber C, Patel SR, Lutsey PL. Joint effects of OSA and self-reported sleepiness on incident CHD and stroke. Sleep Med. 2018; 44:32–7. https://doi.org/10.1016/j.sleep.2018.01.004 [PubMed]
- 29. Hoddes E, Zarcone V, Smythe H, Phillips R, Dement WC. Quantification of sleepiness: a new approach. Psychophysiology. 1973; 10:431–6. https://doi.org/10.1111/j.1469-8986.1973.tb00801.x [PubMed]
- 30. Beckett LA, Donohue MC, Wang C, Aisen P, Harvey DJ, Saito N, and Alzheimer's Disease Neuroimaging Initiative. The Alzheimer's Disease Neuroimaging Initiative phase 2: Increasing the length, breadth, and depth of our understanding. Alzheimers Dement. 2015; 11:823–31. https://doi.org/10.1016/j.jalz.2015.05.004 [PubMed]
- 31. Zijdenbos AP, Forghani R, Evans AC. Automatic "pipeline" analysis of 3-D MRI data for clinical trials: application to multiple sclerosis. IEEE Trans Med Imaging. 2002; 21:1280–91. https://doi.org/10.1109/TMI.2002.806283 [PubMed]
- 32. Patenaude B, Smith SM, Kennedy DN, Jenkinson M. A Bayesian model of shape and appearance for subcortical brain segmentation. Neuroimage. 2011; 56:907–22. https://doi.org/10.1016/j.neuroimage.2011.02.046 [PubMed]
- 33. Jack CR
Jr , Bennett DA, Blennow K, Carrillo MC, Dunn B, Haeberlein SB, Holtzman DM, Jagust W, Jessen F, Karlawish J, Liu E, Molinuevo JL, Montine T, et al, and Contributors. NIA-AA Research Framework: Toward a biological definition of Alzheimer's disease. Alzheimers Dement. 2018; 14:535–62. https://doi.org/10.1016/j.jalz.2018.02.018 [PubMed] - 34. Koh SH, Choi SH, Jeong JH, Jang JW, Park KW, Kim EJ, Kim HJ, Hong JY, Yoon SJ, Yoon B, Kang JH, Lee JM, Park HH, et al. Telomere shortening reflecting physical aging is associated with cognitive decline and dementia conversion in mild cognitive impairment due to Alzheimer's disease. Aging (Albany NY). 2020; 12:4407–23. https://doi.org/10.18632/aging.102893 [PubMed]
- 35. Koo TK, Li MY. A Guideline of Selecting and Reporting Intraclass Correlation Coefficients for Reliability Research. J Chiropr Med. 2016; 15:155–63. https://doi.org/10.1016/j.jcm.2016.02.012 [PubMed]
- 36. Lee KA, Gay C, Humphreys J, Portillo CJ, Pullinger CR, Aouizerat BE. Telomere length is associated with sleep duration but not sleep quality in adults with human immunodeficiency virus. Sleep. 2014; 37:157–66. https://doi.org/10.5665/sleep.3328 [PubMed]
- 37. Prather AA, Puterman E, Lin J, O’Donovan A, Krauss J, Tomiyama AJ, Epel ES, Blackburn EH. Shorter leukocyte telomere length in midlife women with poor sleep quality. J Aging Res. 2011; 2011:721390. https://doi.org/10.4061/2011/721390 [PubMed]
- 38. Prather AA, Gurfein B, Moran P, Daubenmier J, Acree M, Bacchetti P, Sinclair E, Lin J, Blackburn E, Hecht FM, Epel ES. Tired telomeres: Poor global sleep quality, perceived stress, and telomere length in immune cell subsets in obese men and women. Brain Behav Immun. 2015; 47:155–62. https://doi.org/10.1016/j.bbi.2014.12.011 [PubMed]
- 39. Mullington JM, Haack M, Toth M, Serrador JM, Meier-Ewert HK. Cardiovascular, inflammatory, and metabolic consequences of sleep deprivation. Prog Cardiovasc Dis. 2009; 51:294–302. https://doi.org/10.1016/j.pcad.2008.10.003 [PubMed]
- 40. Prather AA, Marsland AL, Hall M, Neumann SA, Muldoon MF, Manuck SB. Normative variation in self-reported sleep quality and sleep debt is associated with stimulated pro-inflammatory cytokine production. Biol Psychol. 2009; 82:12–7. https://doi.org/10.1016/j.biopsycho.2009.04.008 [PubMed]
- 41. Yeh JK, Wang CY. Telomeres and Telomerase in Cardiovascular Diseases. Genes (Basel). 2016; 7:58. https://doi.org/10.3390/genes7090058 [PubMed]
- 42. Boyer L, Audureau E, Margarit L, Marcos E, Bizard E, Le Corvoisier P, Macquin-Mavier I, Derumeaux G, Damy T, Drouot X, Covali-Noroc A, Boczkowski J, Bastuji-Garin S, Adnot S. Telomere Shortening in Middle-Aged Men with Sleep-disordered Breathing. Ann Am Thorac Soc. 2016; 13:1136–43. https://doi.org/10.1513/AnnalsATS.201510-718OC [PubMed]
- 43. Zhang J, Ma RC, Kong AP, So WY, Li AM, Lam SP, Li SX, Yu MW, Ho CS, Chan MH, Zhang B, Wing YK. Relationship of sleep quantity and quality with 24-hour urinary catecholamines and salivary awakening cortisol in healthy middle-aged adults. Sleep. 2011; 34:225–33. https://doi.org/10.1093/sleep/34.2.225 [PubMed]
- 44. Kumari M, Badrick E, Ferrie J, Perski A, Marmot M, Chandola T. Self-reported sleep duration and sleep disturbance are independently associated with cortisol secretion in the Whitehall II study. J Clin Endocrinol Metab. 2009; 94:4801–9. https://doi.org/10.1210/jc.2009-0555 [PubMed]
- 45. Epel ES, Blackburn EH, Lin J, Dhabhar FS, Adler NE, Morrow JD, Cawthon RM. Accelerated telomere shortening in response to life stress. Proc Natl Acad Sci U S A. 2004; 101:17312–5. https://doi.org/10.1073/pnas.0407162101 [PubMed]
- 46. Lauderdale DS, Knutson KL, Yan LL, Liu K, Rathouz PJ. Self-reported and measured sleep duration: how similar are they? Epidemiology. 2008; 19:838–45. https://doi.org/10.1097/EDE.0b013e318187a7b0 [PubMed]