


Introduction
Coronavirus disease 2019 (COVID-19) remains one of the main threats to public health worldwide. Owing to the clinical variability of the COVID-19 disease course, it is important to search for predictors that reliably predict the severity of this disease. The pandemic experience has shown that the greatest risks of COVID-19 severe course and unfavorable outcomes of the disease are age and aging-associated diseases; compared to the 50–60-year age group, the risk of death is 23 times higher for individuals aged > 65 years and 100 times higher for those aged > 85 years. The possible causes of aging-related disparities among severe cases of COVID-19 infection have been widely discussed in the scientific literature [1]. In addition to the most obvious explanation, which is the pronounced comorbidity among elderly patients, a hypothesis regarding the influence of immunosenescence has been proposed [2, 3]. Zhavoronkov et al. posited that aging-associated immunosenescence reduces the ability to protect humans against infection and infection causes biological damage to the body, leading to a loss of homeostasis. These factors lead to the acceleration of the aging processes and the worsening of aging-related diseases. Another significant factor in the high mortality from COVID-19 among the elderly population is the accumulation of functional deficits that occur with increasing age and frailty. It has been shown that frailty syndrome is directly related to mortality [4]. In contrast, it is well known that the rate of aging differs significantly among humans. These differences are vividly represented in both persons with early signs of aging and nonagenarians and centenarians who maintain a good physique for a long time. Thus, there is a need to develop a tool for assessing the clinical and physiological states of a person for a more accurate individual prognosis of the course of COVID-19 infection, which could become a scientific basis for making timely and effective clinical decisions. It is especially important to find and validate those predictors of a severe disease course that could predict the outcome of the disease more effectively than the chronological age.
According to existing data, various calculations for assessing physiological state and biological age can be considered promising predictors of the severity of the course of COVID-19 [5], including measures of the biological age, such as the PhenoAge (PA) and Klemera-Doubal method (KD), integrated albunemia, and physiological dysregulation. In a study by Kuo et al. based on data from the UK Biobank, accelerated aging calculated using the PA 10–14 years before the onset of the COVID-19 pandemic was associated with all-cause mortality in patients with COVID-19 [6]. Differences in the methods used to calculate the physiological states may influence their predictive power. Therefore, to determine the most informative method for assessing physiological state or biological age in relation to the prognosis of COVID-19, it is necessary to conduct comparative studies. In this study, we aimed to assess whether different multivariate metrics of physiological state could predict the outcomes of COVID-19 better than the chronological age.
Materials and Methods
This study included men and women aged ≥ 18 years who were hospitalized in the infectious diseases department of the Hospital for War Veterans No. 3 of Moscow Health Department and diagnosed with COVID-19 by PCR testing. Diagnostics and therapy for COVID-19 were performed in accordance with the guidelines of the Ministry of Health of Russia (“Prevention, diagnosis, and treatment of a new coronavirus infection (COVID-19)), version 5 from August 4, 2020; version 6 from April 28, 2020; and version 7 from March 6, 2020. This study was approved by the Local Ethics Committee of the First Moscow State University, named after I. M. Sechenov (Sechenov University), protocol #19-20 (dated July 2, 2020), and conducted according to the guidelines of the Declaration of Helsinki.
The main purpose of this study was to measure the strength of association between the different types of physical states or biological age and the following outcomes: death, deterioration (transition to a more severe degree according to clinical guidelines), or a combination of these two. Multivariate logistic regression was applied to model the odds ratio (OR) of the outcome using sex, chronological age, and physical state or biological age (with calculators described below) as the predictors. All statistical analyses were performed using Stata version 14 software and R language. A two-sided significance level of 0.05 was used.
Different indices were used to assess the individual physiological states. The biomarkers used are listed in Table 1. First, integrated albumin (IA), a physiological emergent process notably related to inflammation [7], was calculated using the calculator provided by Cohen and the following 14 biomarkers: hemoglobin, hematocrit, MCH, mean corpuscular hemoglobin concentration (MCHC), RBC, RDW, platelets, iron, albumin to globulin ratio, calcium, CRP, alkaline phosphatase, and ALT. Second, the biological age was measured using the KD [5, 8], with eight biomarkers selected based on their availability in the dataset, their independence, and their correlation with the chronological age (r > |0.10|), as suggested by Levine et al. [5]: CRP, albumin, total cholesterol, blood urea nitrogen, RDW, platelets, RBC, and lymphocyte percentage. Third, PA was calculated as described by Levine et al. [9] using the albumin, creatinine, serum glucose, CRP, lymphocyte percentage, mean corpuscular volume (MCV), RDW, alkaline phosphatase, WBC, and chronological age. Finally, we calculated the physiological dysregulation (PD) using the MD, as described elsewhere [10–13]. We selected biomarkers based on their stability in three other cohorts and calculated the PD globally and within two physiological systems:
The global PD included 14 biomarkers: MCH, RDW, RBC, platelets, percentage of lymphocytes, WBC, CRP, potassium, sodium, hemoglobin, albumin, ALT, AST, and total protein.
The PD in the oxygen transport system included the MCHC, MCV, RDW, RBC, and hemoglobin.
The PD in the leukopoiesis system included the percentage of neutrophils, WBC, and percentage of lymphocytes.
Table 1. Biomarkers, their mean and standard deviation, measure(s) using the biomarker, and log transformation of biomarkers.
| Biomarker | Mean ± SD | Measure(s) | Log-transformation for normality | ||||||||||||||||||||||||||||||||||||||||||||||||||||||||||||||||||||||||||||||||||||||||||||||||
| Alanine transaminase (ALT, U/L) | 49 ± 62 | IA, PD (g) | X | ||||||||||||||||||||||||||||||||||||||||||||||||||||||||||||||||||||||||||||||||||||||||||||||||
| Albumin (g/L) | 33.8 ± 5.4 | IA, KD, PA, PD (g) | |||||||||||||||||||||||||||||||||||||||||||||||||||||||||||||||||||||||||||||||||||||||||||||||||
| Albumin-globulin ratio | 1.16 ± 0.30 | IA | |||||||||||||||||||||||||||||||||||||||||||||||||||||||||||||||||||||||||||||||||||||||||||||||||
| Alkaline phosphatase (U/L) | 223 ± 159 | IA, PA | X (IA) | ||||||||||||||||||||||||||||||||||||||||||||||||||||||||||||||||||||||||||||||||||||||||||||||||
| Aspartate transaminase (AST, U/L) | 67 ± 80 | PD (g) | X | ||||||||||||||||||||||||||||||||||||||||||||||||||||||||||||||||||||||||||||||||||||||||||||||||
| Blood urea nitrogen (BUN) (mmol/L) | 8.0 ± 6.0 | KD | X | ||||||||||||||||||||||||||||||||||||||||||||||||||||||||||||||||||||||||||||||||||||||||||||||||
| Calcium (mmol/L) | 0.90 ± 0.40 | IA | |||||||||||||||||||||||||||||||||||||||||||||||||||||||||||||||||||||||||||||||||||||||||||||||||
| Chronological age (years) | 64 ± 15 | KD, PA | |||||||||||||||||||||||||||||||||||||||||||||||||||||||||||||||||||||||||||||||||||||||||||||||||
| C-reactive protein (CRP) | 117 ± 89 | IA, KD, PA, PD (g) | X | ||||||||||||||||||||||||||||||||||||||||||||||||||||||||||||||||||||||||||||||||||||||||||||||||
| Glucose (mmol/L) | 8.0 ± 3.6 | PA | |||||||||||||||||||||||||||||||||||||||||||||||||||||||||||||||||||||||||||||||||||||||||||||||||
| Hematocrit (%) | 38.71 ± 5.89 | IA | |||||||||||||||||||||||||||||||||||||||||||||||||||||||||||||||||||||||||||||||||||||||||||||||||
| Hemoglobin (g/L) | 129 ± 18 | IA, PD (g,o) | |||||||||||||||||||||||||||||||||||||||||||||||||||||||||||||||||||||||||||||||||||||||||||||||||
| Iron (μmol/L) | 8.5 ± 5.7 | IA | |||||||||||||||||||||||||||||||||||||||||||||||||||||||||||||||||||||||||||||||||||||||||||||||||
| Lymphocytes (%) | 21 ± 15 | KD, PA, PD (g,l) | |||||||||||||||||||||||||||||||||||||||||||||||||||||||||||||||||||||||||||||||||||||||||||||||||
| Mean corpuscular hemoglobin (MCH) (pg) | 30.1 ± 2.6 | IA, PD (g) | |||||||||||||||||||||||||||||||||||||||||||||||||||||||||||||||||||||||||||||||||||||||||||||||||
| Mean corpuscular hemoglobin concentration (MCHC) (g/dL) | 33 ± 1 | IA, PD (o) | |||||||||||||||||||||||||||||||||||||||||||||||||||||||||||||||||||||||||||||||||||||||||||||||||
| Mean corpuscular volume (MCV) (fL) | 90.5 ± 6.8 | PA, PD (o) | |||||||||||||||||||||||||||||||||||||||||||||||||||||||||||||||||||||||||||||||||||||||||||||||||
| Neutrophils (%) | 72 ± 15 | PD (l) | |||||||||||||||||||||||||||||||||||||||||||||||||||||||||||||||||||||||||||||||||||||||||||||||||
| Platelets (109/L) | 198 ± 80 | IA, KD, PD (g) | X (KD, PD) | ||||||||||||||||||||||||||||||||||||||||||||||||||||||||||||||||||||||||||||||||||||||||||||||||
| Potassium (mmol/L) | 3.9 ± 0.8 | PD (g) | |||||||||||||||||||||||||||||||||||||||||||||||||||||||||||||||||||||||||||||||||||||||||||||||||
| Red blood cell count (RBC, 106/μL) | 4.32 ± 0.55 | IA, KD, PD (g,o) | |||||||||||||||||||||||||||||||||||||||||||||||||||||||||||||||||||||||||||||||||||||||||||||||||
| Red cell distribution width (RDW) (%) | 14.2 ± 3.4 | IA, KD, PA, PD (g,o) | X (IA, KD and PD) | ||||||||||||||||||||||||||||||||||||||||||||||||||||||||||||||||||||||||||||||||||||||||||||||||
| Serum creatinine (mg/dL) | 1.37 ± 0.96 | PA | |||||||||||||||||||||||||||||||||||||||||||||||||||||||||||||||||||||||||||||||||||||||||||||||||
| Sodium (mmol/L) | 139 ± 5 | PD (g) | |||||||||||||||||||||||||||||||||||||||||||||||||||||||||||||||||||||||||||||||||||||||||||||||||
| Total cholesterol (mmol/L) | 4.2 ± 1.2 | KD | |||||||||||||||||||||||||||||||||||||||||||||||||||||||||||||||||||||||||||||||||||||||||||||||||
| Total protein (g/L) | 64.0 ± 6.5 | PD (g) | |||||||||||||||||||||||||||||||||||||||||||||||||||||||||||||||||||||||||||||||||||||||||||||||||
| White blood cell count (WBC) (109/L) | 7.8 ± 4.4 | PA, PD (g,l) | X (PD) | ||||||||||||||||||||||||||||||||||||||||||||||||||||||||||||||||||||||||||||||||||||||||||||||||
| Legend: | |||||||||||||||||||||||||||||||||||||||||||||||||||||||||||||||||||||||||||||||||||||||||||||||||||
| IA, integrated albunemia; KD, Klemera and Doubal biological age; PA, PhenoAge; PD, physiological dysregulation. | |||||||||||||||||||||||||||||||||||||||||||||||||||||||||||||||||||||||||||||||||||||||||||||||||||
| KD, Klemera and Doubal biological age; PA, PhenoAge; PD, physiological dysregulation. | |||||||||||||||||||||||||||||||||||||||||||||||||||||||||||||||||||||||||||||||||||||||||||||||||||
| g: biomarker part of the final 14 biomarkers set used for global physiological dysregulation. | |||||||||||||||||||||||||||||||||||||||||||||||||||||||||||||||||||||||||||||||||||||||||||||||||||
| l: biomarker used for physiological dysregulation in the leukopoiesis system. | |||||||||||||||||||||||||||||||||||||||||||||||||||||||||||||||||||||||||||||||||||||||||||||||||||
| o: biomarker used for physiological dysregulation in the oxygen transport system. | |||||||||||||||||||||||||||||||||||||||||||||||||||||||||||||||||||||||||||||||||||||||||||||||||||
| Note: units presented in this table are not necessarily the units in which biomarkers were used in the calculations; the units were adapted to measures (for example, depending on the existing formula, the reference population, etc.). | |||||||||||||||||||||||||||||||||||||||||||||||||||||||||||||||||||||||||||||||||||||||||||||||||||
Due to the small sample size in our study, we used the National Health and Nutrition Examination Survey as a reference population to scale biomarkers and calculate the variance-covariance matrix [12]. The use of an external reference population was cross-validated with that of an Asian population to assess PD stability across races. As PD generally has a log-normal distribution, we used the standardized logarithm of PD (log(PD)/sd(log(PD))). Missing values for iron (67.1%), alkaline phosphatase (59.4%), calcium (2.6%), and alanine aminotransferase (0.65%) were imputed using the mouse function in R (mice package) for the IA and PA calculations. The biomarkers were log-transformed, if needed, to meet the assumptions of normality before the calculation of all measures was performed.
Results
A total of 155 participants aged between 26 and 94 years from Moscow and hospitalized in the infectious disease department were recruited for this study. All patients were diagnosed with COVID-19 by polymerase chain reaction (PCR) testing and underwent treatment for confirmed COVID-19 from April 14, 2020, to June 10, 2020. Among the included participants, 47% were women (n = 73) and 53% were men (n = 82). The average age of the participants was 64 years. The average biological age calculated using the PA calculator was 75.3 years and that calculated using the KD calculator was 64 years. The other characteristics and more detailed descriptions are presented in Table 2. All other information about the cohort and measured parameters are presented in the Supplementary Data (Supplementary Tables 1–4 and Supplementary Figure 1).
Table 2. Descriptive statistics of physiological state, chronological and biological age according to various calculators.
| Parameter | Age, years | IA, u. | KD, years | PA, years | PD (g), u. | PD (o), u. | PD (l), u. | ||||||||||||||||||||||||||||||||||||||||||||||||||||||||||||||||||||||||||||||||||||||||||||
| Cohort size, N | 155 | 155 | 155 | 146 | 154 | 155 | 155 | ||||||||||||||||||||||||||||||||||||||||||||||||||||||||||||||||||||||||||||||||||||||||||||
| Mean | 64.02 | 4.54 | 64.02 | 75.30 | 6.08 | 1.33 | 1.83 | ||||||||||||||||||||||||||||||||||||||||||||||||||||||||||||||||||||||||||||||||||||||||||||
| SD | 15.24 | 2,47 | 17.31 | 22.75 | 1.00 | 1.00 | 1.00 | ||||||||||||||||||||||||||||||||||||||||||||||||||||||||||||||||||||||||||||||||||||||||||||
| 95% CI | (61.6; 66.44) | (4.15; 4.93) | (61.27; 66.77) | (71.58; 79.03) | (5.92; 6.24) | (1.17; 1.48) | (1.68; 1.99) | ||||||||||||||||||||||||||||||||||||||||||||||||||||||||||||||||||||||||||||||||||||||||||||
| Min | 26 | -2.8 | 16.1 | 24.0 | 2.9 | -1.1 | -2.3 | ||||||||||||||||||||||||||||||||||||||||||||||||||||||||||||||||||||||||||||||||||||||||||||
| Max | 94 | 15.5 | 110.3 | 123.6 | 9.6 | 4.8 | 5.0 | ||||||||||||||||||||||||||||||||||||||||||||||||||||||||||||||||||||||||||||||||||||||||||||
| Median | 64 | 4.4 | 63.0 | 76.2 | 6.1 | 1.2 | 1.9 | ||||||||||||||||||||||||||||||||||||||||||||||||||||||||||||||||||||||||||||||||||||||||||||
| Q1 | 53 | 2.9 | 51.9 | 57.5 | 5.3 | 0.7 | 1.2 | ||||||||||||||||||||||||||||||||||||||||||||||||||||||||||||||||||||||||||||||||||||||||||||
| Q3 | 75 | 5.8 | 74.3 | 90.0 | 6.6 | 1.8 | 2.3 | ||||||||||||||||||||||||||||||||||||||||||||||||||||||||||||||||||||||||||||||||||||||||||||
| Legend: | |||||||||||||||||||||||||||||||||||||||||||||||||||||||||||||||||||||||||||||||||||||||||||||||||||
| IA, integrated albumin; KD, Klemera and Doubal biological age; PA, PhenoAge; PD, physiological dysregulation; U, units. | |||||||||||||||||||||||||||||||||||||||||||||||||||||||||||||||||||||||||||||||||||||||||||||||||||
| KD, Klemera and Doubal biological age; PA, PhenoAge; PD, physiological dysregulation. | |||||||||||||||||||||||||||||||||||||||||||||||||||||||||||||||||||||||||||||||||||||||||||||||||||
| g: biomarker part of the final 14 biomarkers set used for global physiological dysregulation. | |||||||||||||||||||||||||||||||||||||||||||||||||||||||||||||||||||||||||||||||||||||||||||||||||||
| l: biomarker used for physiological dysregulation in the leukopoiesis system. | |||||||||||||||||||||||||||||||||||||||||||||||||||||||||||||||||||||||||||||||||||||||||||||||||||
| o: biomarker used for physiological dysregulation in the oxygen transport system. | |||||||||||||||||||||||||||||||||||||||||||||||||||||||||||||||||||||||||||||||||||||||||||||||||||
First, we performed a three-factor logistic regression analysis with age and sex adjustments to evaluate the association between each cell blood count or biochemical parameters and COVID-19 outcomes (Figures 1, 2).
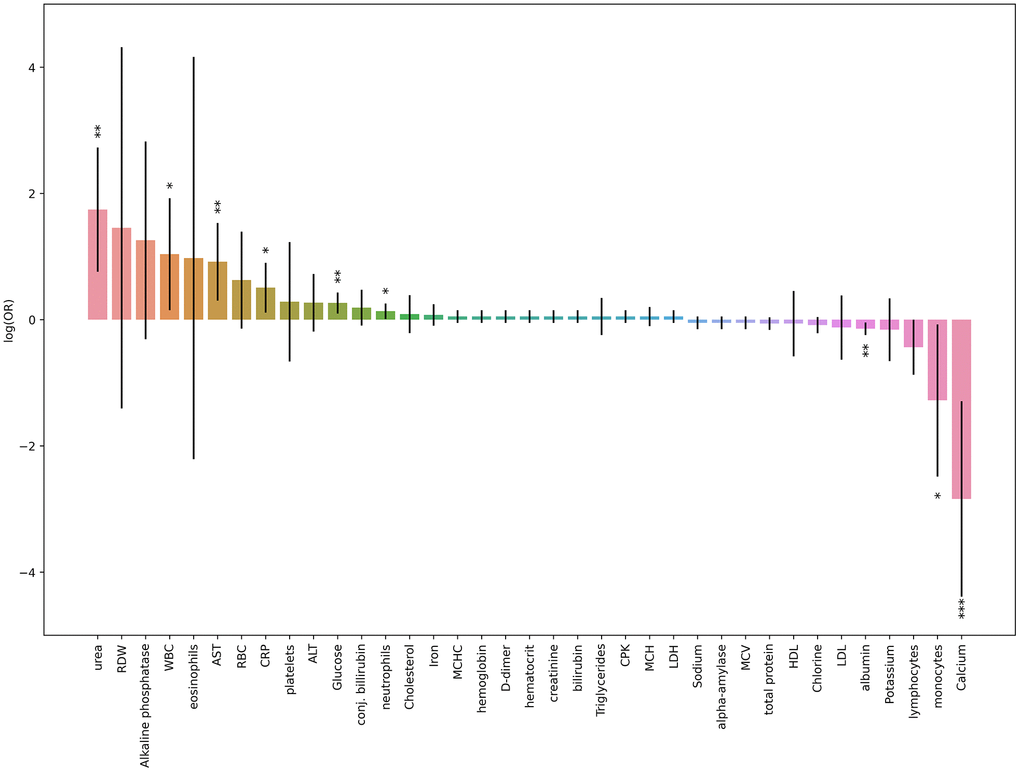
Figure 1. Results obtained from three-factor logistic regression models for blood tests results parameters and death risk. Height of each bar depicts log(OR) obtained from logistic regression model (age and sex was taken as covariates), black lines depicts 95% CI for each result. * p-value < 0.05, ** p-value < 0.01, *** p-value < 0.001 (the last one is suitable for Bonferroni adjustment).
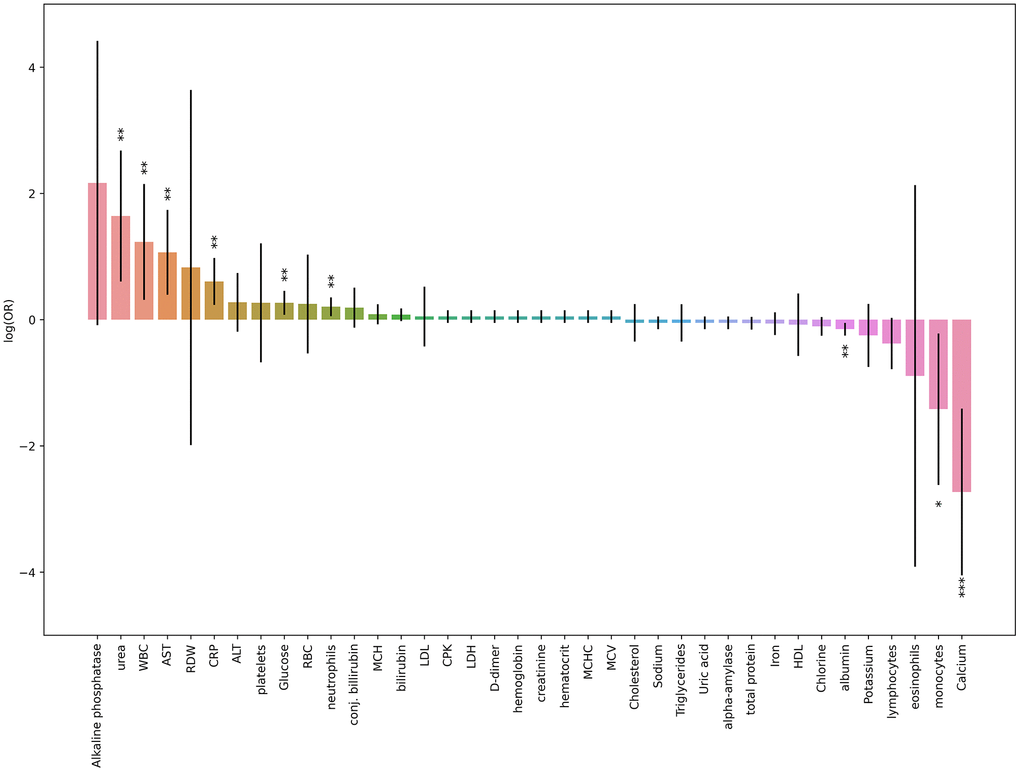
Figure 2. Results obtained from three-factor logistic regression models for blood tests results parameters and deterioration risk. Height of each bar depicts log(OR) obtained from logistic regression model (age and sex was taken as covariates), black lines depicts 95% CI for each result. * p-value < 0.05, ** p-value < 0.01, *** p-value < 0.001 (the last one is suitable for Bonferroni adjustment).
The most significant association was revealed for calcium level. Low calcium levels were strongly correlated with death and deterioration in patients with COVID-19 (Figure 3). In contrast, the levels of inflammatory markers, urea, liver enzymes, and glucose were increased in the patients with high deterioration and death risks.
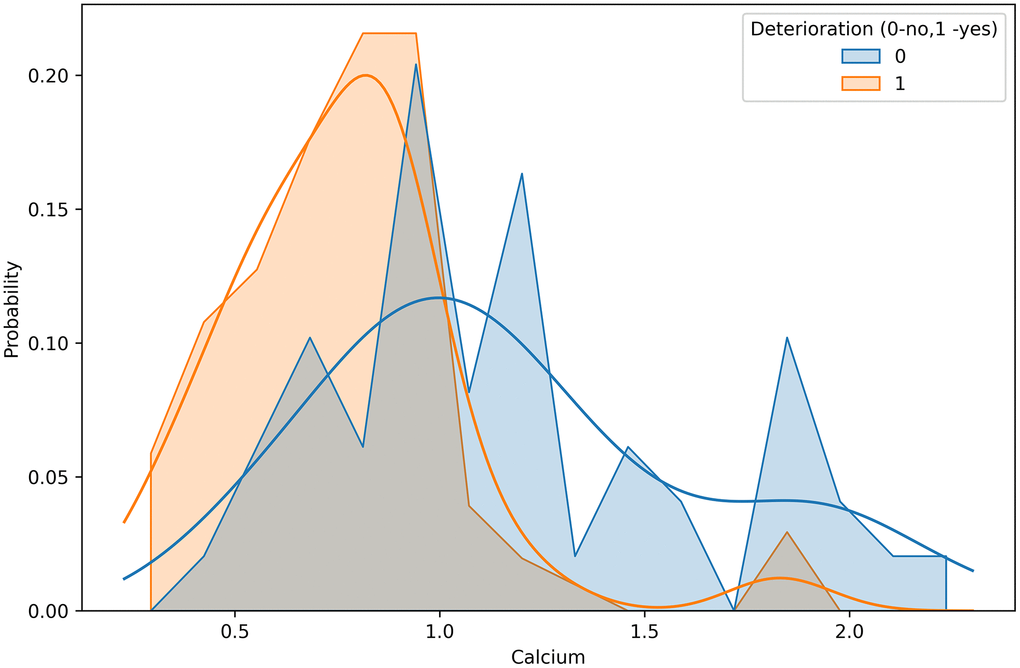
Figure 3. Calcium concentration distributions in groups differed by deterioration outcome.
Analyses using three-factor logistic regression models (Table 3) revealed a significant association between the risk of death and biological age/physiological state based on any of the calculators described above (p < 0.01) after adjusting for chronological age and sex. Thus, the odds of death increased by 68.3% per 0.5-unit increase in the global PD, by 28.5% per 0.5-unit increase in the oxygen transport-PD, by 61.9% per 0.5-unit increase in the leukopoiesis-PD, by 44.9% per 5-unit increase in the KD age, and by 62.3% per 5-unit increase in the PA. In all models, men were 2.4–4.4 times more likely to die than women. The chronological age was not a significant predictor in the KD or PA models (p = 0.429 and p = 0.608, respectively). Across all tests, the integrated albunemia was not associated with deterioration or death (p = 0.52 and p = 0.43, respectively). The dependence between the chronological age and selected metrics of the biological age or physiological state, split by death or recovery, is presented in Figure 4.
Table 3. Death OR obtained by multivariate logistic regression.
| Calculator | Factor | OR | p | 95% CI for OR | |||||||||||||||||||||||||||||||||||||||||||||||||||||||||||||||||||||||||||||||||||||||||||||||
| PD (g) for 0.5 units | 1.683 | <0.001 | 1.348 | 2.101 | |||||||||||||||||||||||||||||||||||||||||||||||||||||||||||||||||||||||||||||||||||||||||||||||
| Sex (female = ref) | 2.553 | 0.039 | 1.050 | 6.209 | |||||||||||||||||||||||||||||||||||||||||||||||||||||||||||||||||||||||||||||||||||||||||||||||
| Age, for 5 years | 1.604 | <0.001 | 1.328 | 1.937 | |||||||||||||||||||||||||||||||||||||||||||||||||||||||||||||||||||||||||||||||||||||||||||||||
| PD (o) | 1.285 | 0.007 | 1.069 | 1.544 | |||||||||||||||||||||||||||||||||||||||||||||||||||||||||||||||||||||||||||||||||||||||||||||||
| Sex (female = ref) | 2.885 | 0.014 | 1.237 | 6.731 | |||||||||||||||||||||||||||||||||||||||||||||||||||||||||||||||||||||||||||||||||||||||||||||||
| Age, for 5 years | 1.575 | <0.001 | 1.313 | 1.890 | |||||||||||||||||||||||||||||||||||||||||||||||||||||||||||||||||||||||||||||||||||||||||||||||
| PD (l), 0,5 units | 1.619 | <0.001 | 1.247 | 2.101 | |||||||||||||||||||||||||||||||||||||||||||||||||||||||||||||||||||||||||||||||||||||||||||||||
| Sex (female = ref) | 2.378 | 0.048 | 1.007 | 5.617 | |||||||||||||||||||||||||||||||||||||||||||||||||||||||||||||||||||||||||||||||||||||||||||||||
| Age, for 5 years | 1.571 | <0.001 | 1.307 | 1.887 | |||||||||||||||||||||||||||||||||||||||||||||||||||||||||||||||||||||||||||||||||||||||||||||||
| KD, 5 units | 1.449 | <0.001 | 1.177 | 1.783 | |||||||||||||||||||||||||||||||||||||||||||||||||||||||||||||||||||||||||||||||||||||||||||||||
| Sex (female = ref) | 4.370 | 0.065 | 0.915 | 20.870 | |||||||||||||||||||||||||||||||||||||||||||||||||||||||||||||||||||||||||||||||||||||||||||||||
| Age, for 5 years | 1.147 | 0.429 | 0.817 | 1.609 | |||||||||||||||||||||||||||||||||||||||||||||||||||||||||||||||||||||||||||||||||||||||||||||||
| PA, 5 units | 1.623 | <0.001 | 1.247 | 2.114 | |||||||||||||||||||||||||||||||||||||||||||||||||||||||||||||||||||||||||||||||||||||||||||||||
| Sex (female = ref) | 2.936 | 0.093 | 0.835 | 10.328 | |||||||||||||||||||||||||||||||||||||||||||||||||||||||||||||||||||||||||||||||||||||||||||||||
| Age, for 5 years | 1.079 | 0.608 | 0.808 | 1.440 | |||||||||||||||||||||||||||||||||||||||||||||||||||||||||||||||||||||||||||||||||||||||||||||||
| Legend: | |||||||||||||||||||||||||||||||||||||||||||||||||||||||||||||||||||||||||||||||||||||||||||||||||||
| KD, Klemera and Doubal biological age; PA, PhenoAge; PD, physiological dysregulation. | |||||||||||||||||||||||||||||||||||||||||||||||||||||||||||||||||||||||||||||||||||||||||||||||||||
| g: biomarker part of the final 14 biomarkers set used for global physiological dysregulation. | |||||||||||||||||||||||||||||||||||||||||||||||||||||||||||||||||||||||||||||||||||||||||||||||||||
| l: biomarker used for physiological dysregulation in the leukopoiesis system. | |||||||||||||||||||||||||||||||||||||||||||||||||||||||||||||||||||||||||||||||||||||||||||||||||||
| o: biomarker used for physiological dysregulation in the oxygen transport system. | |||||||||||||||||||||||||||||||||||||||||||||||||||||||||||||||||||||||||||||||||||||||||||||||||||
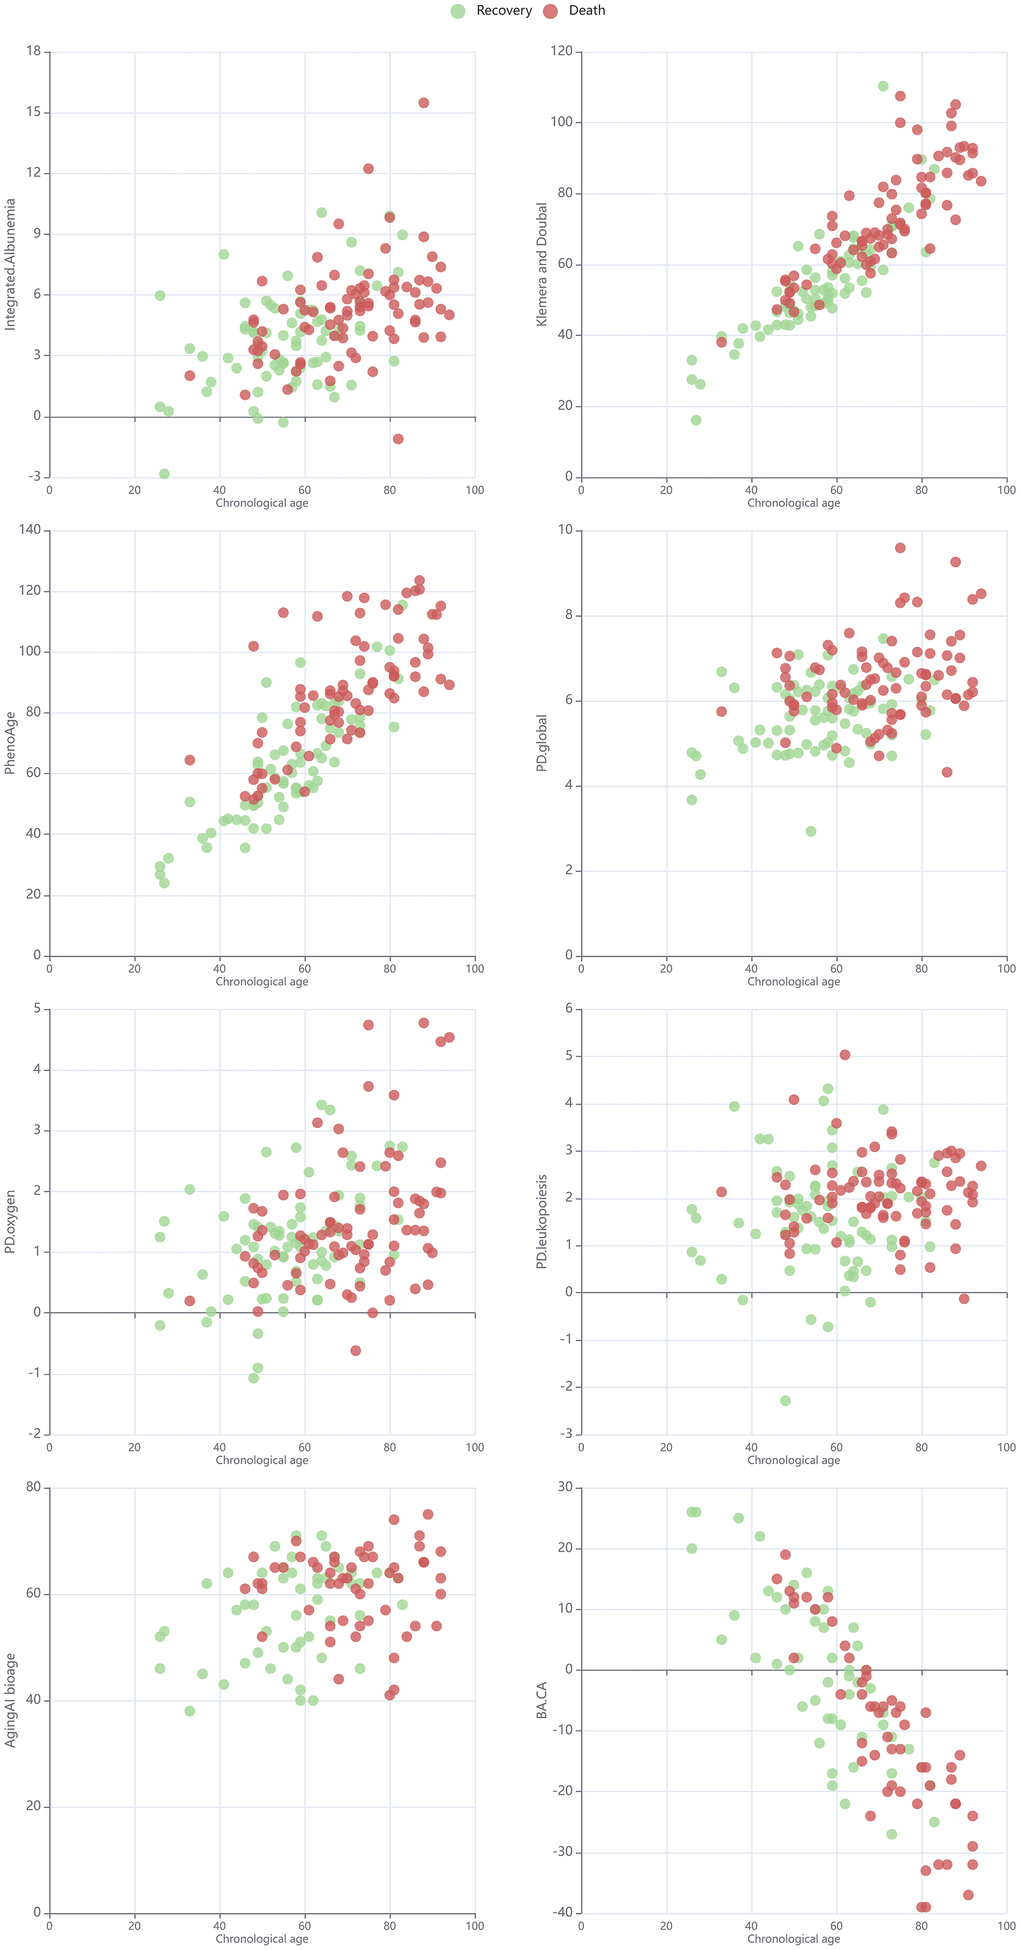
Figure 4. Scatter plot for chronological age and selected metrics of biological age or physiological state in cohorts split by death/recovery.
In contrast, the risk of deterioration had no significant association with PD in the oxygen transport system or PA, while the odds of deterioration increased by 41.7% per 0.5-unit increase in the global PD, by 32.9% per 0.5-unit increase in the PD in the leukopoiesis system, and by 20.4% per 5-unit increase in the KD age (Table 4). Except for the model with the PA, in which a significant association was found (p = 0.021), none of the other models showed any statistically significant effect of sex (p > 0.05). Similarly, a weakly significant association of chronological age with the odds of deterioration was revealed only for the model with KD as a predictor (p = 0.010), while, in all other models, chronological age was not statistically significant. The dependence between the chronological age and selected metrics of biological age or physiological state, split by deterioration, is presented in Figure 5.
Table 4. COVID-19 course deterioration OR obtained by multivariate logistic regression.
| Calculator | Factor | OR | p | 95%CI for OR | |||||||||||||||||||||||||||||||||||||||||||||||||||||||||||||||||||||||||||||||||||||||||||||||
| PD (g) for 0.5 units | 1.417 | <0.001 | 1.271 | 1.580 | |||||||||||||||||||||||||||||||||||||||||||||||||||||||||||||||||||||||||||||||||||||||||||||||
| Sex (female = ref) | 1.113 | 0.593 | 0.752 | 1647 | |||||||||||||||||||||||||||||||||||||||||||||||||||||||||||||||||||||||||||||||||||||||||||||||
| Age, for 5 years | 0.988 | 0.706 | 0.926 | 1.05 | |||||||||||||||||||||||||||||||||||||||||||||||||||||||||||||||||||||||||||||||||||||||||||||||
| PD (o) | 1.017 | 0.728 | 0.927 | 1.115 | |||||||||||||||||||||||||||||||||||||||||||||||||||||||||||||||||||||||||||||||||||||||||||||||
| Sex (female = ref) | 1.327 | 0.138 | 0.913 | 1.929 | |||||||||||||||||||||||||||||||||||||||||||||||||||||||||||||||||||||||||||||||||||||||||||||||
| Age, for 5 years | 1.031 | 0.324 | 0.970 | 1.097 | |||||||||||||||||||||||||||||||||||||||||||||||||||||||||||||||||||||||||||||||||||||||||||||||
| PD (l), 0,5 units | 1.329 | <0.001 | 1.194 | 1.480 | |||||||||||||||||||||||||||||||||||||||||||||||||||||||||||||||||||||||||||||||||||||||||||||||
| Sex (female = ref) | 1.396 | 0088 | 0.951 | 2.049 | |||||||||||||||||||||||||||||||||||||||||||||||||||||||||||||||||||||||||||||||||||||||||||||||
| Age, for 5 years | 1.011 | 0.732 | 0.950 | 1.076 | |||||||||||||||||||||||||||||||||||||||||||||||||||||||||||||||||||||||||||||||||||||||||||||||
| KD, 5 units | 1.204 | 0.002 | 1.068 | 1.358 | |||||||||||||||||||||||||||||||||||||||||||||||||||||||||||||||||||||||||||||||||||||||||||||||
| Sex (female = ref) | 1.583 | 0.132 | 0.871 | 2.877 | |||||||||||||||||||||||||||||||||||||||||||||||||||||||||||||||||||||||||||||||||||||||||||||||
| Age, for 5 years | 0.819 | 0.010 | 0.705 | 0.953 | |||||||||||||||||||||||||||||||||||||||||||||||||||||||||||||||||||||||||||||||||||||||||||||||
| PA, 5 units | 1.131 | 0.116 | 0.970 | 1.319 | |||||||||||||||||||||||||||||||||||||||||||||||||||||||||||||||||||||||||||||||||||||||||||||||
| Sex (female = ref) | 2.168 | 0.021 | 1.121 | 4.194 | |||||||||||||||||||||||||||||||||||||||||||||||||||||||||||||||||||||||||||||||||||||||||||||||
| Age, for 5 years | 0.903 | 0.308 | 0.742 | 1.099 | |||||||||||||||||||||||||||||||||||||||||||||||||||||||||||||||||||||||||||||||||||||||||||||||
| Legend: | |||||||||||||||||||||||||||||||||||||||||||||||||||||||||||||||||||||||||||||||||||||||||||||||||||
| KD, Klemera and Doubal biological age; PA, PhenoAge; PD, physiological dysregulation. | |||||||||||||||||||||||||||||||||||||||||||||||||||||||||||||||||||||||||||||||||||||||||||||||||||
| g: biomarker part of the final 14 biomarkers set used for global physiological dysregulation. | |||||||||||||||||||||||||||||||||||||||||||||||||||||||||||||||||||||||||||||||||||||||||||||||||||
| l: biomarker used for physiological dysregulation in the leukopoiesis system. | |||||||||||||||||||||||||||||||||||||||||||||||||||||||||||||||||||||||||||||||||||||||||||||||||||
| o: biomarker used for physiological dysregulation in the oxygen transport system. | |||||||||||||||||||||||||||||||||||||||||||||||||||||||||||||||||||||||||||||||||||||||||||||||||||
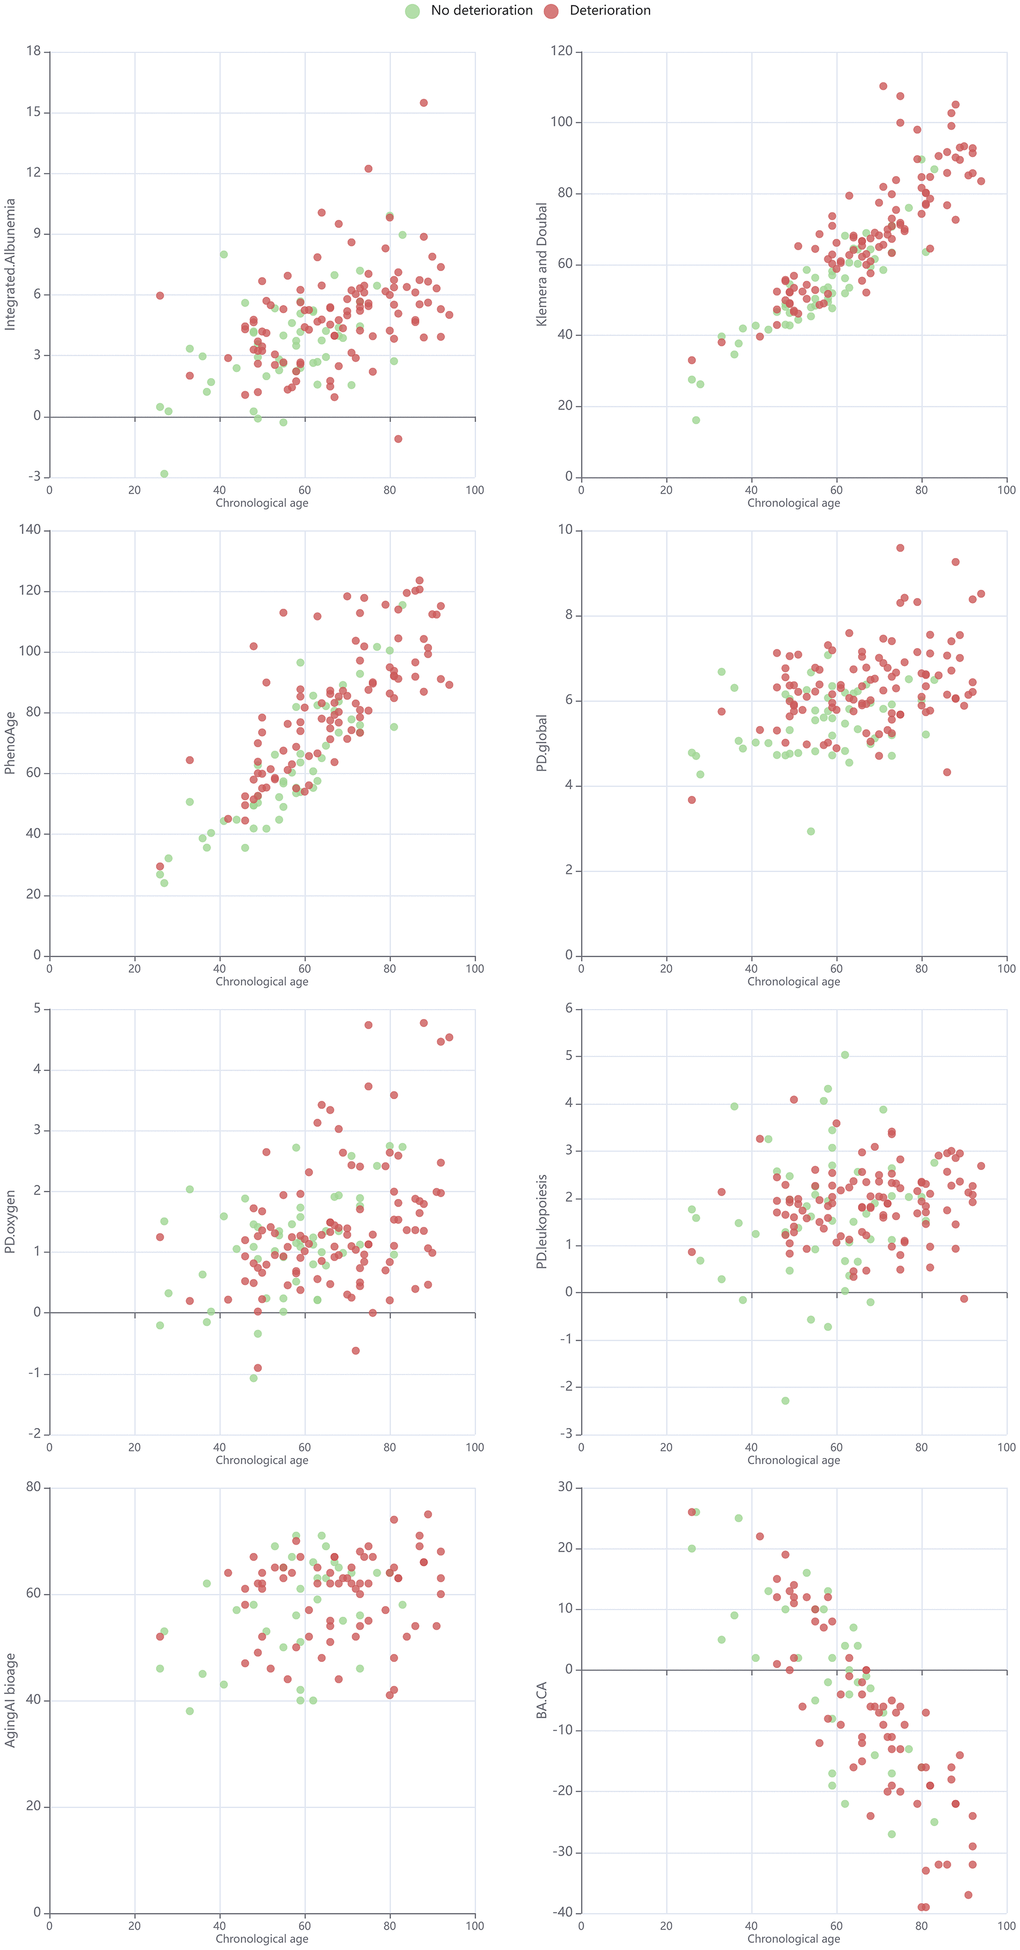
Figure 5. Scatterplot for chronological age and selected metrics of biological age or physiological state in cohorts split by deterioration.
As for the combined outcome (death or deterioration), the results were very similar to those for the deterioration outcome, which was expected, given that most cases of death involved deterioration (Table 5). The odds of outcome were increased by 41.7% per 0.5-unit increase in the PD global age, by 32.9% per 0.5-unit increase in the PD oxygen age, and by 20.4% per 5-unit increase in the KD age. Sex was not significantly associated with the outcome, while chronological age was significant only in the KD model.
Table 5. OR for the combined endpoint (death or deterioration of the patient's condition) obtained by multivariate logistic regression.
| Calculator | Factor | OR | p | 95% CI for OR | |||||||||||||||||||||||||||||||||||||||||||||||||||||||||||||||||||||||||||||||||||||||||||||||
| PD (g) for 0.5 units | 1.417 | <0.001 | 1.271 | 1.580 | |||||||||||||||||||||||||||||||||||||||||||||||||||||||||||||||||||||||||||||||||||||||||||||||
| Sex (female = ref) | 1.113 | 0.593 | 0.752 | 1.647 | |||||||||||||||||||||||||||||||||||||||||||||||||||||||||||||||||||||||||||||||||||||||||||||||
| Age, for 5 years | 0.988 | 0.706 | 0.926 | 1.054 | |||||||||||||||||||||||||||||||||||||||||||||||||||||||||||||||||||||||||||||||||||||||||||||||
| PD (l), 0,5 units | 1.329 | <0.001 | 1.194 | 1.480 | |||||||||||||||||||||||||||||||||||||||||||||||||||||||||||||||||||||||||||||||||||||||||||||||
| Sex (female = ref) | 1.396 | 0.088 | 0.951 | 2.049 | |||||||||||||||||||||||||||||||||||||||||||||||||||||||||||||||||||||||||||||||||||||||||||||||
| Age, for 5 years | 1.011 | 0.732 | 0.950 | 1.076 | |||||||||||||||||||||||||||||||||||||||||||||||||||||||||||||||||||||||||||||||||||||||||||||||
| KD, 5 units | 1.204 | 0.002 | 1.068 | 1.358 | |||||||||||||||||||||||||||||||||||||||||||||||||||||||||||||||||||||||||||||||||||||||||||||||
| Sex (female = ref) | 1.583 | 0.132 | 0.871 | 2.877 | |||||||||||||||||||||||||||||||||||||||||||||||||||||||||||||||||||||||||||||||||||||||||||||||
| Age, for 5 years | 0.819 | 0.010 | 0.705 | 0.953 | |||||||||||||||||||||||||||||||||||||||||||||||||||||||||||||||||||||||||||||||||||||||||||||||
| Legend: | |||||||||||||||||||||||||||||||||||||||||||||||||||||||||||||||||||||||||||||||||||||||||||||||||||
| KD, Klemera and Doubal biological age; PA, PhenoAge; PD, physiological dysregulation. | |||||||||||||||||||||||||||||||||||||||||||||||||||||||||||||||||||||||||||||||||||||||||||||||||||
| g: biomarker part of the final 14 biomarkers set used for global physiological dysregulation. | |||||||||||||||||||||||||||||||||||||||||||||||||||||||||||||||||||||||||||||||||||||||||||||||||||
| l: biomarker used for physiological dysregulation in the leukopoiesis system. | |||||||||||||||||||||||||||||||||||||||||||||||||||||||||||||||||||||||||||||||||||||||||||||||||||
| o: biomarker used for physiological dysregulation in the oxygen transport system. | |||||||||||||||||||||||||||||||||||||||||||||||||||||||||||||||||||||||||||||||||||||||||||||||||||
We also checked whether combining these two scales would yield better results. To this end, we built four-factor models including all pairwise combinations of the global PD, PA, and KD for all three outcomes (Tables 6, 7). In all cases, only one of the two metrics showed a significant association with the outcome, whereas the second metric showed no independent contribution. For death, PA and KD remained significant, while global PD was not, and for deterioration, it was global PD that remained significant, while KD and PA did not.
Table 6. OR of death obtained by multivariate logistic regression.
| Calculator | Factor | OR | p | 95% CI for OR | |||||||||||||||||||||||||||||||||||||||||||||||||||||||||||||||||||||||||||||||||||||||||||||||
| Sex (female = ref) | 2.276 | 0.217 | 0.616 | 8.404 | |||||||||||||||||||||||||||||||||||||||||||||||||||||||||||||||||||||||||||||||||||||||||||||||
| Age, for 5 years | 1.069 | 0.668 | 0.789 | 1.448 | |||||||||||||||||||||||||||||||||||||||||||||||||||||||||||||||||||||||||||||||||||||||||||||||
| PD (g) for 0.5 units | 1.310 | 0.160 | 0.899 | 1.911 | |||||||||||||||||||||||||||||||||||||||||||||||||||||||||||||||||||||||||||||||||||||||||||||||
| PhenoAge, 5 units | 1.541 | 0.002 | 1.173 | 2.024 | |||||||||||||||||||||||||||||||||||||||||||||||||||||||||||||||||||||||||||||||||||||||||||||||
| Sex (female = ref) | 3.662 | 0.125 | 0.697 | 19.233 | |||||||||||||||||||||||||||||||||||||||||||||||||||||||||||||||||||||||||||||||||||||||||||||||
| Age, for 5 years | 1.190 | 0.330 | 0.838 | 1.690 | |||||||||||||||||||||||||||||||||||||||||||||||||||||||||||||||||||||||||||||||||||||||||||||||
| PD (g) for 0.5 units | 1.352 | 0.196 | 0.856 | 2.138 | |||||||||||||||||||||||||||||||||||||||||||||||||||||||||||||||||||||||||||||||||||||||||||||||
| KD, 5 units | 1.324 | 0.017 | 1.051 | 1.667 | |||||||||||||||||||||||||||||||||||||||||||||||||||||||||||||||||||||||||||||||||||||||||||||||
| Sex (female = ref) | 2.907 | 0.277 | 0.424 | 19.940 | |||||||||||||||||||||||||||||||||||||||||||||||||||||||||||||||||||||||||||||||||||||||||||||||
| Age, for 5 years | 1.097 | 0.684 | 0.702 | 1.715 | |||||||||||||||||||||||||||||||||||||||||||||||||||||||||||||||||||||||||||||||||||||||||||||||
| PhenoAge, 5 units | 1.146 | 0.620 | 0.668 | 1.967 | |||||||||||||||||||||||||||||||||||||||||||||||||||||||||||||||||||||||||||||||||||||||||||||||
| KD, 5 units | 1.368 | 0.092 | 0.950 | 1.971 | |||||||||||||||||||||||||||||||||||||||||||||||||||||||||||||||||||||||||||||||||||||||||||||||
| Legend: | |||||||||||||||||||||||||||||||||||||||||||||||||||||||||||||||||||||||||||||||||||||||||||||||||||
| KD, Klemera and Doubal biological age; PA, PhenoAge; PD, physiological dysregulation. | |||||||||||||||||||||||||||||||||||||||||||||||||||||||||||||||||||||||||||||||||||||||||||||||||||
| g: biomarker part of the final 14 biomarkers set used for global physiological dysregulation. | |||||||||||||||||||||||||||||||||||||||||||||||||||||||||||||||||||||||||||||||||||||||||||||||||||
| l: biomarker used for physiological dysregulation in the leukopoiesis system. | |||||||||||||||||||||||||||||||||||||||||||||||||||||||||||||||||||||||||||||||||||||||||||||||||||
| o: biomarker used for physiological dysregulation in the oxygen transport system. | |||||||||||||||||||||||||||||||||||||||||||||||||||||||||||||||||||||||||||||||||||||||||||||||||||
Table 7. Odds ratios (OR) of patient deterioration obtained by multivariate logistic regression.
| Calculator | Factor | OR | p | 95% CI for OR | |||||||||||||||||||||||||||||||||||||||||||||||||||||||||||||||||||||||||||||||||||||||||||||||
| Sex (female = ref) | 1.687 | 0.140 | 0.843 | 3.377 | |||||||||||||||||||||||||||||||||||||||||||||||||||||||||||||||||||||||||||||||||||||||||||||||
| Age, for 5 years | 0.966 | 0.747 | 0.784 | 1.190 | |||||||||||||||||||||||||||||||||||||||||||||||||||||||||||||||||||||||||||||||||||||||||||||||
| PD (g) for 0.5 units | 1.479 | 0.001 | 1.173 | 1.864 | |||||||||||||||||||||||||||||||||||||||||||||||||||||||||||||||||||||||||||||||||||||||||||||||
| PhenoAge, 5 units | 1.012 | 0.891 | 0.854 | 1.200 | |||||||||||||||||||||||||||||||||||||||||||||||||||||||||||||||||||||||||||||||||||||||||||||||
| Sex (female = ref) | 1.011 | 0.971 | 0.516 | 1.984 | |||||||||||||||||||||||||||||||||||||||||||||||||||||||||||||||||||||||||||||||||||||||||||||||
| Age, for 5 years | 0.855 | 0.049 | 0.732 | 0.999 | |||||||||||||||||||||||||||||||||||||||||||||||||||||||||||||||||||||||||||||||||||||||||||||||
| PD (g) for 0.5 units | 1.592 | <0.001 | 1.280 | 1.980 | |||||||||||||||||||||||||||||||||||||||||||||||||||||||||||||||||||||||||||||||||||||||||||||||
| KD, 5 units | 1.095 | 0.154 | 0.966 | 1.241 | |||||||||||||||||||||||||||||||||||||||||||||||||||||||||||||||||||||||||||||||||||||||||||||||
| Sex (female = ref) | 3.093 | 0.020 | 1.194 | 8.016 | |||||||||||||||||||||||||||||||||||||||||||||||||||||||||||||||||||||||||||||||||||||||||||||||
| Age, for 5 years | 0650 | 0.009 | 0.471 | 0.898 | |||||||||||||||||||||||||||||||||||||||||||||||||||||||||||||||||||||||||||||||||||||||||||||||
| PhenoAge, 5 units | 1359 | 0.061 | 0.986 | 1.874 | |||||||||||||||||||||||||||||||||||||||||||||||||||||||||||||||||||||||||||||||||||||||||||||||
| KD, 5 units | 1122 | 0.304 | 0.901 | 1.398 | |||||||||||||||||||||||||||||||||||||||||||||||||||||||||||||||||||||||||||||||||||||||||||||||
| Legend: | |||||||||||||||||||||||||||||||||||||||||||||||||||||||||||||||||||||||||||||||||||||||||||||||||||
| KD, Klemera and Doubal biological age; PA, PhenoAge; PD, physiological dysregulation. | |||||||||||||||||||||||||||||||||||||||||||||||||||||||||||||||||||||||||||||||||||||||||||||||||||
| g: biomarker part of the final 14 biomarkers set used for global physiological dysregulation. | |||||||||||||||||||||||||||||||||||||||||||||||||||||||||||||||||||||||||||||||||||||||||||||||||||
| l: biomarker used for physiological dysregulation in the leukopoiesis system. | |||||||||||||||||||||||||||||||||||||||||||||||||||||||||||||||||||||||||||||||||||||||||||||||||||
| o: biomarker used for physiological dysregulation in the oxygen transport system. | |||||||||||||||||||||||||||||||||||||||||||||||||||||||||||||||||||||||||||||||||||||||||||||||||||
Thus, we can say that some scales, especially the final 14 biomarker sets used for calculating the global PD, could serve as predictors for both deterioration and death in patients with COVID-19.
Discussion
Recent studies showed that the severity of COVID-19 was more strongly associated with the biological age rather than the chronological age [14, 15]. In this study, we evaluated the possibility of using physiological state indices to predict disease outcomes. The hypothesis of this study was that summary metrics of physiological state, which take into account morphological, physiological, and functional characteristics of the organism, should better predict disease outcomes. According to our results, some physiological indices predicted a higher risk of mortality and deterioration in the models adjusted for chronological age. The global PD, calculated using the Mahalanobis distance (MD) [11] and including 14 biomarkers (mean corpuscular hemoglobin [MCH], red cell distribution width [RDW], red blood cell [RBC], platelets, percentage of lymphocytes, white blood cell [WBC], C-reactive protein [CRP], potassium, sodium, hemoglobin, albumin, alanine transaminase [ALT], aspartate aminotransferase [AST], and total protein), appeared to be one of the best predictors for death and deterioration of patients with COVID-19. Such results were expected because this calculator consists of crucial parameters for the outcomes. Therefore, WBC, CRP, and other biomarkers, which are commonly used in clinical practice to evaluate COVID-19 severity, along with the chronological age, can be combined into integral models to determine the risk of unfavorable outcomes of the disease. However, the MD calculation involves a non-monotonic manipulation of each component variable and, as such, is not necessarily associated directly with higher levels of individual markers. It is important to note that, unlike other risk scores for COVID-19 severity, this index did not include assessment of comorbidities, for which an assessment could be complicated, especially in case of emergency hospitalizations. Interestingly, integrated albunemia had no association with COVID-19 outcomes, although some of its indicators, including the calcium levels, were strongly correlated with mortality and deterioration. In addition, it should be noted that in the combined indices in the same models, PD did not predict mortality anymore but was still an extremely strong predictor of deterioration. Therefore, we can say that the indices did not measure exactly the same thing.
The aging process is manifested in progressive systemic remodeling of body functioning; therefore, a number of biological dimensions are associated with this process. Most biological indices for age are associated with chronic diseases and unhealthy lifestyle. Strong associations between severe COVID-19 and biological age once again emphasize the importance of preventing aging, both in individuals and in the entire population. The strong association of PD with severe COVID-19 outcomes also suggests the importance of maintaining physiological equilibrium, regardless of age. Unlike PA and KD, the effect of chronological age remained strong in models with PD, suggesting that PD measures information that is more weakly associated with aging and yet is nonetheless critical for health.
Thus, our results are partly attributed to common chronic diseases, which aggravate COVID-19, but also suggest that biological age indices could capture vulnerability to severe COVID-19 and serve as a tool for course prediction and determination of tactics for patient management.
The biological age, as measured by different indices, was associated with a higher risk of mortality and deterioration in the models for which the chronological age and sex were adjusted. Thus, multivariate indices of the physiological state, including the PD, can be used to determine the risk of deterioration and death in a patient. PD measured using the MD could serve as a panel to assess patient risk because it is composed of common markers widely used in clinical practice.
Author Contributions
All authors contributed equally.
Conflicts of Interest
A. A. C. is the CEO and founder of Oken Health.
Funding
This research was conducted with funding from the following institutions. This work was supported by the Canadian Institute of Health Research (grant number: 153011). A. A. C. is also a member of the Center de Recherche du CHUS and Center de Recherché sur le Vieillissement, which are funded by the Fonds de Recherche du Québec – Santé (FRQS), and A. A. C. holds a Senior Research Fellowship from the FRQS (2020–2024).
References
- 1. Mueller AL, McNamara MS, Sinclair DA. Why does COVID-19 disproportionately affect older people? Aging (Albany NY). 2020; 12:9959–81. https://doi.org/10.18632/aging.103344 [PubMed]
- 2. Zhavoronkov A. Geroprotective and senoremediative strategies to reduce the comorbidity, infection rates, severity, and lethality in gerophilic and gerolavic infections. Aging (Albany NY). 2020; 12:6492–510. https://doi.org/10.18632/aging.102988 [PubMed]
- 3. Cunha LL, Perazzio SF, Azzi J, Cravedi P, Riella LV. Remodeling of the immune response with aging: immunosenescence and its potential impact on COVID-19 immune response. Front Immunol. 2020; 11:1748. https://doi.org/10.3389/fimmu.2020.01748 [PubMed]
- 4. Pranata R, Henrina J, Lim MA, Lawrensia S, Yonas E, Vania R, Huang I, Lukito AA, Suastika K, Kuswardhani RA, Setiati S. Clinical frailty scale and mortality in COVID-19: A systematic review and dose-response meta-analysis. Arch Gerontol Geriatr. 2021; 93:104324. https://doi.org/10.1016/j.archger.2020.104324 [PubMed]
- 5. Levine ME. Modeling the rate of senescence: can estimated biological age predict mortality more accurately than chronological age? J Gerontol A Biol Sci Med Sci. 2013; 68:667–74. https://doi.org/10.1093/gerona/gls233 [PubMed]
- 6. Kuo CL, Pilling LC, Atkins JL, Masoli JA, Delgado J, Tignanelli C, Kuchel GA, Melzer D, Beckman KB, Levine ME. Biological aging predicts vulnerability to COVID-19 severity in UK Biobank participants. J Gerontol A Biol Sci Med Sci. 2021; 76:e133–41. https://doi.org/10.1093/gerona/glab060 [PubMed]
- 7. Cohen AA, Milot E, Li Q, Bergeron P, Poirier R, Dusseault-Bélanger F, Fülöp T, Leroux M, Legault V, Metter EJ, Fried LP, Ferrucci L. Detection of a novel, integrative aging process suggests complex physiological integration. PLoS One. 2015; 10:e0116489. https://doi.org/10.1371/journal.pone.0116489 [PubMed]
- 8. Klemera P, Doubal S. A new approach to the concept and computation of biological age. Mech Ageing Dev. 2006; 127:240–8. https://doi.org/10.1016/j.mad.2005.10.004 [PubMed]
- 9. Levine ME, Lu AT, Quach A, Chen BH, Assimes TL, Bandinelli S, Hou L, Baccarelli AA, Stewart JD, Li Y, Whitsel EA, Wilson JG, Reiner AP, et al. An epigenetic biomarker of aging for lifespan and healthspan. Aging (Albany NY). 2018; 10:573–91. https://doi.org/10.18632/aging.101414 [PubMed]
- 10. Cohen AA, Milot E, Yong J, Seplaki CL, Fülöp T, Bandeen-Roche K, Fried LP. A novel statistical approach shows evidence for multi-system physiological dysregulation during aging. Mech Ageing Dev. 2013; 134:110–7. https://doi.org/10.1016/j.mad.2013.01.004 [PubMed]
- 11. Cohen AA, Milot E, Li Q, Legault V, Fried LP, Ferrucci L. Cross-population validation of statistical distance as a measure of physiological dysregulation during aging. Exp Gerontol. 2014; 57:203–10. https://doi.org/10.1016/j.exger.2014.04.016 [PubMed]
- 12. Cohen AA, Li Q, Milot E, Leroux M, Faucher S, Morissette-Thomas V, Legault V, Fried LP, Ferrucci L. Statistical distance as a measure of physiological dysregulation is largely robust to variation in its biomarker composition. PLoS One. 2015; 10:e0122541. https://doi.org/10.1371/journal.pone.0122541 [PubMed]
- 13. Li Q, Wang S, Milot E, Bergeron P, Ferrucci L, Fried LP, Cohen AA. Homeostatic dysregulation proceeds in parallel in multiple physiological systems. Aging Cell. 2015; 14:1103–12. https://doi.org/10.1111/acel.12402 [PubMed]
- 14. Polidori MC, Sies H, Ferrucci L, Benzing T. COVID-19 mortality as a fingerprint of biological age. Ageing Res Rev. 2021; 67:101308. https://doi.org/10.1016/j.arr.2021.101308 [PubMed]
- 15. Lauc G, Sinclair D. Biomarkers of biological age as predictors of COVID-19 disease severity. Aging (Albany NY). 2020; 12:6490–1. https://doi.org/10.18632/aging.103052 [PubMed]