


Introduction
GC is a common gastrointestinal malignancy originating from gastric mucosa epithelial cells, and it ranks fifth for cancer incidence and third for cancer deaths worldwide [1, 2]. The 2015 cancer statistics showed that GC has the third-highest cancer morbidity and the second-highest cancer mortality in China [3], ranking higher than most developed countries in Europe and North America [4]. However, early GC patients tend to be asymptomatic and cannot be diagnosed until the advanced stage, who have to face a risk of rapid metastasis and poor prognosis [2]. In the Chinese population, patients with stage III GC make up 50%-60% of the total GC cases, a higher prevalence than that achieved in South Korea or Japan. The 5-year survival rate of Chinese patients is only 35.9%, significantly lower compared to 60%-70% in South Korea and Japan. Current management for advanced GC in China mainly incorporates palliative surgery, radiotherapy, chemotherapy, biological therapy (or immunotherapy), and traditional Chinese medicine. Immunotherapy has been proven to benefit advanced GC patients with no response to chemotherapy [5]. As growing clinical trials center on personalized treatment for GC patients, individualized prescription of chemotherapy or immunotherapy has been another challenge in China.
Autophagy is a highly conservative process that maintains the stability of the intracellular environment by degrading the organelles damaged by aging and their misfolded proteins and reusing the products [6]. It is essential in various pathophysiological or metabolic processes in immunity, aging, tumors, nervous system diseases [7], and the occurrence and development of several cancer types (e.g., GC). For example, studies of Beclin-1 protein expression (a key inhibitor/activator of autophagy) analyzed 60 GC tissues and demonstrated that Beclin-1 was expressed in 83% of GC tissues, but it was sparsely expressed in normal gastric mucosa cells [8, 9]. Autophagy upregulates PD-L1 expression, the most important immune checkpoint inhibitor gene in GC, via the p62/SQSTM1-NF-κB pathway [10]. Besides, kallikrein-related peptidase 6 (KLK6), a biomarker of GC associated with poor prognosis, could induce chemotherapeutic resistance by attenuating auranofin-induced cell death via an activation of autophagy in GC [11]. Consequently, identification of key regulators associated with autophagy can offer more precise diagnosis and personalized treatment for GC patients.
LncRNAs are a class of RNA transcripts with a length greater than 200nt. They are abundant and account for about 90% of the entire human transcriptome [12, 13] and regulate gene expression at the epigenetic, transcriptional, or post-transcriptional level but do not encode proteins [14]. LncRNAs have been shown to promote or inhibit autophagy via various pathways to determine carcinogenesis or carcinoma control. LncRNA-HAGLROS overexpression promotes the occurrence and development of GC via mTOR signal-mediated autophagy inhibition [15]. LncRNA-SNHG11 fuels GC progression by activating the Wnt/β-Catenin pathway and carcinogenic autophagy [16]. LncRNA-MALAT1 enhances autophagy-related chemical resistance by regulating the autophagy-related gene axis (ATG5 axis) in GC [17]. Alterations in the tumor immune microenvironment (TIME), particularly immune cell infiltration mediated by lncRNAs, are critical to patient prognosis [18, 19]. Autophagy-related lncRNAs have shown the potential to discriminate high-risk cancer patients from low-risk ones. Compared to a monogenic model, a multigenic model offers a more accurate prediction for cancer prognosis. For example, a prognostic risk model based on autophagy-related lncRNAs has been shown to exhibit high efficacy in predicting the prognosis of breast cancer [20] and bladder urothelial carcinoma [21]. However, models for prognosis prediction or assessment of immune cell infiltration and immune checkpoint gene expressions in GC have not been reported elsewhere, and if any, the feasibility of such models needs validation. In this study, we aimed to utilize the LASSO algorithm (COX regression analysis), pairwise transcriptome analysis, and iteration to identify optimal autophagy-related lncRNA pairs associated with GC prognosis for risk model construction. Differences in immune cell infiltration and sensitivity of patients to immunotherapy and chemotherapy between low- and high-risk groups were compared. This new tool for GC prognosis and treatment will shed light on the roles of autophagy-related lncRNAs in the TIME of GC.
Results
Differentially expressed autophagy-related lncRNAs in GC
The transcriptome analysis of 375 GC and 32 normal tissues from TCGA identified 157 autophagy-related lncRNAs. The co-expression network revealed autophagy-related mRNA-lncRNA interactions in GC (Figure 1A). Among others, 102 autophagy-related lncRNAs differentially expressed between GC and normal tissues were confirmed, including 65 down-regulated lncRNAs and 37 up-regulated ones (Figure 1B, 1C).
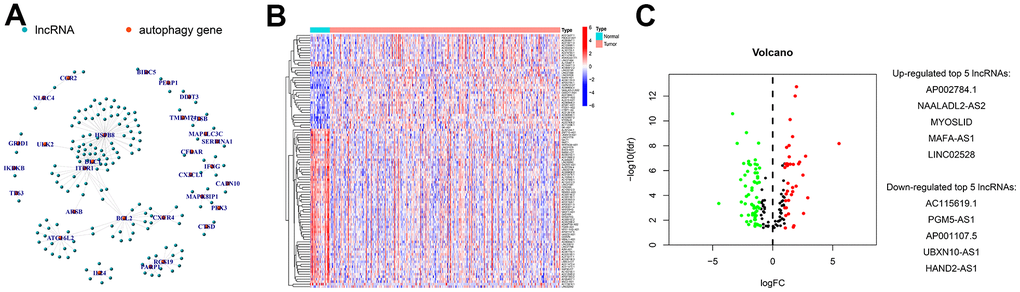
Figure 1. Screening and identification of differentially expressed autophagy-related lncRNAs in GC. (A) Construction of autophagy-related mRNA-lncRNA interactions using co-expression network analysis. Genes differentially expressed between GC and normal tissues were identified using differential analysis, and their expressions were visualized in (B) heatmaps and (C) volcanic plots. The identified top 5 increased or decreased autophagy-related lncRNAs in GC are also listed in panel C.
Construction of a GC risk model based on autophagy-related lncRNA pairs
We performed the pairwise transcriptome analysis of the 102 differential genes and found 2,895 autophagy-related lncRNA pairs showed significant differential expression in GC versus normal tissues. These genes were input to the LASSO algorithm, and nine optimal gene pairs associated with GC prognosis were ultimately confirmed using univariate Cox regression (Figure 2A, 2B) and visualized in forest plots of hazard ratios (Figure 2C, 2D). The median RiskScore for risk stratification was 1.138 (Figure 3A), upon which GC patients from TCGA were classified into the low- (a RiskScore < 1.138) and high-risk groups (a RiskScore > 1.138). For the accuracy of this model, the ROC curve analysis showed a moderate AUC for 1-, 2-, and 3-year overall survival prediction of GC patients of 0.713 (Figure 3B), more accurate than other clinicopathological features, such as age (AUC = 0.587), sex (AUC = 0.524), pathological grade (AUC = 0.557), and clinical stage (AUC = 0.597) (Figure 3C).
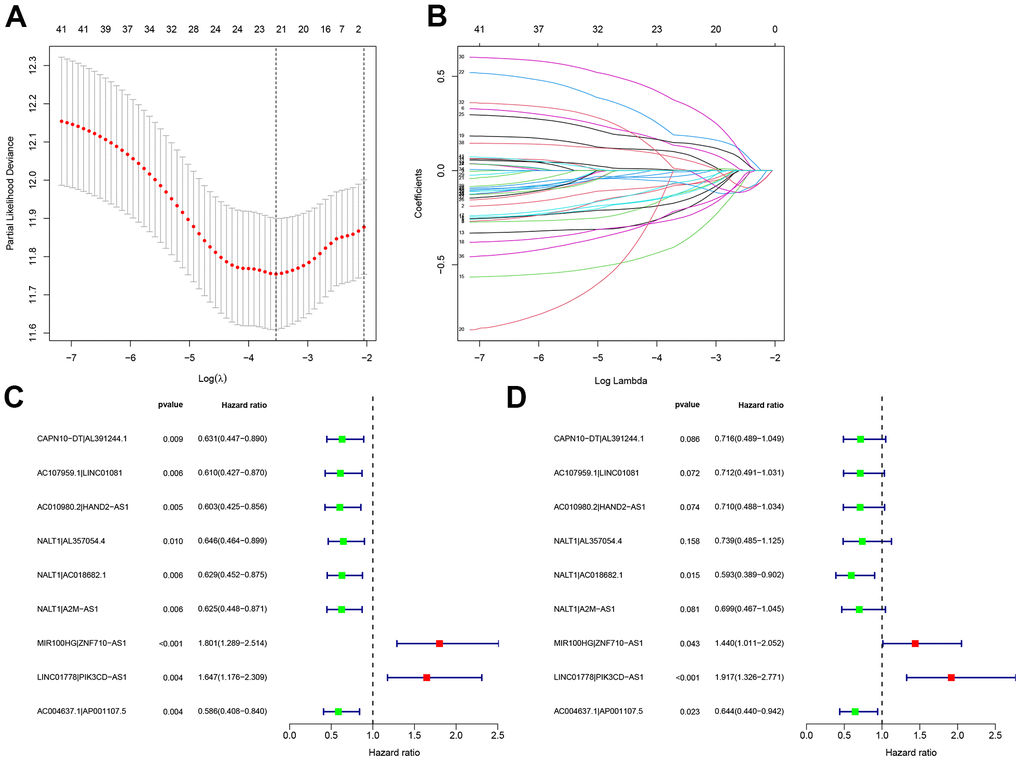
Figure 2. Construction of a GC risk model based on autophagy-related lncRNA pairs. (A, B) Univariate Cox regression and LASSO algorithm were utilized to identify optimal autophagy-related lncRNA pairs associated with GC survival. The optimal gene pairs were subjected to the Cox proportional hazard model using (C) univariate and (D) multivariate analyses. A prognostic model was constructed using a stepwise regression method. Hazard ratios were visualized in forest plots.
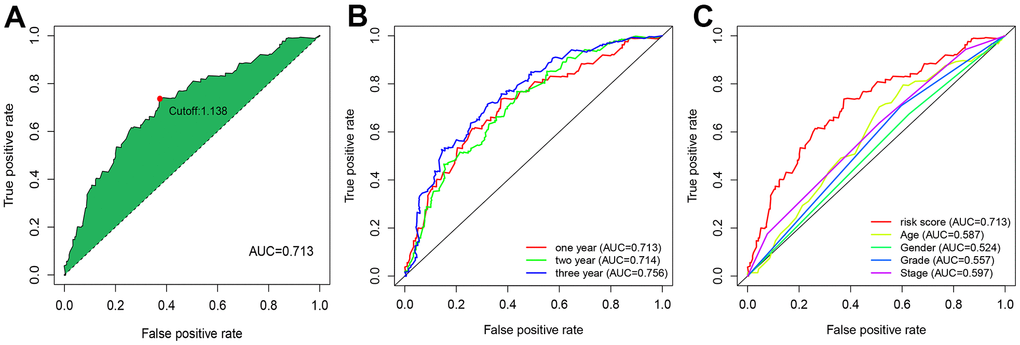
Figure 3. ROC curve analysis revealed moderate accuracy of the risk model in prognosis prediction. (A) Accuracy of the risk model in predicting the overall survival of GC patients. (B) Accuracy of the risk model in predicting 1-, 2-, and 3-year overall survival of GC patients. (C) Comparison of the prediction accuracy of the risk model with clinicopathological features, such as age, sex, and pathological grading.
Internal validation of the risk model for GC prognosis
A TCGA cohort incorporating 160 high-risk patients and 190 low-risk patients was used for internal validation of the predictive efficacy of the risk model. As shown in Figure 4A, 4B, the risk score was negatively correlated with the overall survival rate of GC patients. In Kaplan-Meier survival analysis, high-risk patients had shorter overall survival than low-risk patients (P < 0.001) (Figure 4C). Univariate (HR=1. 677, 95%CI: 1.435-1.961, P < 0.001) and multivariate Cox risk ratio analysis (HR=1.706, 95%CI: 1.448-2.010, P < 0.001) showed that the risk model could serve as an independent prognostic predictor for GC (Figure 4D, 4E). The RiskScore also had significant correlations with T stage (Figure 4G) and clinical staging (Figure 4H) that patients with late clinical stages often yielded higher RiskScores. The correlations were visualized in heatmaps and boxplots (Figure 4F).
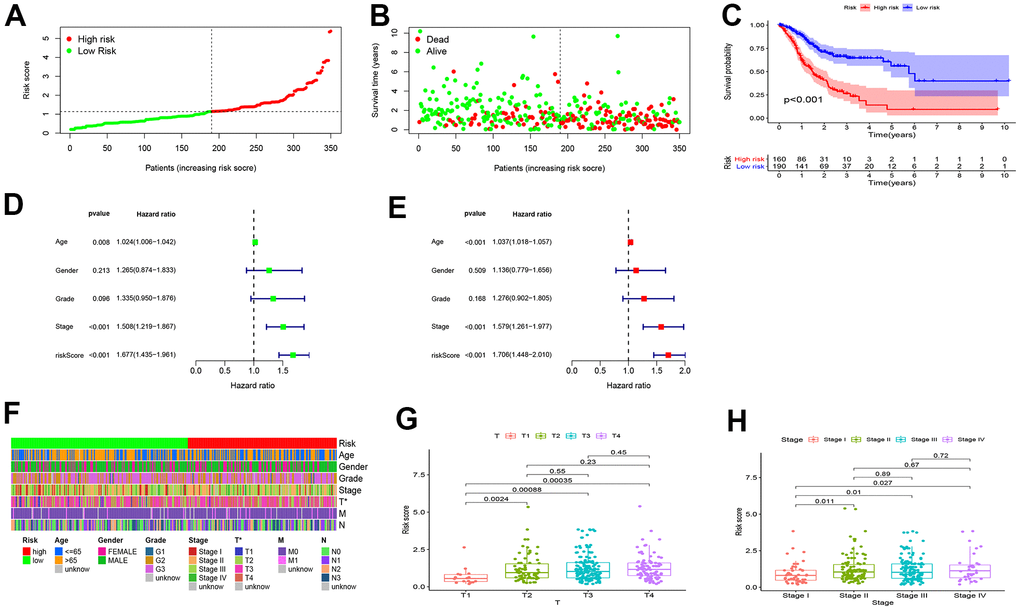
Figure 4. Internal validation of the risk model for GC prognosis. (A, B) The RiskScore and overall survival rate of each patient in the low- and high-risk group. (C) High-risk patients had shorter overall survival than low-risk patients. (D) Univariate and (E) multivariate Cox risk ratio analysis revealed that the risk model could predict GC prognosis independently. (F–H) The Wilcoxon signed-rank test showed that patients with high RiskScore often yielded late clinical stages, and the results were visualized in heatmaps and boxplots.
Differences in tumor-infiltrating immune cell (TIC) landscape between low- and high-risk patients with GC
As TICs determine cancer cell fate and involve in GC prognosis, we assessed whether the nine autophagy-related lncRNA pairs in the risk model (RiskScore) are associated with the TIC landscape supporting tumor progression using the Wilcoxon signed-rank test (Figure 5). High-risk patients exhibited a higher degree of B memory cell, cancer-associated fibroblast (CAF), endothelial cell, macrophage infiltration versus low-risk patients (Figure 6A–6D). An increased degree of M0 macrophage, activated and memory CD4+ T cell, naive CD8+ T cell, and mast cell infiltration was present in the TIME of low-risk patients (Figure 6E–6H).
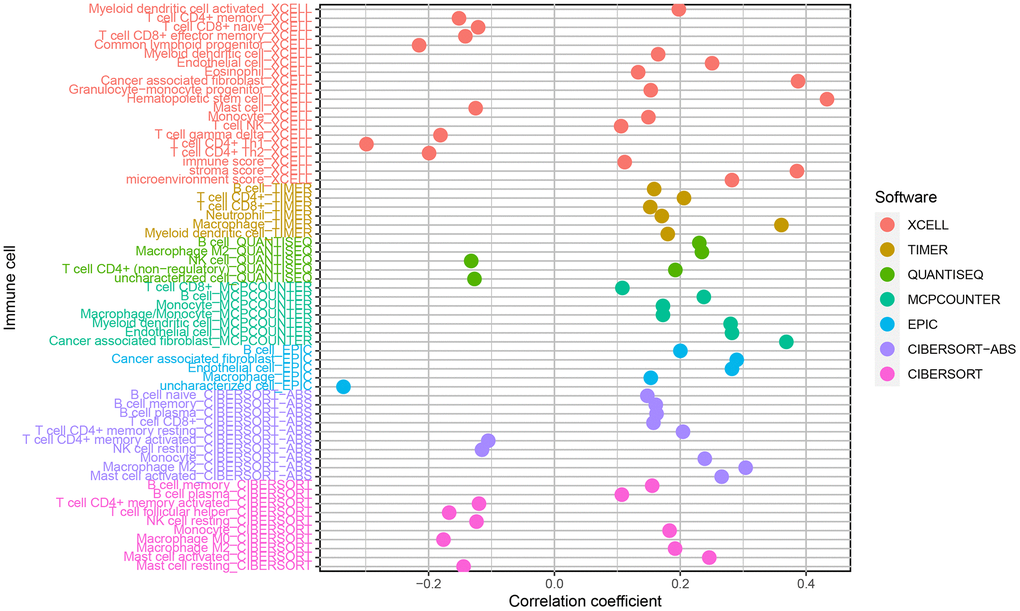
Figure 5. Correlations of the risk model (RiskScore) based on nine autophagy-related lncRNA pairs with tumor-infiltrating immune cell landscape.
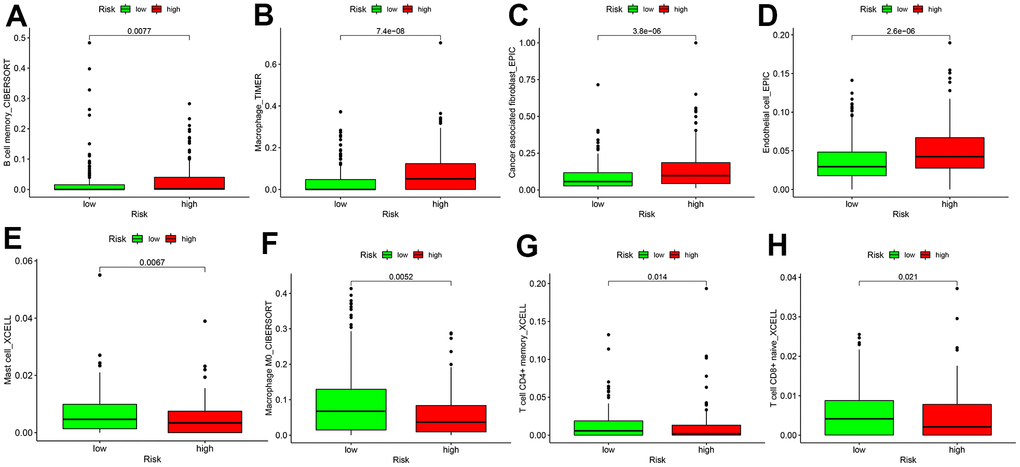
Figure 6. Differences in tumor-infiltrating immune cell subpopulations between GC low- and high-risk patients. (A) B cell memory; (B) Macrophage cell; (C) Cancer associated fibroblast cell; (D) Endothelial cell; (E) Mast cell; (F) Macrophage M0 cell; (G) CD4+ T memory cell; (H) T cell CD8+naive cell.
Sensitivity of GC patients to chemotherapy agents and ICIs
As for chemotherapy sensitivity, the five common agents mentioned above were selected for comparisons of IC50 values between the low- and high-risk groups. GC high-risk patients showed lower IC50 values for bexarotene, bicalutamide, bortezomib, bryostatin, and rapamycin (all P < 0.05) (Figure 7), indicating that patients in this group may have high sensitivity to these chemotherapy agents. The correlation of low- or high-risk GC patients with ICI marker genes was also assessed, and the results showed that CD274 (PD-L1), CD28, TGFBR1, and TNFSF4 (OX40L) expressions were all up-regulated in high-risk GC patients compared with the low-risk ones. All differentially expressed ICI marker genes were detailed in Figure 8. These results suggest that the RiskScore model based on autophagy-related lncRNA pairs shows immunotherapy and chemotherapy benefits to GC patients.
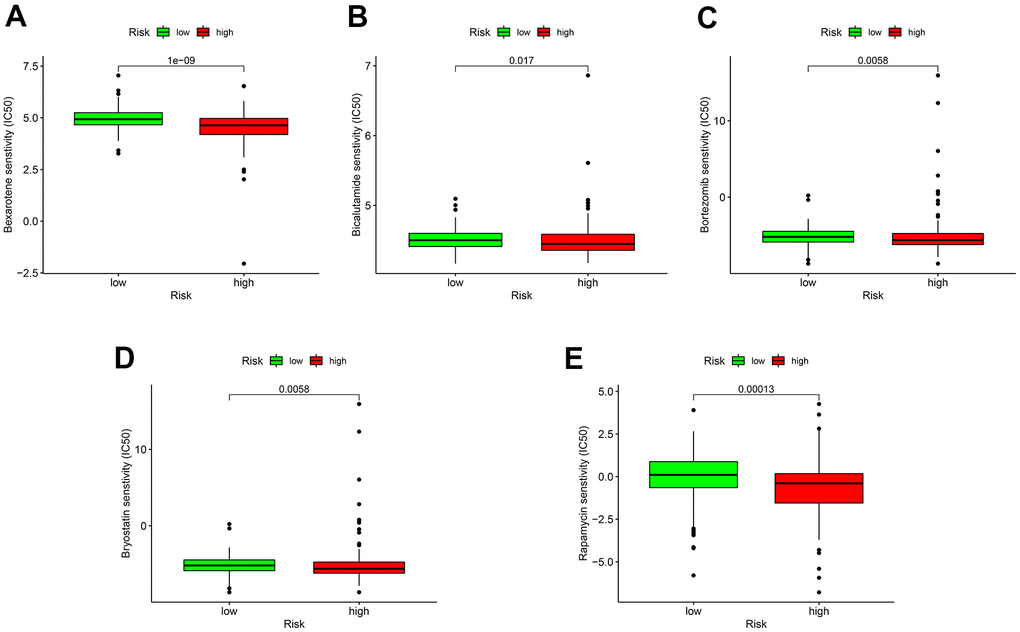
Figure 7. Sensitivity of low- or high-risk patients to five common chemotherapy agents. The y-axis represents 50% inhibitory concentration (IC50). (A) Bexarotene; (B) Bicalutamide; (C) Bortezomib; (D) Bryostatin; (E) Rapamycin.
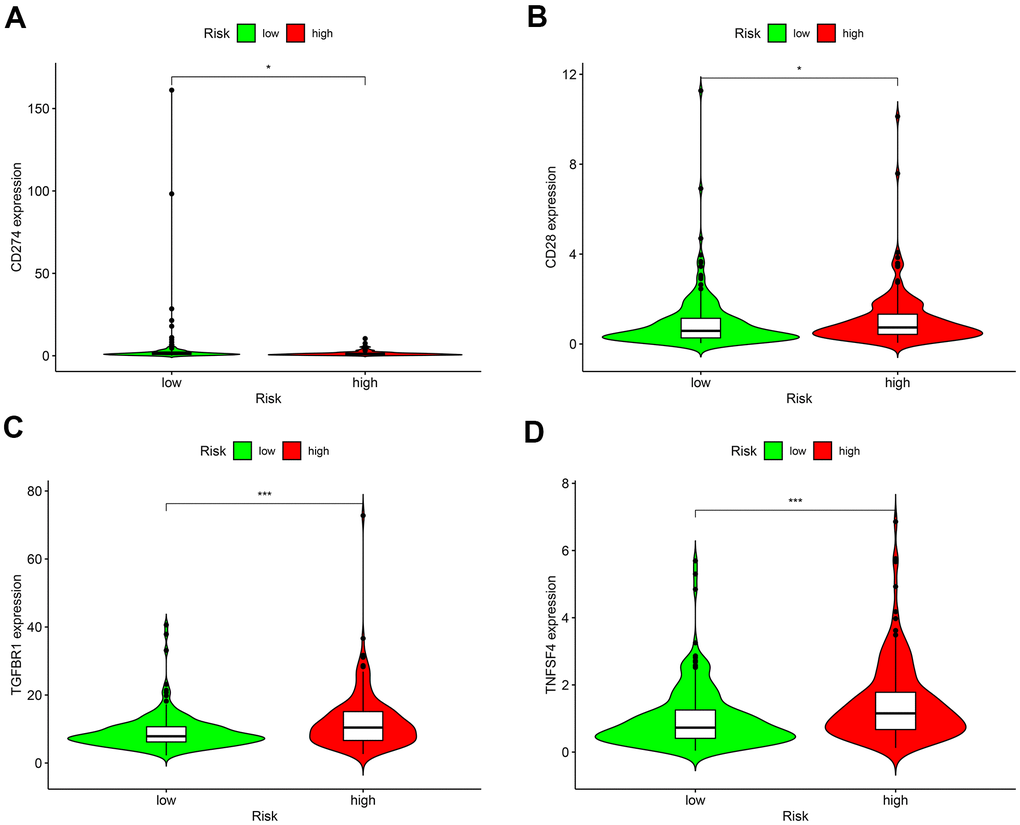
Figure 8. Differences in the expressions of marker genes for immune checkpoint inhibitors between low- and high-risk patients. (A) CD274 (PD-L1); (B) CD28; (C) TGFBR1; (D) TNFSF4 (OX40L). *P < 0.05, **P < 0.01, ***P < 0.001.
Discussion
GC is one of the most frequent malignancies worldwide, with morbidity and mortality still mounting [22]. Although the 5-year survival rate of early GC patients can reach more than 95%, the majority of patients are diagnosed at the late stage, with an unfavorable prognosis and insurmountable drug resistance [22, 23]. Currently, insufficient biomarkers have been documented for outcome prediction for GC patients after treatment [24, 25]. Autophagy has been shown to participate in the occurrence and development of GC, and autophagy-related biomarkers may aid in more accurate diagnosis early on [26]. In the last decade, autophagy-relate lncRNA signature-based cancer markers have been studied and proven to show tight associations with cancer cell growth and survival, chromatin modification, genome imprinting, and other significant biological functions [27]. For example, upregulation of lncRNA-SNHG11 in GC correlated with dismal patient outcomes, and aggravated oncogenic autophagy to facilitate cell proliferation and metastasis via triggering the Wnt/β-Catenin pathway and oncogenic autophagy. Moreover, lncRNA-MALAT1 functioned as a competing endogenous RNA (ceRNA) for miR-23b-3p and weakens the prohibitive effect of miR-23b-3p on ATG12, resulting in chemo-induced autophagy and chemoresistance in GC cells [28]. Therefore, it is imperative to identify autophagy-specific lncRNAs associated with GC survival and clinical treatments. In the present study, we constructed a risk model (RiskScore) based on autophagy-related prognostic lncRNA pairs and demonstrated a good performance of this signature in prognosis prediction and assessment of the sensitivity of GC patients to ICIs and common chemotherapy agents.
Pairwise transcriptome analysis is commonly utilized to screen survival-associated RNAs in cancers, which is effective for fast cancer gene marker identification for prognosis prediction. In the present work, we obtained 102 autophagy-related lncRNAs differentially expressed in GC via differential analysis of the transcriptome data of GC tissues, which were subsequently subjected to pairwise transcriptome analysis [29]. After 2,895 effective autophagy-related lncRNA pairs were screened and samples with missing or incomplete information were discarded, they were merged with survival data from TCGA with the limma package. Among these gene pairs, 42 prognostic gene pairs were selected using univariate Cox regression (P = 0.01) and were input to the LASSO regression model for cross-validation. Ultimately, 9 optimal gene pairs were obtained for risk model construction. In the above procedures, the gene pairs selected via pairwise transcriptome analysis are exempt from batch adjustments--required when transcriptome data from TCGA for model construction are merged with chips or PCR data from clinical studies--and repetitive adjustments for the risk model. Instead, this method increases the feasibility of the risk model in clinical application. The modified LASSO algorithm we used in our analysis was proposed by Sveen et al. Absolute gene expression can reflect differentially expressed genes between cancer and normal samples [30]. This modeling method based on the rank of occurrence frequency of differentially expressed genes is effective in assessing the performance of lncRNA pairs prognosis prediction [30], which showed moderate AUC values for 1-, 2-, and 3-year survival prediction. This result was further supported by Kaplan-Meier survival analysis. The optimal RiskScore cut-off was calculated for risk stratification, and comparisons of the risk model (RiskScore) based on the nine autophagy-related lncRNA pairs with other clinical indicators revealed the better performance of the risk model than that of age, sex, pathological grading, and clinical staging.
For far too long, tumors with ubiquitous mutations have been repeatedly detected. Tumor cells bearing mutations can produce abundant new antigens that are subsequently recognized by T cells, stimulating the selective recruitment of immune cells [31]. So tumor stroma is infiltrated with immune cells, which is a critical mechanism for immunotherapy efficacy, notwithstanding the type, location, and density of immune cells [32]. We also explored whether a relationship was present between immune cell infiltration and the risk model (RiskScore) in high-risk patients. The results showed that autophagy-related lncRNAs were significantly correlated with tumor infiltration by CAFs, hematopoietic stem cells, CD4+ Th1, and other immune cells. In high-risk patients, the TIME consists of abundant B memory cells, cancer-associated fibroblasts (CAFs), endothelial cells, and macrophages, which supports tumor growth; whereas low-risk patients showed more M0 macrophages, activated and memory CD4+ T cells, naive CD8+ T cells, which have a strong effect on tumor cell killing. Therefore, the current risk model may offer efficacy prediction for immunotherapy. The degree of tumor infiltration by CD8 + T cells has been proven to predict the prognosis in some cancer types, such as melanoma, ovarian, and colon [33]. Increased naive and memory B cell, resting memory CD4+ T cell, follicular helper T (Tfh) cell, monocyte, resting natural killing (NK) cell, M0 and M1 macrophage, resting mast cell, and activated mast cell infiltration suggests significant immune regulation in the cancer microenvironment, which offers more options for immunotherapy and more targets for sensitivity assessment [34–36].
Radiotherapy and chemotherapy are mainstream treatments for GC patients following surgical resection [37]. As predicted by the risk model, high-risk patients showed lower IC50 values for bexarotene, bicalutamide, bortezomib, bryostatin, and rapamycin. This finding shows the potential of this model as a guide to personalized prescriptions of chemotherapy agents for GC patients. High heterogeneity of GC patients and complex tumor-host differences lead to a high mutation rate in cancer cells. Patients bearing these mutations tend to develop chemotherapy resistance and ultimately turn to immunotherapy [38, 39]. In a healthy immune system, immune cells can recognize and eliminate cancer cells with mutations to reduce the likelihood of cancer cell proliferation. In the TIME, cancer cells escape from immune surveillance and proliferate rapidly, or called tumor escape [19]. Immunotherapy can restore immune response via blocking immune checkpoint receptors and their ligands, thus managing to reaccelerate immune-mediated destruction of tumor cells [19, 40]. The multicenter, phase 2 Keynote-059 study proved that the third-line pembrolizumab was effective in the treatment of advanced GC, in which the objective response rate was 60.0% for combination therapy and 25.8% for monotherapy [41]. The efficacy of nivolumab was ascertained by the ATTRACTION-2 trial, which extended the overall survival (12-month overall survival rates were 26.2% with nivolumab versus 10.9% with placebo) of advanced GC patients who had failed prior chemotherapy [42]. It has been well accepted that the ICI marker genes, PD-1 or CD274 (PD-L1), acts as important drug targets in cancer immunotherapy [43]. Other immune checkpoint-related genes as CD28, TGFBR1, and TNFSF4 (OX40L) have been frequently reported to engage in cancer immune regulation in ICI research [44–46]. Our findings demonstrated that CD274 (PD-L1), CD28, TGFBR1, and TNFSF4 expressions expression were elevated in high-risk GC patients compared to low-risk controls. Therefore, this model can bring immunotherapeutic benefits to patients at higher risk of advanced GC.
Limitations of this study incorporate an insufficient sample size and a lack of validation using data from our center. For external validation, we initially included a validation cohort from GEO, which failed to fully cover the autophagy-related lncRNA pairs selected for risk model construction, so this cohort was removed. Our future study will center on clinical validations of this model in GC, which may provide strong results for its application in a timely manner.
Conclusions
Our findings demonstrate a robust prognostic model based on nine autophagy-related lncRNA pairs for GC. It acts as an independent predictor for survival and efficacy prediction in GC patients receiving immunotherapy or chemotherapy. Our conclusion and the feasibility of the risk model require more accurate validation in future large-sample studies.
Materials and Methods
Internal validation of the risk model
We compared survival differences between low- and high-risk groups using Kaplan-Meier survival analysis. Comparisons of prediction performances of the model with other clinicopathological prognostic indicators were performed using a multi-index ROC-based methodology. Their differences were determined using the Chi-square test, marked with asterisks, and visualized in heatmaps. The survival, survivalROC, ggpubr, and pHeatmap packages in R language were used [48].
Tumor-infiltrating immune cell landscape between the two risk groups
We used TIMER (http://cistrome.dfci.harvard.edu/TIMER/), XCELL (https://xcell.ucsf.edu/), QUANTISEQ, MCPCOUNTER, EPIC, CIBERSORT-ABS, and CIBERSORT algorithms [29] to assess differences in immune cell subpopulations between low- and high-risk groups. Their differences were compared using the Wilcoxon signed-rank test.
Drug sensitivity analysis of immune checkpoint inhibitors (ICIs) and chemotherapy agents in GC
We were very interested in characterizing the sensitivity to commonly used ICIs and chemotherapy agents in low- and high-risk GC patients. Common chemotherapy agents (i.e., bexarotene, bicalutamide, bortezomib, bryostatin, and rapamycin) were selected for analysis. Differences in 50% inhibitory concentration (IC50) were compared between the two risk groups using Wilcoxon signed-rank test, and the results were visualized with pRophetic and ggplot 2 in R. As several chemotherapy agents have been proven ineffective for advanced GC patients, they are being replaced by the use of immunotherapy agents, particularly the most promising ICIs. We compared differences in expression levels of ICI marker genes, and the results were visualized in violin plots using the ggpubr package in R.
Statistical analyses
All statistical analyses were performed in software R (Version 4.0.2). The differential expression of autophagy-related lncRNAs was determined using the limma package in R at the false discovery rate (FDR) < 0.05 and log2 fold change (FC) > 2. Expression data of the autophagy-related lncRNA pairs and patient survival data were integrated using the limma package and subject to univariate Cox combined with LASSO regression analysis. Gene pairs with a P < 0.01 were selected. Prognostic factors associated with GC risk were identified using univariate and multivariate Cox regression analysis to determine whether the model could be considered an independent prognostic indicator for GC. The survival curves between low- and high-risk groups, predicted by the model were plotted using Kaplan-Meier survival analysis. Comparisons of clinicopathological features between the two risk groups were evaluated using the Wilcoxon signed-rank test, with the significance level set at P-value < 0.05.
Author Contributions
LG conceived and designed the study and wrote the manuscript. LG, JX and XL performed the analysis and prepared figures and tables. LC, RW and LL helped to analyze the data and revised the manuscript. All authors approved the final version of the manuscript.
Conflicts of Interest
The authors have declared that no conflicts of interest exist.
References
- 1. Smyth EC, Nilsson M, Grabsch HI, van Grieken NC, Lordick F. Gastric cancer. Lancet. 2020; 396:635–48. https://doi.org/10.1016/S0140-6736(20)31288-5 [PubMed]
- 2. Karimi P, Islami F, Anandasabapathy S, Freedman ND, Kamangar F. Gastric cancer: descriptive epidemiology, risk factors, screening, and prevention. Cancer Epidemiol Biomarkers Prev. 2014; 23:700–13. https://doi.org/10.1158/1055-9965.EPI-13-1057 [PubMed]
- 3. Chen W, Zheng R, Baade PD, Zhang S, Zeng H, Bray F, Jemal A, Yu XQ, He J. Cancer statistics in China, 2015. CA Cancer J Clin. 2016; 66:115–32. https://doi.org/10.3322/caac.21338 [PubMed]
- 4. Feng RM, Zong YN, Cao SM, Xu RH. Current cancer situation in China: good or bad news from the 2018 Global Cancer Statistics? Cancer Commun (Lond). 2019; 39:22. https://doi.org/10.1186/s40880-019-0368-6 [PubMed]
- 5. Park R, Williamson S, Kasi A, Saeed A. Immune Therapeutics in the Treatment of Advanced Gastric and Esophageal Cancer. Anticancer Res. 2018; 38:5569–80. https://doi.org/10.21873/anticanres.12891 [PubMed]
- 6. Parzych KR, Klionsky DJ. An overview of autophagy: morphology, mechanism, and regulation. Antioxid Redox Signal. 2014; 20:460–73. https://doi.org/10.1089/ars.2013.5371 [PubMed]
- 7. Saha S, Panigrahi DP, Patil S, Bhutia SK. Autophagy in health and disease: A comprehensive review. Biomed Pharmacother. 2018; 104:485–95. https://doi.org/10.1016/j.biopha.2018.05.007 [PubMed]
- 8. Ahn CH, Jeong EG, Lee JW, Kim MS, Kim SH, Kim SS, Yoo NJ, Lee SH. Expression of beclin-1, an autophagy-related protein, in gastric and colorectal cancers. APMIS. 2007; 115:1344–49. https://doi.org/10.1111/j.1600-0463.2007.00858.x [PubMed]
- 9. Kang MR, Kim MS, Oh JE, Kim YR, Song SY, Kim SS, Ahn CH, Yoo NJ, Lee SH. Frameshift mutations of autophagy-related genes ATG2B, ATG5, ATG9B and ATG12 in gastric and colorectal cancers with microsatellite instability. J Pathol. 2009; 217:702–06. https://doi.org/10.1002/path.2509 [PubMed]
- 10. Wang X, Wu WK, Gao J, Li Z, Dong B, Lin X, Li Y, Li Y, Gong J, Qi C, Peng Z, Yu J, Shen L. Autophagy inhibition enhances PD-L1 expression in gastric cancer. J Exp Clin Cancer Res. 2019; 38:140. https://doi.org/10.1186/s13046-019-1148-5 [PubMed]
- 11. Kim TW, Lee SJ, Kim JT, Kim SJ, Min JK, Bae KH, Jung H, Kim BY, Lim JS, Yang Y, Yoon DY, Choe YK, Lee HG. Kallikrein-related peptidase 6 induces chemotherapeutic resistance by attenuating auranofin-induced cell death through activation of autophagy in gastric cancer. Oncotarget. 2016; 7:85332–48. https://doi.org/10.18632/oncotarget.13352 [PubMed]
- 12. Fazal FM, Chang HY. lncRNA Structure: Message to the Heart. Mol Cell. 2016; 64:1–2. https://doi.org/10.1016/j.molcel.2016.09.030 [PubMed]
- 13. Jathar S, Kumar V, Srivastava J, Tripathi V. Technological Developments in lncRNA Biology. Adv Exp Med Biol. 2017; 1008:283–323. https://doi.org/10.1007/978-981-10-5203-3_10 [PubMed]
- 14. Charles Richard JL, Eichhorn PJ. Platforms for Investigating LncRNA Functions. SLAS Technol. 2018; 23:493–506. https://doi.org/10.1177/2472630318780639 [PubMed]
- 15. Chen JF, Wu P, Xia R, Yang J, Huo XY, Gu DY, Tang CJ, De W, Yang F. STAT3-induced lncRNA HAGLROS overexpression contributes to the malignant progression of gastric cancer cells via mTOR signal-mediated inhibition of autophagy. Mol Cancer. 2018; 17:6. https://doi.org/10.1186/s12943-017-0756-y [PubMed]
- 16. Wu Q, Ma J, Wei J, Meng W, Wang Y, Shi M. lncRNA SNHG11 Promotes Gastric Cancer Progression by Activating the Wnt/β-Catenin Pathway and Oncogenic Autophagy. Mol Ther. 2021; 29:1258–78. https://doi.org/10.1016/j.ymthe.2020.10.011 [PubMed]
- 17. Xi Z, Si J, Nan J. LncRNA MALAT1 potentiates autophagy-associated cisplatin resistance by regulating the microRNA-30b/autophagy-related gene 5 axis in gastric cancer. Int J Oncol. 2019; 54:239–48. https://doi.org/10.3892/ijo.2018.4609 [PubMed]
- 18. Wang M, Li Z, Peng Y, Fang J, Fang T, Wu J, Zhou J. Identification of immune cells and mRNA associated with prognosis of gastric cancer. BMC Cancer. 2020; 20:206. https://doi.org/10.1186/s12885-020-6702-1 [PubMed]
- 19. Refolo MG, Lotesoriere C, Messa C, Caruso MG, D’Alessandro R. Integrated immune gene expression signature and molecular classification in gastric cancer: New insights. J Leukoc Biol. 2020; 108:633–46. https://doi.org/10.1002/JLB.4MR0120-221R [PubMed]
- 20. Li X, Jin F, Li Y. A novel autophagy-related lncRNA prognostic risk model for breast cancer. J Cell Mol Med. 2021; 25:4–14. https://doi.org/10.1111/jcmm.15980 [PubMed]
- 21. Sun Z, Jing C, Xiao C, Li T. An autophagy-related long non-coding RNA prognostic signature accurately predicts survival outcomes in bladder urothelial carcinoma patients. Aging (Albany NY). 2020; 12:15624–37. https://doi.org/10.18632/aging.103718 [PubMed]
- 22. Digklia A, Wagner AD. Advanced gastric cancer: Current treatment landscape and future perspectives. World J Gastroenterol. 2016; 22:2403–14. https://doi.org/10.3748/wjg.v22.i8.2403 [PubMed]
- 23. Strong VE. Progress in gastric cancer. Updates Surg. 2018; 70:157–59. https://doi.org/10.1007/s13304-018-0543-3 [PubMed]
- 24. Radulescu D, Baleanu VD, Padureanu V, Radulescu PM, Bordu S, Patrascu S, Socea B, Bacalbasa N, Surlin MV, Georgescu I, Georgescu EF. Neutrophil/Lymphocyte Ratio as Predictor of Anastomotic Leak after Gastric Cancer Surgery. Diagnostics (Basel). 2020; 10:799. https://doi.org/10.3390/diagnostics10100799 [PubMed]
- 25. Matsuoka T, Yashiro M. Biomarkers of gastric cancer: Current topics and future perspective. World J Gastroenterol. 2018; 24:2818–32. https://doi.org/10.3748/wjg.v24.i26.2818 [PubMed]
- 26. Cao Y, Luo Y, Zou J, Ouyang J, Cai Z, Zeng X, Ling H, Zeng T. Autophagy and its role in gastric cancer. Clin Chim Acta. 2019; 489:10–20. https://doi.org/10.1016/j.cca.2018.11.028 [PubMed]
- 27. Quinn JJ, Chang HY. Unique features of long non-coding RNA biogenesis and function. Nat Rev Genet. 2016; 17:47–62. https://doi.org/10.1038/nrg.2015.10 [PubMed]
- 28. YiRen H, YingCong Y, Sunwu Y, Keqin L, Xiaochun T, Senrui C, Ende C, XiZhou L, Yanfan C. Long noncoding RNA MALAT1 regulates autophagy associated chemoresistance via miR-23b-3p sequestration in gastric cancer. Mol Cancer. 2017; 16:174. https://doi.org/10.1186/s12943-017-0743-3 [PubMed]
- 29. Liu J, Wu H, Gao Z, Lou M, Yuan K. Construction of an immune-related lncRNA pairs model to predict prognosis and immune landscape of lung adenocarcinoma patients. Bioengineered. 2021; 12:4123–35. https://doi.org/10.1080/21655979.2021.1953215 [PubMed]
- 30. Sveen A, Ågesen TH, Nesbakken A, Meling GI, Rognum TO, Liestøl K, Skotheim RI, Lothe RA. ColoGuidePro: a prognostic 7-gene expression signature for stage III colorectal cancer patients. Clin Cancer Res. 2012; 18:6001–10. https://doi.org/10.1158/1078-0432.CCR-11-3302 [PubMed]
- 31. Hansen UK, Ramskov S, Bjerregaard AM, Borch A, Andersen R, Draghi A, Donia M, Bentzen AK, Marquard AM, Szallasi Z, Eklund AC, Svane IM, Hadrup SR. Tumor-Infiltrating T Cells From Clear Cell Renal Cell Carcinoma Patients Recognize Neoepitopes Derived From Point and Frameshift Mutations. Front Immunol. 2020; 11:373. https://doi.org/10.3389/fimmu.2020.00373 [PubMed]
- 32. Ladányi A. Prognostic and predictive significance of immune cells infiltrating cutaneous melanoma. Pigment Cell Melanoma Res. 2015; 28:490–500. https://doi.org/10.1111/pcmr.12371 [PubMed]
- 33. Giraldo NA, Sanchez-Salas R, Peske JD, Vano Y, Becht E, Petitprez F, Validire P, Ingels A, Cathelineau X, Fridman WH, Sautès-Fridman C. The clinical role of the TME in solid cancer. Br J Cancer. 2019; 120:45–53. https://doi.org/10.1038/s41416-018-0327-z [PubMed]
- 34. Song J, Wu L. Friend or Foe: Prognostic and Immunotherapy Roles of BTLA in Colorectal Cancer. Front Mol Biosci. 2020; 7:148. https://doi.org/10.3389/fmolb.2020.00148 [PubMed]
- 35. Tamminga M, Hiltermann TJ, Schuuring E, Timens W, Fehrmann RS, Groen HJ. Immune microenvironment composition in non-small cell lung cancer and its association with survival. Clin Transl Immunology. 2020; 9:e1142. https://doi.org/10.1002/cti2.1142 [PubMed]
- 36. Song J, Deng Z, Su J, Yuan D, Liu J, Zhu J. Patterns of Immune Infiltration in HNC and Their Clinical Implications: A Gene Expression-Based Study. Front Oncol. 2019; 9:1285. https://doi.org/10.3389/fonc.2019.01285 [PubMed]
- 37. Choi AH, Kim J, Chao J. Perioperative chemotherapy for resectable gastric cancer: MAGIC and beyond. World J Gastroenterol. 2015; 21:7343–48. https://doi.org/10.3748/wjg.v21.i24.7343 [PubMed]
- 38. Hudler P. Challenges of deciphering gastric cancer heterogeneity. World J Gastroenterol. 2015; 21:10510–27. https://doi.org/10.3748/wjg.v21.i37.10510 [PubMed]
- 39. Marrelli D, Polom K, Pascale V, Vindigni C, Piagnerelli R, De Franco L, Ferrara F, Roviello G, Garosi L, Petrioli R, Roviello F. Strong Prognostic Value of Microsatellite Instability in Intestinal Type Non-cardia Gastric Cancer. Ann Surg Oncol. 2016; 23:943–50. https://doi.org/10.1245/s10434-015-4931-3 [PubMed]
- 40. Li Y, Wang C, Xu M, Kong C, Qu A, Zhang M, Zheng Z, Zhang G. Preoperative NLR for predicting survival rate after radical resection combined with adjuvant immunotherapy with CIK and postoperative chemotherapy in gastric cancer. J Cancer Res Clin Oncol. 2017; 143:861–71. https://doi.org/10.1007/s00432-016-2330-1 [PubMed]
- 41. Bang YJ, Kang YK, Catenacci DV, Muro K, Fuchs CS, Geva R, Hara H, Golan T, Garrido M, Jalal SI, Borg C, Doi T, Yoon HH, et al. Pembrolizumab alone or in combination with chemotherapy as first-line therapy for patients with advanced gastric or gastroesophageal junction adenocarcinoma: results from the phase II nonrandomized KEYNOTE-059 study. Gastric Cancer. 2019; 22:828–37. https://doi.org/10.1007/s10120-018-00909-5 [PubMed]
- 42. Kang YK, Boku N, Satoh T, Ryu MH, Chao Y, Kato K, Chung HC, Chen JS, Muro K, Kang WK, Yeh KH, Yoshikawa T, Oh SC, et al. Nivolumab in patients with advanced gastric or gastro-oesophageal junction cancer refractory to, or intolerant of, at least two previous chemotherapy regimens (ONO-4538-12, ATTRACTION-2): a randomised, double-blind, placebo-controlled, phase 3 trial. Lancet. 2017; 390:2461–71. https://doi.org/10.1016/S0140-6736(17)31827-5
- 43. Jiang Y, Chen M, Nie H, Yuan Y. PD-1 and PD-L1 in cancer immunotherapy: clinical implications and future considerations. Hum Vaccin Immunother. 2019; 15:1111–22. https://doi.org/10.1080/21645515.2019.1571892 [PubMed]
- 44. Wang S, Zhang X, Leng S, Xu Q, Sheng Z, Zhang Y, Yu J, Feng Q, Hou M, Peng J, Hu X. Immune Checkpoint-Related Gene Polymorphisms Are Associated With Primary Immune Thrombocytopenia. Front Immunol. 2021; 11:615941. https://doi.org/10.3389/fimmu.2020.615941 [PubMed]
- 45. Nuebling T, Schumacher CE, Hofmann M, Hagelstein I, Schmiedel BJ, Maurer S, Federmann B, Rothfelder K, Roerden M, Dörfel D, Schneider P, Jung G, Salih HR. The Immune Checkpoint Modulator OX40 and Its Ligand OX40L in NK-Cell Immunosurveillance and Acute Myeloid Leukemia. Cancer Immunol Res. 2018; 6:209–21. https://doi.org/10.1158/2326-6066.CIR-17-0212 [PubMed]
- 46. Trebska-McGowan K, Chaib M, Alvarez MA, Kansal R, Pingili AK, Shibata D, Makowski L, Glazer ES. TGF-β Alters the Proportion of Infiltrating Immune Cells in a Pancreatic Ductal Adenocarcinoma. J Gastrointest Surg. 2021. [Epub ahead of print]. https://doi.org/10.1007/s11605-021-05087-x [PubMed]
- 47. Yang Z, Zi Q, Xu K, Wang C, Chi Q. Development of a macrophages-related 4-gene signature and nomogram for the overall survival prediction of hepatocellular carcinoma based on WGCNA and LASSO algorithm. Int Immunopharmacol. 2021; 90:107238. https://doi.org/10.1016/j.intimp.2020.107238 [PubMed]
- 48. Fang Y, Huang S, Han L, Wang S, Xiong B. Comprehensive Analysis of Peritoneal Metastasis Sequencing Data to Identify LINC00924 as a Prognostic Biomarker in Gastric Cancer. Cancer Manag Res. 2021; 13:5599–611. https://doi.org/10.2147/CMAR.S318704 [PubMed]