


Introduction
Worldwide, lung cancer cases and deaths are increasing. In 2018, GLOBOCAN [1] estimated that there were 2.09 million new cases (11.6% of the total number of cancer cases) and 1.76 million deaths (18.4% of the total number of cancer deaths), which is higher than the rate reported in 2012 (1.8 million new cases and 1.6 million deaths), making it the most common cause of cancer and cancer deaths in both men and women [2]. Lung cancer includes multiple subtypes, and the proportion of lung adenocarcinoma (LUAD) has increased in recent years. Despite significant advances in chemotherapy and molecular targeted therapy, the survival rate of LUAD remains unsatisfactory. Tumor recurrence and metastasis are major challenges in the clinical treatment of LUAD [3]. To improve the prognosis of patients with LUAD, more targeted molecules should be identified to diagnose, treat, and determine the prognosis of patients. We suggest that ARHGAP30 might have potential as a new targeting molecule.
The Rho protein family belongs to the small GTP-binding proteins of the Ras superfamily (including the Ras, Rho, Rab, Ran, and Rrf families), which have a molecular weight between 20 and 30 kDa and control numerous signal transduction pathways as molecular switches in eukaryotic cells [4]. Rho proteins act as signal converters in the signal transduction pathway of cells, acting on the cytoskeleton or target proteins, and produce a variety of biological effects [5]. Rho GTPase activating protein 30 (ARHGAP30), a Rho-specific Rho GAP, has been reported to enhance the intrinsic hydrolysis of GTP and might regulate Rho GTPase negatively [6].
Recent studies have demonstrated a close relationship between Rho-GTPases and the development and metastasis of various human tumors [7]. In some studies on the relationship between ARHGAP30 and cancer, upregulation of ARHGAP30 attenuated pancreatic cancer progression by inactivating the β-catenin pathway [8]. In addition, ARHGAP30 promotes p53 acetylation and function in colorectal cancer [9]. However, whether there is a difference in the expression of ARHGAP30 in LUAD, a relationship between the expression of ARHGAP30 in LUAD and DNA methylation, and whether these affect patient’s prognosis, survival, and tumor immune infiltration, are unclear and require further study.
This present study aimed to investigate the differential expression of ARHGAP30 between LUAD tissues and normal tissues and the relationship between ARHGAP30 expression and DNA methylation in LUAD. The role of ARHGAP30 expression in the prognosis and survival of patients with LUAD was studied. In addition, gene set enrichment analysis (GSEA) of ARHGAP30 was performed using various bioinformatic analyses, including Kyoto Encyclopedia of Genes and Genomes (KEGG) pathways, Panther pathways, Reactome pathways, Wikipathways, Gene ontology (GO; biological process, cellular component, and molecular function), Kinase Target Network, Transcription Factor Network, and a protein-protein interaction (PPI) network in the Biological General Repository for Interaction Datasets (BI-OGRID). The association of ARHGAP30 expression with tumor-infiltrating lymphocytes (TILs), immunostimulators, major histocompatibility complex (MHC) molecules, chemokines, and chemokine receptors in LUAD tissues were also analyzed. We believe that ARHGAP30 can be developed as a new biomarker for LUAD. The study of ARHGAP30-associated immune infiltration will provide a new direction for immunotherapy of lung adenocarcinoma.
Results
Differential expression of the ARHGAP30 mRNA and protein in LUAD tissues and normal tissues
Figure 1A shows a summary view of the different transcriptional levels of ARHGAP30 in various cancers in the Oncomine [10] database. The red line in the figure shows that the expression level of ARHGAP30 in lung cancer tissue was significantly lower than that in normal tissue. Figure 1B1–1B6 show that the mRNA expression levels of ARHGAP30 were considerably higher in LUAD than in normal tissue. Figure 1B1–1B3 show the fold change, associated p-values, and overexpression Gene Rank, based on Oncomine 4.5 analysis [10], including box plots of ARHGAP30 mRNA levels in the Hou Lung, Selamat Lung, and Okayama Lung datasets. Figure 1B4, 1B5 show the expression of ARHGAP30 in LUAD based on SurvExpress [11] analysis. Figure 1 (B6) shows the expression of ARHGAP30 in LUAD based on GEPIA [12]. P values as described in the figure are statistically significant. According to analysis at the Warner [13] database, the abundance of the different exons of the ARHGAP30 gene show an uneven balance between normal and tumor tissues in patients with LUAD (Figure 2A). Figure 2A1 shows the expression of ARHGAP30 in normal tissues (n = 58) and Figure 2A2 shows the expression of ARHGAP30 in tumor tissues (n = 488). The data shown in Figure 2A4, 2A5 indicates that ARHGAP30 expression correlated negatively with the level of DNA methylation.
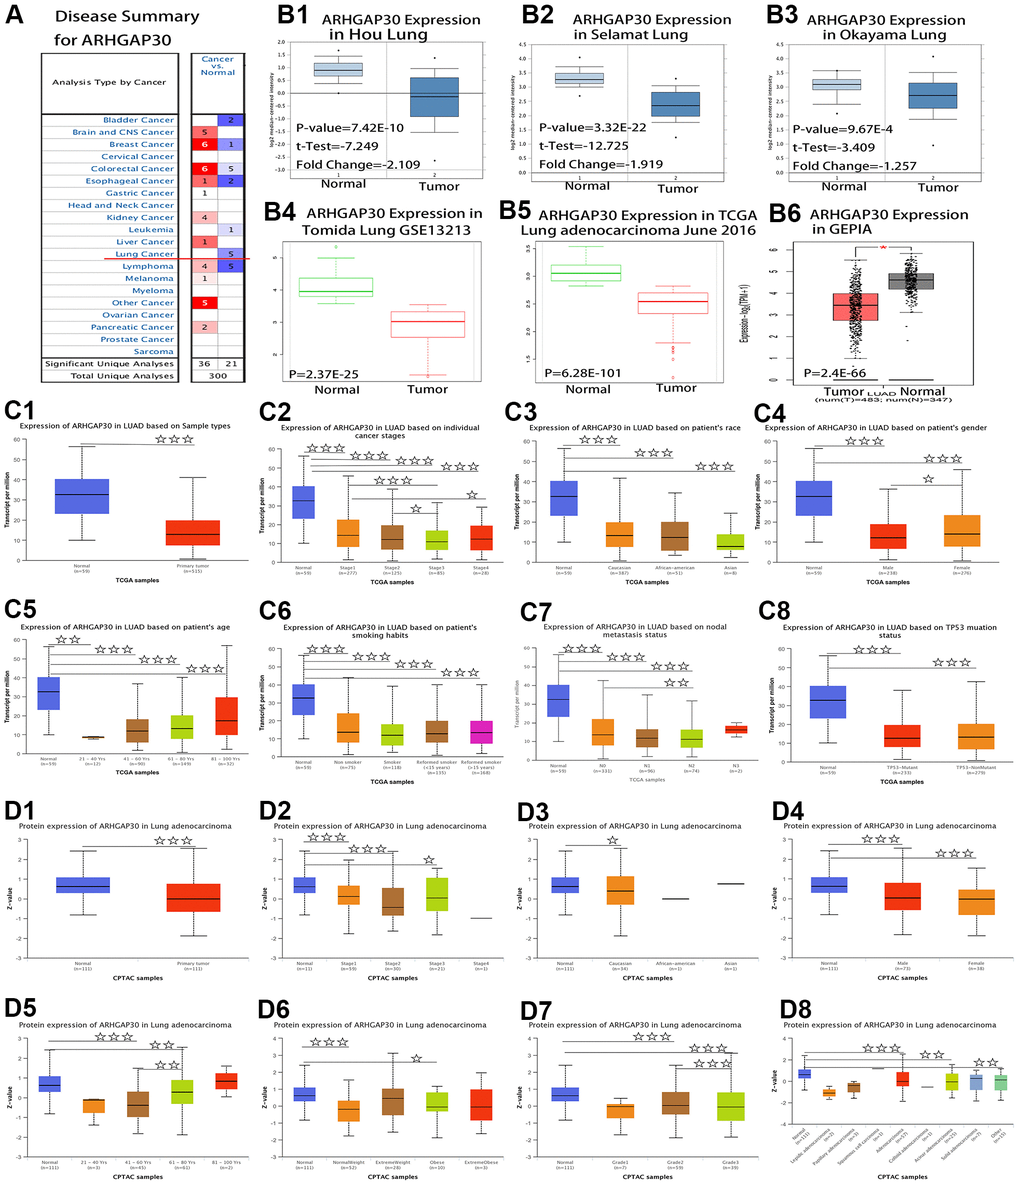
Figure 1. Comparison of mRNA and protein expression of ARHGAP30 in lung cancer tissues and normal tissues. (A) Summary view of ARHGAP30. The transcription level of ARHGAP30 in different types of cancer. P-value < 0.05, Note: The Z-score standardizes the color to describe the relative value in the row. Among them, red indicates overexpression or copy acquisition of genes in the analysis; blue indicates low expression or copy loss of genes in these analyses. Datasets comprised samples represented as microarray data measuring mRNA expression in primary tumors, cell lines, or xenografts. (B) Transcription of ARHGAP30 in lung adenocarcinoma (from Oncomine, SurvExpress, and GEPIA databases). mRNA expression levels of ARHGAP30 were significantly higher in lung adenocarcinoma than in normal tissue. (B1–B3) The fold change, associated p-values, and overexpression Gene Rank, based on Oncomine 4.5 analysis. Box plots show ARHGAP30 mRNA levels in the Hou Lung, Selamat Lung, and Okayama Lung datasets. (B4, B5) The expression of ARHGAP30 in LUAD based on SurvExpress analysis; (B6) The expression of ARHGAP30 in LUAD based on GEPIA analysis; P values as described in the figure are statistically significant. (C) ARHGAP30 transcription in subgroups of patients with lung adenocarcinoma, stratified based on sex, age, and other criteria (UALCAN). (C1) Sample types. (C2) Individual cancer stages. (C3) Ethnicity. (C4) Sex. (C5) Age. (C6) Smoking habits. (C7) Nodal metastasis status. (C8) TP53 mutation status. ☆, P < 0.05; ☆☆, P < 0.01; ☆☆☆, P < 0.001. (D) Differential abundance of the ARHGAP30 protein in patients with lung adenocarcinoma, stratified by sex, age, and other criteria. (D1) Sample types. (D2) Individual cancer stages. (D3) Ethnicity. (D4) Sex. (D5) Age. (D6) Weight. (D7) Tumor grade. (D8) Tumor histology. ☆, P < 0.05; ☆☆, P < 0.01; ☆☆☆, P < 0.001.
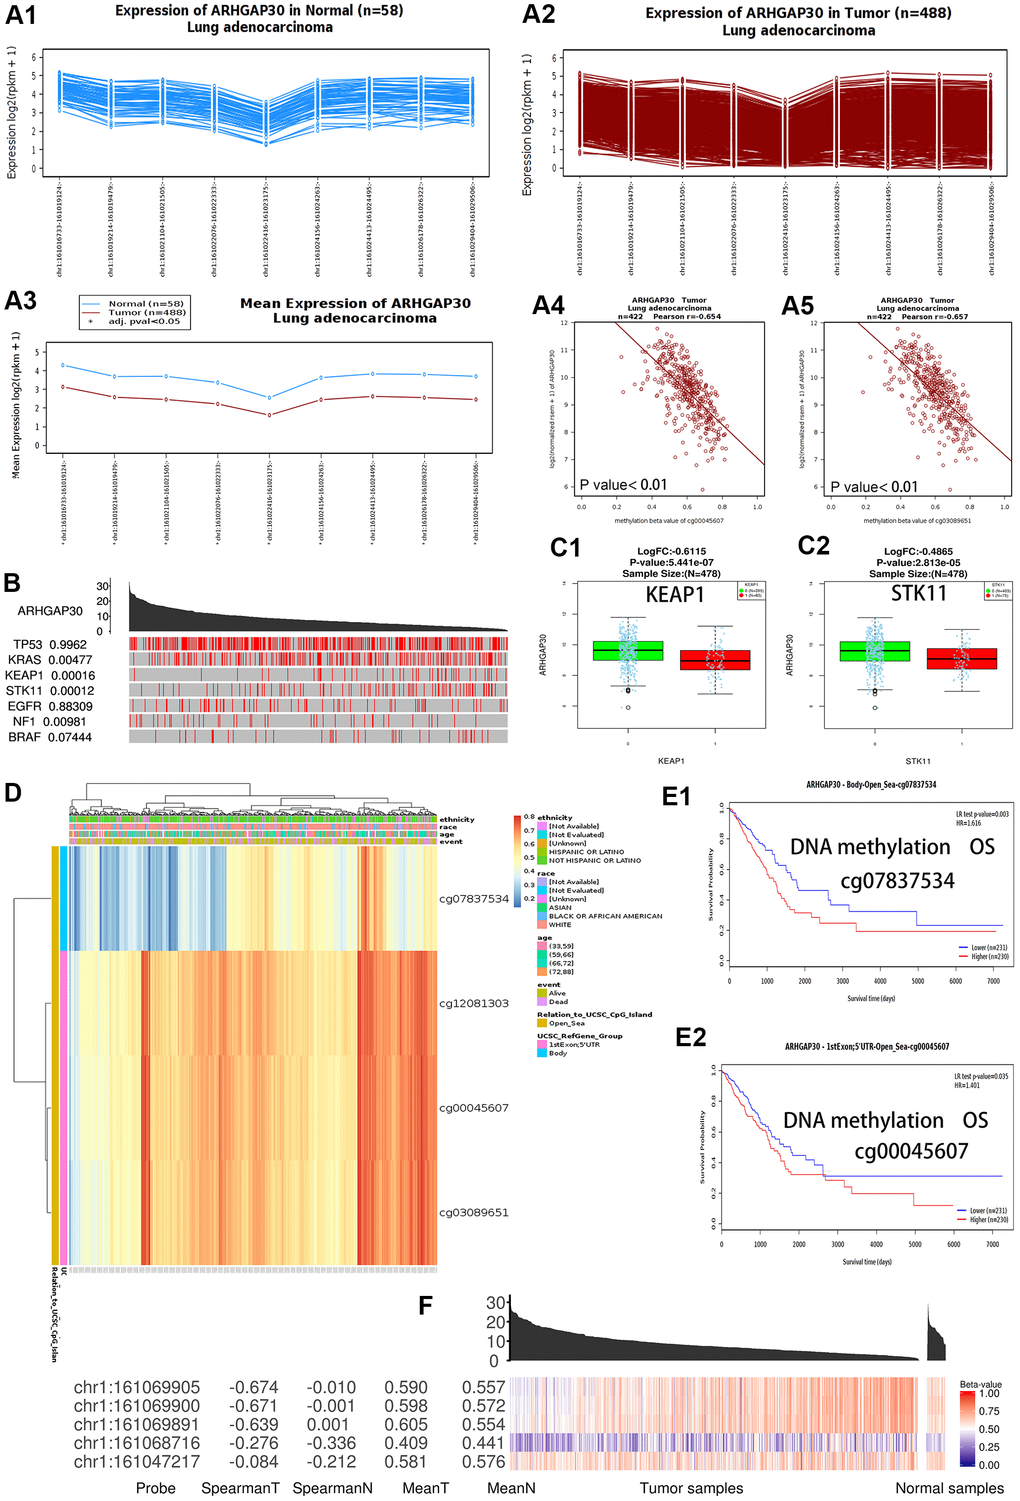
Figure 2. DNA methylation and the differential expression of ARHGAP30 between lung adenocarcinoma and normal tissues. (A) The abundance of the different exons of the ARHGAP30 gene shows an uneven balance in normal and tumor tissues in patients with lung adenocarcinoma according to the Wanderer database. (A1) Expression of ARHGAP30 in normal tissues (n = 58); (A2) Expression of ARHGAP30 in tumor tissues (n = 488); (A3) Comparison of the mean expression of ARHGAP30 between normal tissue and lung adenocarcinoma tissue. (A4, A5) The expression of ARHGAP30 correlated negatively with the level of DNA methylation. (B) Highly mutated genes and the expression of ARHGAP30 in the TCGAportal database. The value adjacent to the highly mutated gene is the permutation test p-value of gene expression between the driver mutated (red) and not-mutated (gray) samples. (C1, C2) Box plots of the mRNA expression of ARHGAP30 in lung adenocarcinoma before and after mutation of highly mutated genes (KEAP1, STK11) in the Linkedomics database. (D) Heat map of ARHGAP30 methylation in lung adenocarcinoma. (E1, E2) Kaplan–Meier plots of the survival of patients with lung adenocarcinoma with different ARHGAP30 DNA methylation levels (Different methylation probes cg07837534 and cg00045607 in the MethSurv database). (F) Gene expression and methylation of ARHGAP30 in samples of primary tumors and solid tissues analyzed at the TCGAportal database. Spearman T: Spearman correlation between expression and methylation in primary tumor samples. Spearman N: Spearman correlation between expression and methylation in solid tissue standard samples. Mean T: Mean value of the methylation beta-value in primary tumor samples. Mean N: Mean value of methylation in normal solid tissue samples.
Differential expression of ARHGAP30 mRNA in LUAD tissues and normal tissues
Figure 1C shows mRNA expression levels of ARHGAP30 in subgroups of patients with LUAD, stratified based on sample type, individual cancer stage, ethnicity, sex, age, smoking habit, nodal metastasis status, and TP53 mutation status (UALCAN [14]). The P-value of the comparison between each is shown in Supplementary Table 1. Figure 1C1 shows a significant difference between normal tissue and lung adenocarcinoma tissue (P < 0.001). Figure 1C2–1C8 show that in addition to the differential expression between tumor tissues and normal tissues, there were statistically significant differences between Stage 1 and Stage 3, Stage 1 and Stage 4, Stage 2 and Stage 3, male and female, and N0 and N2.
Differential abundance of the ARHGAP30 protein in LUAD tissues and normal tissues
Figure 1D shows the protein levels of ARHGAP30 in subgroups of patients with LUAD, stratified based on sample type, individual cancer stage, ethnicity, sex, age, weight, tumor grade, and tumor histology (assessed using UALCAN [14] and CPTAC [15]). The P-value of the comparison between each is shown in Supplementary Table 2. Figure 1D1 shows a significant difference between normal tissue and LUAD tissue (P < 0.001). Figure 1D1–1D8 show that in addition to the differential abundance between tumor tissues and normal tissues, there were statistically significant differences between age 41–60 years and 61–80 years; and Grade 2 and Grade 3.
Effect of mutations in common hypermutated genes and DNA methylation of ARHGAP30 on the expression of ARHGAP30 in lung adenocarcinoma versus normal tissues
The location of ARHGAP30 methylation in the lung adenocarcinoma cases was on chromosome 1, 161015000 to 161,069905. Figure 2B shows that ARHGAP30 expression was affected by some highly mutated genes in the analysis using the TCGAportal [16] database. Among them, KRAS (encoding KRAS proto-oncogene, GTPase), KEAP1 (encoding kelch like ECH associated protein 1), STK11 (encoding serine/threonine kinase 11), and NF1 (encoding neurofibromin 1) genes had statistically significant P values. Figure 2C1, 2C2 show that ARHGAP30 mRNA expression in LUAD was significantly lower than that in normal tissues after mutation of highly mutated genes (KEAP1 and STK11) in the Linkedomics [17] database. These results indicate that mutations in KEAP1 and STK11 significantly reduce ARHGAP30 gene expression and affect LUAD development.
Figure 2D shows a heatmap of ARHGAP30 DNA methylation (using four probes: cg07837534, cg12081303, cg00045607, cg03089651) in LUAD based on analysis at the Methsurv [18] database, which showed that ARHGAP30 DNA methylation levels were markedly increased in LUAD. A Kaplan–Meier map for patients with LUAD with different levels of ARHGAP30 DNA methylation showed that patients with hypomethylation had a statistically significant better survival prognosis (Figure 2E1, 2E2) [18]. The Spearman correlation between expression and methylation in primary tumor samples was significantly higher than the Spearman correlation between expression and methylation in normal samples of solid tissues (Figure 2F) [16].
Prediction of the prognosis of patients with LUAD according to ARHGAP30 mRNA levels
We found that the prognosis of patients with LUAD with high ARHGAP30 mRNA expression levels was significantly better than that of patients with low ARHGAP30 mRNA expression levels, as demonstrated by the 12 overall survival curves shown in Figure 3 (all P < 0.01). Figure 3A1, 3A2 represent the two overall survival curves from the GEPIA [12] database; Figure 3C–3J represent the eight overall survival curves from the Oncolnc [19], Ualcan [14], UCSC [20], TCGA portal [16], TISIDB [21], KMplot [22], TIMER [23], and Linkedomics [17] databases. The two survival curves in Figure 3K1, 3K2 represent the overall survival curves from the PrognoScan [24] database. Figure 3B1, 3B2 show two disease-free survival curves from the GEPIA database, which indicate that the prognosis of patients with LUAD with high expression of ARHGAP30 mRNA was significantly higher than that of patients with low expression of ARHGAP30 mRNA (P < 0.01). The two survival curves in Figure 3L1, 3L2 represent recurrence-free survival curves from the PrognoScan [24] database), which show that the prognosis of patients with LUAD with high expression of ARHGAP30 mRNA were significantly higher than that of patients with low expression of ARHGAP30 mRNA (P < 0.05).
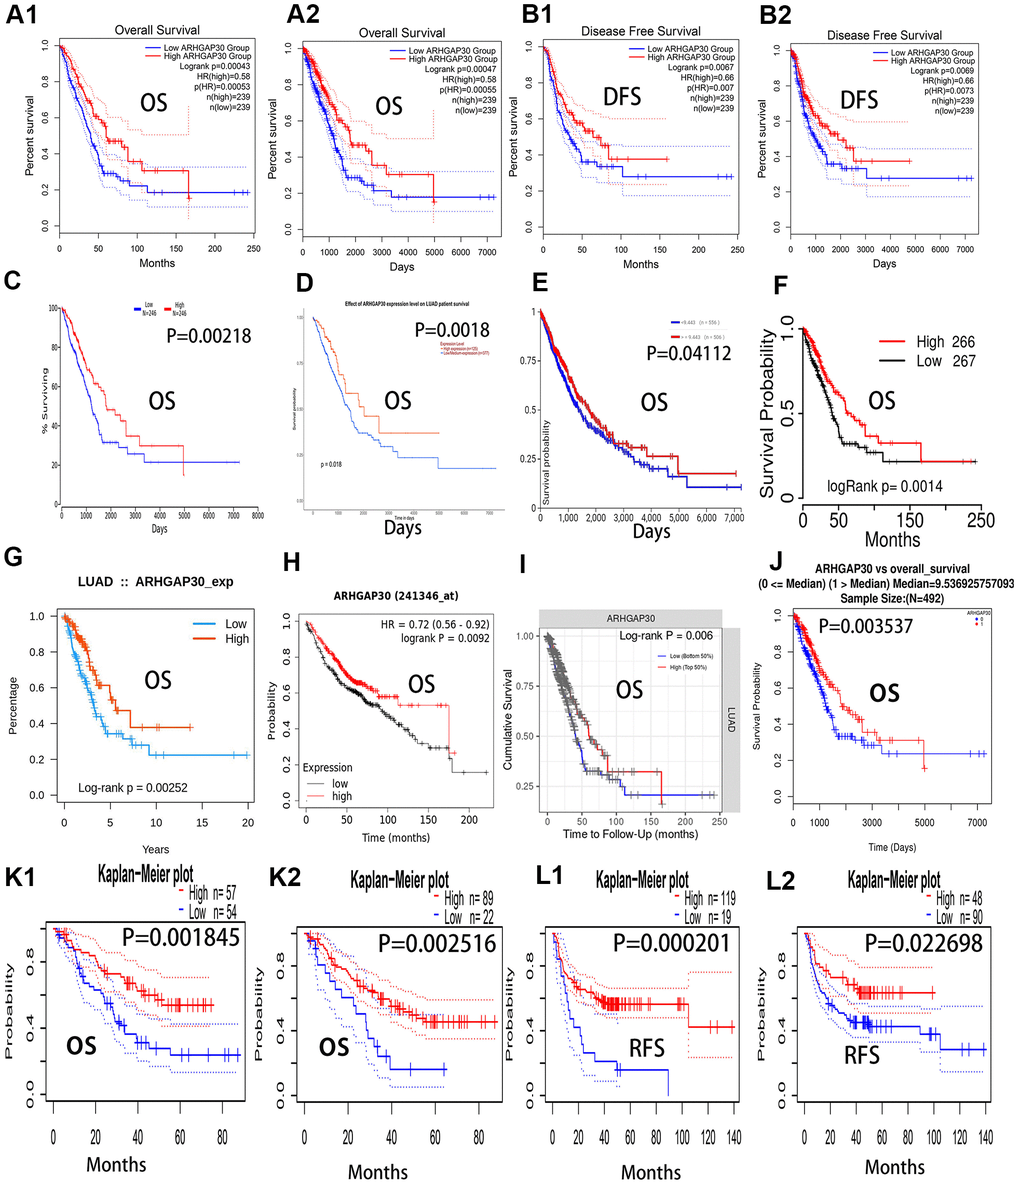
Figure 3. Overall survival curves, recurrence-free survival curves, and disease-free survival curves of ARHGAP30 in lung adenocarcinoma. The blue curves represent patients with lung adenocarcinoma with low ARHGAP30 expression, and the red curves represent patients with lung adenocarcinoma with high ARHGAP30 expression. (A1, A2) Two overall survival curves (in months and days, respectively) from the GEPIA database; (B1, B2) Two disease-free survival (DFS) curves for ARHGAP30 in the GEPIA database (in months and days, respectively). (C–J) Eight overall survival curves from the databases of Oncolnc, Ualcan, UCSC, TCGAportal, TISIDB, KMplot, TIMER, and Linkedomics, respectively. (K1, K2) Two survival curves representing the overall survival curves from the PrognoScan database. (L1, L2) Two survival curves representing recurrence-free survival curves from the PrognoScan database.
Genes, miRNAs, and lncRNAs correlated highly with ARHGAP30 in lung adenocarcinoma
We analyzed the genes and microRNAs (miRNAs) that correlated with ARHGAP30 based on the Linkedomics [17] database. Figure 4A shows a volcano plot of genes that correlated highly with ARHGAP30 in LUAD. Figure 4B shows a heatmap of genes that correlated highly and positively with ARHGAP30 in LUAD. Figure 4C shows a heatmap of genes that correlated highly and negatively with ARHGAP30 in LUAD. Figure 4D1–4D18 show scatter plots of the top 18 genes that correlated positively with ARHGAP30 in LUAD: ITGAL, DOCK2, MYO1F, SNX20, IL10RA, SASH3, IKZF1, NCKAP1L, SPN, CSF2RB, FAM78A, WAS, ARHGAP25, PIK3R5, CD37, FGD2, PTPRC, and CYTH4. Figure 4E1–4E18 show scatter plots of the top 18 genes that correlated negatively with ARHGAP30 in LUAD: SNRPE, HSPE1, DPY30, PSMB5, TMEM223, MRPS18A, PFDN6, C15orf63, YWHAE, APOA1BP, ACP1, TMEM9, TMEM183A, ILF2, SRP9, FBXO22OS, SF3B14, and CCT3.
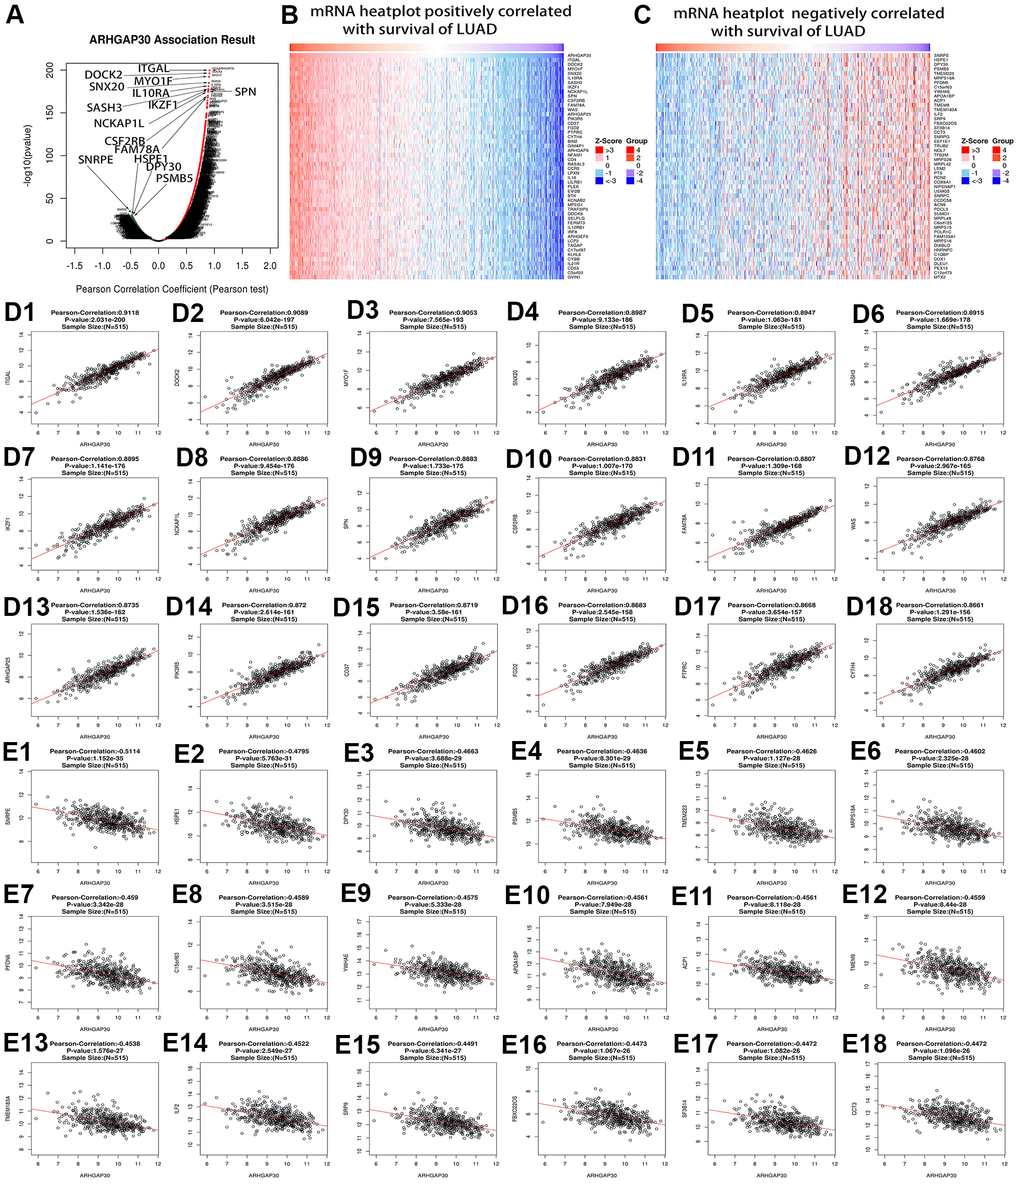
Figure 4. Genes that correlated highly with ARHGAP30 in lung adenocarcinoma (LUAD). (A) Volcano map of ARHGAP30-correlated genes in LUAD, the red dots on the right represent the positively related genes, and the green dots on the left represent the negatively related genes. (B, C) Heat maps showing the genes that correlated positively and negatively with ARHGAP30 in LUAD (top 50). Red indicates positively correlated genes; green indicates negatively correlated genes. (D1–D18) Scatter plots of the first 18 genes that correlated positively with ARHGAP30 in LUAD. (E1–E18) Scatter plots of the first 18 genes that correlated negatively with ARHGAP30 in LUAD.
Figure 5A shows a volcano plot of miRNAs that correlated highly with ARHGAP30 in LUAD. Figure 5B shows a heatmap of miRNAs that correlated highly and positively with ARHGAP30 in LUAD. Figure 5C shows a heatmap of miRNAs that correlated highly and negatively with ARHGAP30 in LUAD. Figure 5D1–5D18 show scatter plots of the top 18 miRNAs that correlated positively with ARHGAP30 in LUAD: hsa-mir-150, hsa-mir-155, hsa-mir-146a, hsa-mir-511-1, hsa-mir-140, hsa-mir-142, hsa-mir-342, hsa-mir-511-2, hsa-mir-146b, hsa-mir-598, hsa-mir-378, hsa-mir-101-2, hsa-mir-133a-1, hsa-mir-1976, hsa-mir-218-2, hsa-mir-29c, hsa-mir-139, and hsa-mir-223. Figure 5E1–5E18 show scatter plots of the top 18 mRNAs that corelated negatively with ARHGAP30 in LUAD: hsa-mir-183, hsa-mir-182, hsa-mir-877, hsa-mir-1276, hsa-mir-3691, hsa-mir-151, hsa-mir-96, hsa-mir-760, hsa-mir-18b, hsa-mir-130b, hsa-mir-1254, hsa-mir-556, hsa-mir-200c, hsa-mir-421, hsa-mir-301b, hsa-mir-106b, hsa-mir-1266 and hsa-mir-561.
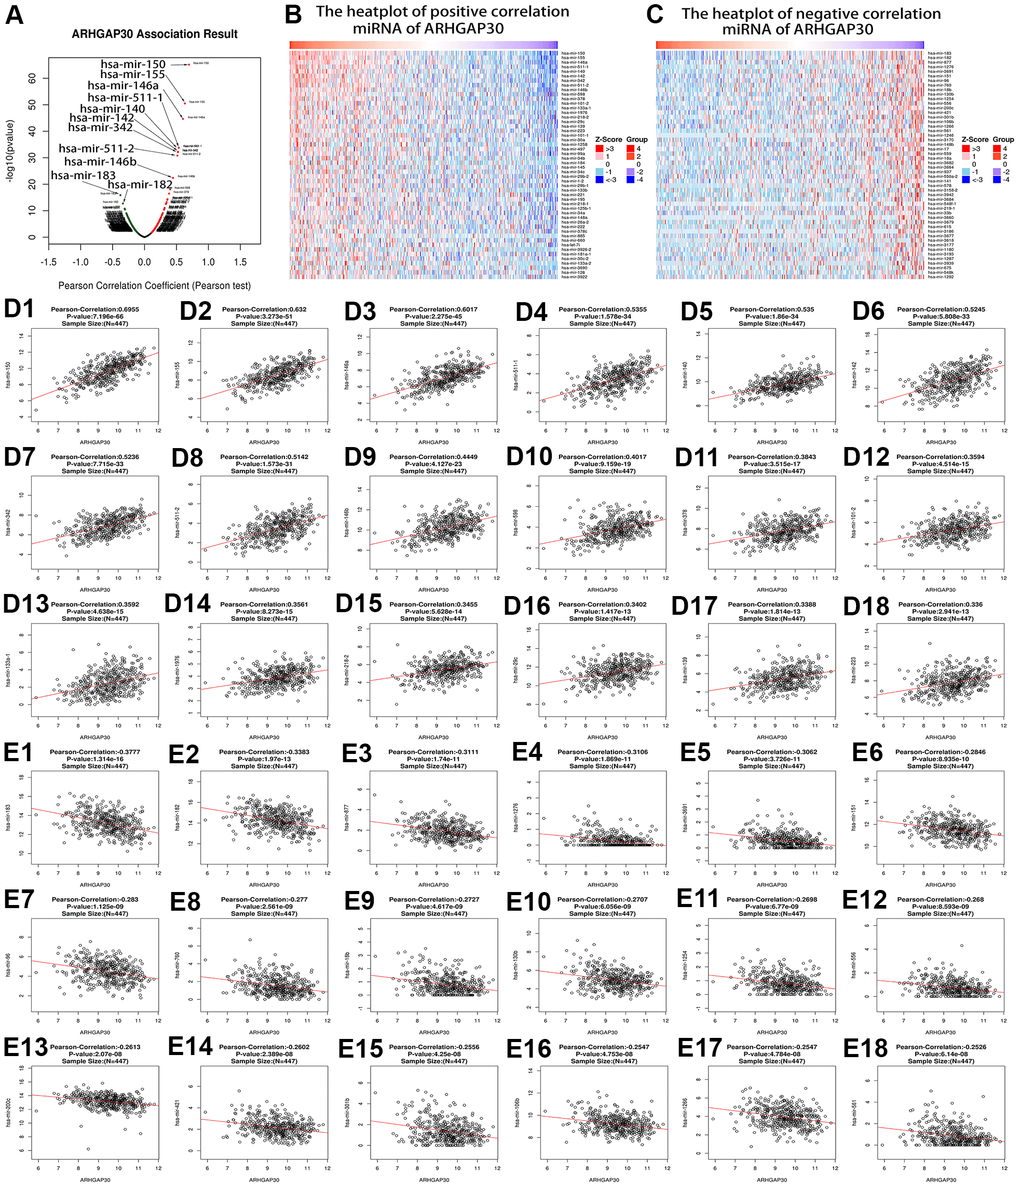
Figure 5. MiRNAs correlated highly with ARHGAP30 in lung adenocarcinoma (LUAD). (A) Volcano map of ARHGAP30-correlated miRNAs in LUAD, the red dots on the right represent the positively associated miRNAs, and the green dots on the left represent the negatively associated miRNAs. (B, C) Heat maps showing the miRNAs that correlated positively and negatively with ARHGAP30 in LUAD (top 50). Red indicates positively correlated miRNAs; green indicates negatively correlated miRNAs. (D1–D18) Scatter plots of the first 18 miRNAs that correlated positively with ARHGAP30 in LUAD. (E1–E18) Scatter plots of the first 18 miRNAs that correlated negatively with ARHGAP30 in LUAD.
We analyzed the long noncoding RNAs (lncRNAs) that correlated with ARHGAP30 based on the TANRIC [25] database. Figure 6A1–6A20 show scatter plots of lncRNAs that are highly and positively correlated with ARHGAP30 in LUAD: ENSG00000257824.1, ENSG00000268802.1, ENSG00000261644.1, ENSG00000255197.1, ENSG00000267074.1, ENSG00000233038.1, ENSG00000245164.2, ENSG00000229645.4, ENSG00000272908.1, ENSG00000265148.1, ENSG00000247774.2, ENSG00000238121.1, ENSG00000270107.1, ENSG00000242258.1, ENSG00000237484.5, ENSG00000239636.1, ENSG00000225331.1, ENSG00000228427.1, ENSG00000258810.1, ENSG00000224875.2. Figure 6B1–6B10 show survival curves with a better prognosis for those lncRNAs with low expression associated with ARHGAP30: ENSG00000182057.4, ENSG00000235570.1, ENSG00000250838.1, ENSG00000251059.1, ENSG00000229656.2, ENSG00000232527.3, ENSG00000261521.1, ENSG00000233903.2, ENSG00000186615.6, and ENSG00000215394.4 (all P < 0.05). Figure 6C1–6C10 show survival curves with a better prognosis for highly expressed lncRNAs associated with ARHGAP30: ENSG00000256691.1, ENSG00000266312.1, ENSG00000270182.1, ENSG00000231335.1, ENSG00000249717.1, ENSG00000267259.1, ENSG00000256984.1, ENSG00000178977.3, ENSG00000264469.1, and ENSG00000258670.1 (all P < 0.05).
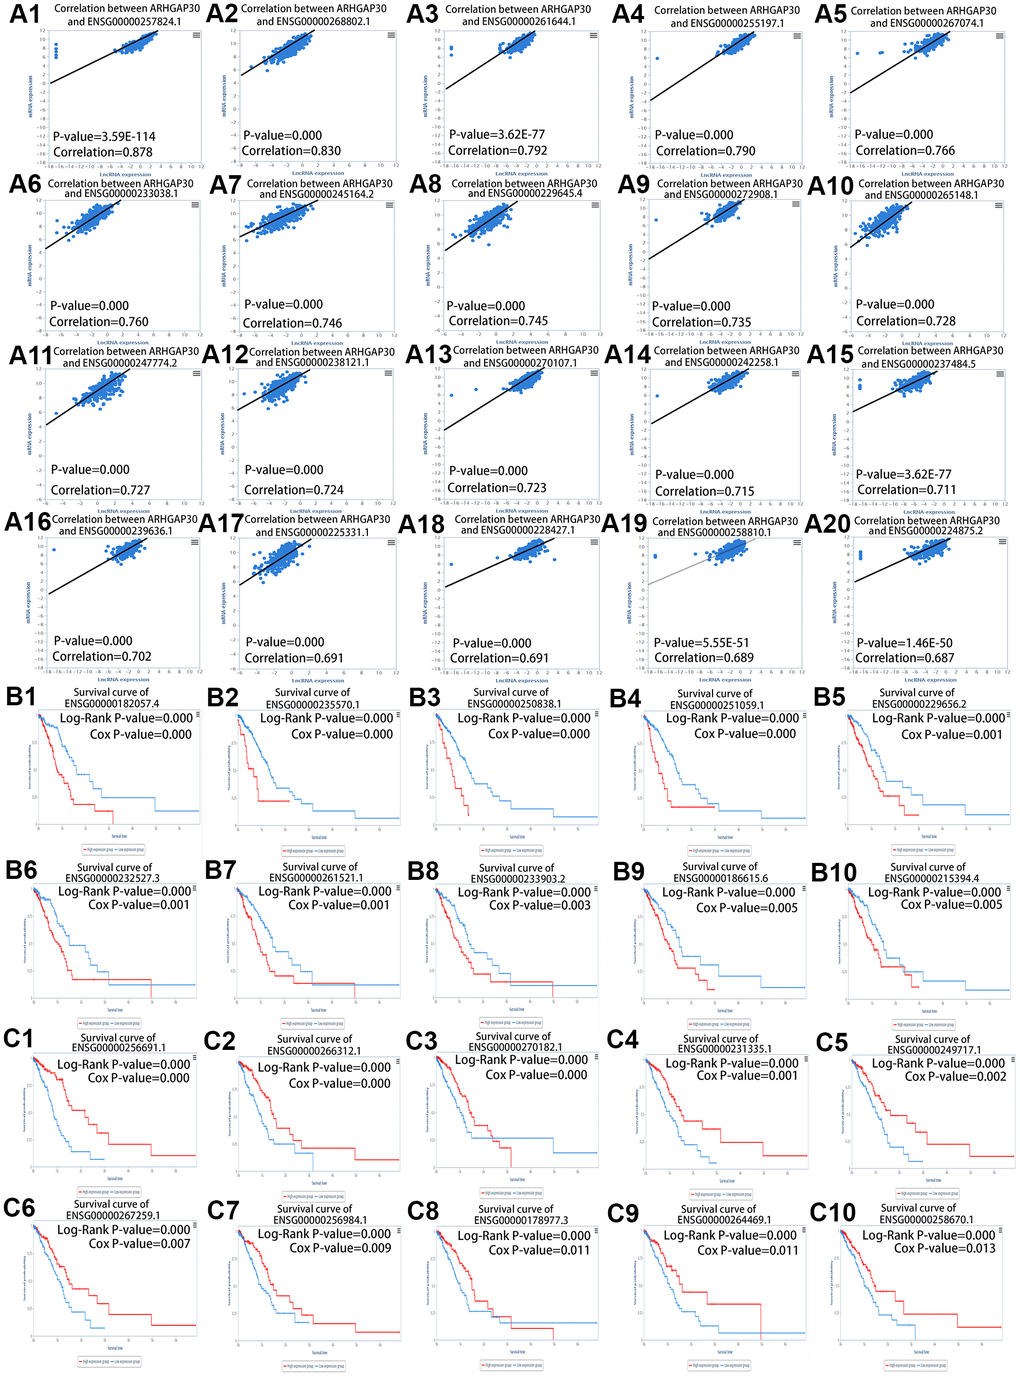
Figure 6. LncRNAs correlated highly with ARHGAP30 in lung adenocarcinoma (LUAD). (A1–A20) Scatter plots of lncRNAs that are positively associated with ARHGAP30 in LUAD. (B1–B10) ARHGAP30 correlated lncRNAs, in which low expression has a better prognosis according to the survival curve of the lncRNAs. (C1–C10) ARHGAP30 correlated lncRNAs, in which high expression has a better prognosis according to the survival curve of lncRNAs.
Gene set enrichment analysis of ARHGAP30 in lung adenocarcinoma
We performed gene set enrichment analysis (GSEA) [26] of ARHGAP30 using the Linkedomics [17] database for KEGG Pathway [27], Panther Pathway [28], Reactome Pathway [29], Wikipathway [30], Gene ontology Biological Process [31, 32], Gene ontology Cellular Component [31, 32], Gene ontology Molecular Function [31, 32], Kinase Target Network, Transcription Factor Network, and PPI BIOGRID Network [33]. We identified many genes related to tumor immunity in the enrichment results.
The results of KEGG pathway enrichment analysis are shown in Figure 7A. Significantly enriched pathways were identified using false discovery rate (FDR) less than 0.05 and the absolute value of the normalized enrichment score greater than 1. Figure 7B1, 7B2 show the enrichment profiles of some statistically significant gene sets in the KEGG analysis. Supplementary Figures 1–9 show the bar charts and enrichment profiles for ARHGAP30 GSEA of the Panther Pathway, Reactome Pathway, Wikipathway, Gene ontology Biological Process, Gene ontology Cellular Component, Gene ontology Molecular Function, Kinase Target Network, Transcription Factor Network, and PPI BIOGRID Network. Tables 1–10 detail the results of ARHGAP30 GSEA for the Panther Pathway, Reactome Pathway, Wikipathway, Gene ontology Biological Process, Gene ontology Cellular Component, Gene ontology Molecular Function, Kinase Target Network, Transcription Factor Network, and PPI BIOGRID Network, respectively, which were statistically significant (absolute normalized enrichment score (NES values greater than 1, FDR and P values less than 0.05).
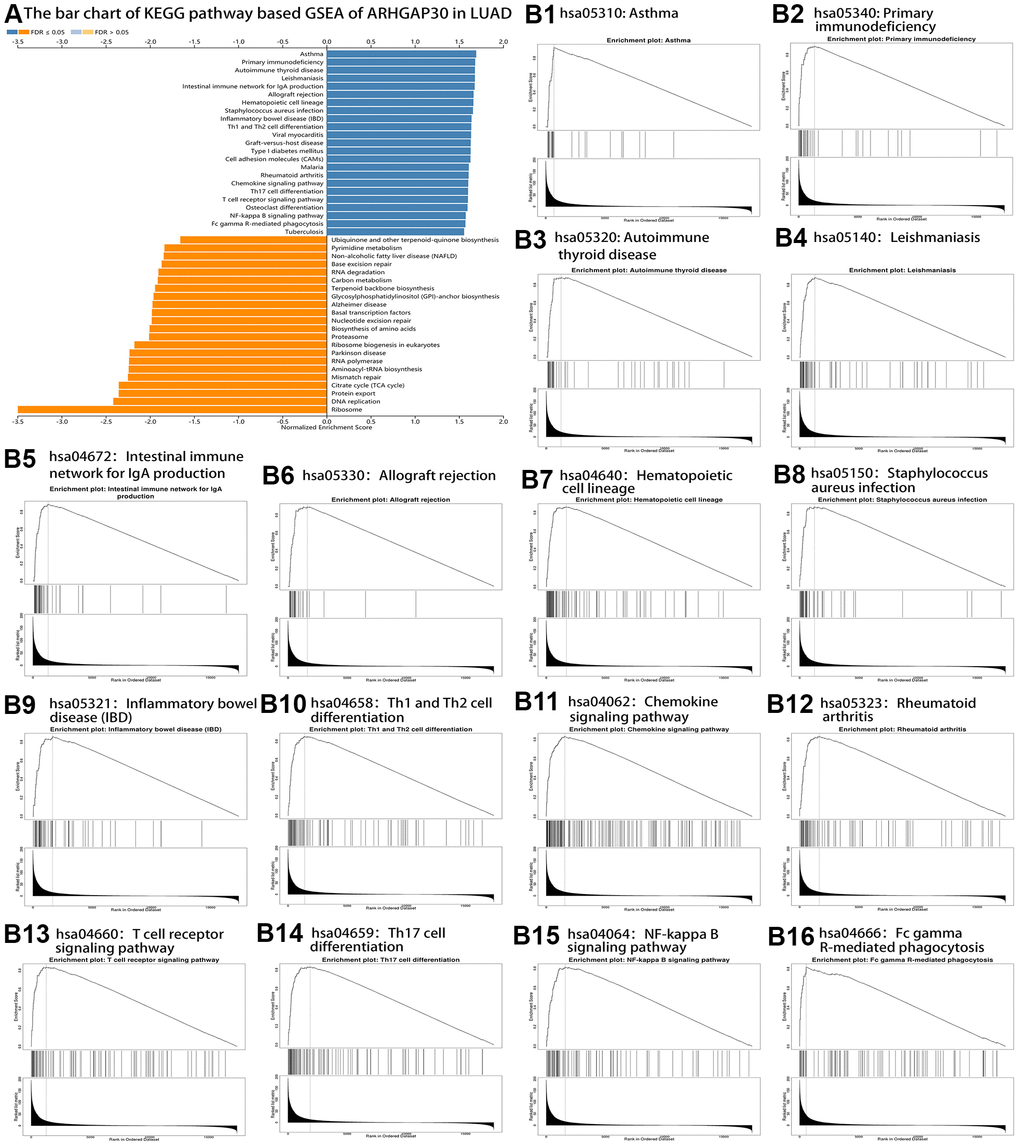
Figure 7. KEGG pathway-based GSEA of ARHGAP30 in lung adenocarcinoma (LUAD). (A) Bar chart of KEGG pathway-based GSEA of ARHGAP30 in LUAD (FDR < 0.05). (B1–B16) GSEA enrichment analysis Plots of 16 tumor immune-related KEGG gene sets (FDR < 0.05).
Table 1. KEGG pathway based gene set enrichment analysis of ARHGAP30 in lung adenocarcinoma.
| Gene set | Description | Size | Leading edge number | ES | NES | P Value | FDR |
| hsa05310 | Asthma | 28 | 18 | 0.92455 | 1.6939 | 0 | 0 |
| hsa05340 | Primary immunodeficiency | 36 | 24 | 0.89598 | 1.6822 | 0 | 0 |
| hsa05320 | Autoimmune thyroid disease | 48 | 27 | 0.88334 | 1.6799 | 0 | 0 |
| hsa05140 | Leishmaniasis | 71 | 41 | 0.88206 | 1.6794 | 0 | 0 |
| hsa04672 | Intestinal immune network for IgA production | 45 | 34 | 0.88949 | 1.676 | 0 | 0 |
| hsa05330 | Allograft rejection | 35 | 31 | 0.89287 | 1.6643 | 0 | 0 |
| hsa04640 | Hematopoietic cell lineage | 93 | 58 | 0.86219 | 1.6628 | 0 | 0 |
| hsa05150 | Staphylococcus aureus infection | 52 | 36 | 0.87392 | 1.6576 | 0 | 0 |
| hsa05321 | Inflammatory bowel disease (IBD) | 63 | 41 | 0.85768 | 1.6417 | 0 | 0 |
| hsa04658 | Th1 and Th2 cell differentiation | 90 | 46 | 0.85202 | 1.6391 | 0 | 0 |
| hsa05416 | Viral myocarditis | 56 | 32 | 0.8628 | 1.6368 | 0 | 0 |
| hsa05332 | Graft-versus-host disease | 37 | 27 | 0.86783 | 1.6327 | 0 | 0 |
| hsa04940 | Type I diabetes mellitus | 41 | 30 | 0.86296 | 1.6313 | 0 | 0 |
| hsa04514 | Cell adhesion molecules (CAMs) | 137 | 54 | 0.8432 | 1.6295 | 0 | 0 |
| hsa05012 | Parkinson disease | 115 | 66 | -0.59262 | -2.2319 | 0 | 0 |
| hsa03020 | RNA polymerase | 31 | 21 | -0.74745 | -2.237 | 0 | 0 |
| hsa00970 | Aminoacyl-tRNA biosynthesis | 43 | 30 | -0.67799 | -2.2413 | 0 | 0 |
| hsa03430 | Mismatch repair | 23 | 11 | -0.80357 | -2.2495 | 0 | 0 |
| hsa00020 | Citrate cycle (TCA cycle) | 30 | 19 | -0.7776 | -2.3534 | 0 | 0 |
| hsa03060 | Protein export | 22 | 17 | -0.79558 | -2.3539 | 0 | 0 |
| hsa03030 | DNA replication | 36 | 19 | -0.76463 | -2.4152 | 0 | 0 |
| hsa03010 | Ribosome | 131 | 100 | -0.83153 | -3.4961 | 0 | 0 |
| hsa04062 | Chemokine signaling pathway | 185 | 73 | 0.82904 | 1.6039 | 0 | 9.82E-05 |
| hsa05323 | Rheumatoid arthritis | 85 | 42 | 0.83117 | 1.6084 | 0 | 0.000104 |
| hsa05144 | Malaria | 46 | 27 | 0.84172 | 1.6104 | 0 | 0.000111 |
| hsa04660 | T cell receptor signaling pathway | 98 | 35 | 0.83662 | 1.6002 | 0 | 0.000176 |
| hsa04659 | Th17 cell differentiation | 105 | 54 | 0.83277 | 1.6019 | 0 | 0.000185 |
| hsa04380 | Osteoclast differentiation | 126 | 57 | 0.83591 | 1.5957 | 0 | 0.00025 |
| hsa04064 | NF-kappa B signaling pathway | 90 | 42 | 0.81436 | 1.5757 | 0 | 0.00091 |
| hsa04666 | Fc gamma R-mediated phagocytosis | 86 | 17 | 0.81881 | 1.5724 | 0 | 0.001016 |
| hsa03008 | Ribosome biogenesis in eukaryotes | 70 | 37 | -0.65008 | -2.1763 | 0 | 0.001061 |
| hsa05152 | Tuberculosis | 174 | 65 | 0.80199 | 1.5575 | 0 | 0.001535 |
| hsa00900 | Terpenoid backbone biosynthesis | 22 | 17 | -0.74335 | -1.9428 | 0 | 0.002387 |
| hsa03420 | Nucleotide excision repair | 45 | 16 | -0.59231 | -1.9806 | 0 | 0.002387 |
| hsa00563 | Glycosylphosphatidylinositol (GPI)-anchor biosynthesis | 25 | 10 | -0.71989 | -1.9597 | 0 | 0.002546 |
| hsa01230 | Biosynthesis of amino acids | 69 | 27 | -0.59257 | -2.0052 | 0 | 0.002604 |
| hsa05010 | Alzheimer disease | 152 | 67 | -0.49713 | -1.9717 | 0 | 0.002728 |
| hsa01200 | Carbon metabolism | 110 | 38 | -0.47465 | -1.9118 | 0 | 0.002808 |
| hsa03050 | Proteasome | 44 | 34 | -0.60203 | -2.0108 | 0 | 0.002865 |
| hsa03022 | Basal transcription factors | 44 | 18 | -0.63104 | -1.9781 | 0 | 0.002938 |
| hsa03018 | RNA degradation | 73 | 27 | -0.50119 | -1.9041 | 0 | 0.003183 |
| hsa03410 | Base excision repair | 33 | 13 | -0.68657 | -1.8682 | 0 | 0.004523 |
| hsa04932 | Non-alcoholic fatty liver disease (NAFLD) | 143 | 55 | -0.46729 | -1.8446 | 0 | 0.005729 |
| hsa00240 | Pyrimidine metabolism | 96 | 42 | -0.4934 | -1.836 | 0 | 0.005911 |
| hsa00130 | Ubiquinone and other terpenoid-quinone biosynthesis | 11 | 5 | -0.76111 | -1.6567 | 0 | 0.027882 |
Table 2. Panther pathway gene set enrichment analysis of ARHGAP30 in lung adenocarcinoma.
| Gene set | Description | Size | Leading edge number | ES | NES | P Value | FDR |
| P00053 | T cell activation | 75 | 30 | 0.87572 | 1.6754 | 0 | 0 |
| P02738 | De novo purine biosynthesis | 26 | 16 | -0.79062 | -2.2412 | 0 | 0 |
| P00017 | DNA replication | 19 | 10 | -0.79041 | -2.2625 | 0 | 0 |
| P00023 | General transcription regulation | 28 | 14 | -0.72986 | -2.101 | 0 | 0.001287 |
| P00010 | B cell activation | 58 | 19 | 0.84216 | 1.5819 | 0 | 0.004295 |
| P00055 | Transcription regulation by bZIP transcription factor | 45 | 14 | -0.58101 | -1.8961 | 0 | 0.005792 |
| P00038 | JAK/STAT signaling pathway | 15 | 9 | 0.9035 | 1.5543 | 0.002381 | 0.006872 |
| P02746 | Heme biosynthesis | 12 | 6 | -0.73501 | -1.7337 | 0.011364 | 0.013998 |
| P02740 | De novo pyrimidine ribonucleotides biosynthesis | 10 | 7 | -0.79533 | -1.7549 | 0.009901 | 0.014894 |
| P00031 | Inflammation mediated by chemokine and cytokine signaling pathway | 196 | 72 | 0.78311 | 1.524 | 0 | 0.015463 |
| P00051 | TCA cycle | 10 | 5 | -0.83656 | -1.7588 | 0 | 0.017377 |
| P02739 | De novo pyrimidine deoxyribonucleotide biosynthesis | 13 | 8 | -0.74772 | -1.7772 | 0 | 0.019307 |
| P00009 | Axon guidance mediated by netrin | 30 | 12 | 0.81439 | 1.4941 | 0.008511 | 0.035736 |
| P00014 | Cholesterol biosynthesis | 12 | 8 | -0.76183 | -1.6443 | 0.010101 | 0.039902 |
Table 3. Wikipathway gene set enrichment analysis of ARHGAP30 in lung adenocarcinoma.
| Gene set | Description | Size | Leading edge number | ES | NES | P Value | FDR |
| R-HSA-110373 | Resolution of AP sites via the multiple-nucleotide patch replacement pathway | 26 | 15 | -0.80592 | -2.1643 | 0 | 0 |
| R-HSA-114604 | GPVI-mediated activation cascade | 34 | 14 | 0.86846 | 1.613 | 0 | 0.003124 |
| R-HSA-1268020 | Mitochondrial protein import | 52 | 35 | -0.82458 | -2.784 | 0 | 0 |
| R-HSA-1461973 | Defensins | 21 | 5 | 0.92843 | 1.7135 | 0 | 0 |
| R-HSA-162599 | Late Phase of HIV Life Cycle | 121 | 59 | -0.61857 | -2.4395 | 0 | 0 |
| R-HSA-191859 | snRNP Assembly | 49 | 19 | -0.78096 | -2.5186 | 0 | 0 |
| R-HSA-194441 | Metabolism of non-coding RNA | 49 | 19 | -0.78096 | -2.5186 | 0 | 0 |
| R-HSA-198933 | Immunoregulatory interactions between a Lymphoid and a non-Lymphoid cell | 122 | 79 | 0.86427 | 1.6654 | 0 | 0.000368 |
| R-HSA-202427 | Phosphorylation of CD3 and TCR zeta chains | 20 | 20 | 0.93356 | 1.6673 | 0.002353 | 0.00042 |
| R-HSA-202430 | Translocation of ZAP-70 to Immunological synapse | 17 | 16 | 0.94274 | 1.6844 | 0 | 0 |
| R-HSA-202433 | Generation of second messenger molecules | 30 | 22 | 0.94177 | 1.7411 | 0 | 0 |
| R-HSA-2029482 | Regulation of actin dynamics for phagocytic cup formation | 60 | 14 | 0.83348 | 1.5954 | 0 | 0.005648 |
| R-HSA-2172127 | DAP12 interactions | 38 | 21 | 0.87591 | 1.6582 | 0 | 0.000327 |
| R-HSA-2299718 | Condensation of Prophase Chromosomes | 69 | 47 | -0.66539 | -2.1895 | 0 | 0 |
| R-HSA-2424491 | DAP12 signaling | 29 | 15 | 0.88744 | 1.6332 | 0 | 0.00084 |
| R-HSA-379724 | tRNA Aminoacylation | 42 | 32 | -0.71306 | -2.3694 | 0 | 0 |
| R-HSA-380108 | Chemokine receptors bind chemokines | 45 | 26 | 0.84855 | 1.5991 | 0 | 0.004982 |
| R-HSA-388841 | Costimulation by the CD28 family | 67 | 34 | 0.88459 | 1.7064 | 0 | 0 |
| R-HSA-389948 | PD-1 signaling | 21 | 20 | 0.93832 | 1.7049 | 0 | 0 |
| R-HSA-451927 | Interleukin-2 family signaling | 44 | 28 | 0.89201 | 1.6924 | 0 | 0 |
| R-HSA-512988 | Interleukin-3, Interleukin-5 and GM-CSF signaling | 47 | 24 | 0.86993 | 1.6512 | 0 | 0.000294 |
| R-HSA-5621480 | Dectin-2 family | 24 | 10 | 0.90122 | 1.6503 | 0 | 0.000245 |
| R-HSA-5668599 | RHO GTPases Activate NADPH Oxidases | 13 | 5 | 0.94977 | 1.6075 | 0 | 0.003718 |
| R-HSA-5696399 | Global Genome Nucleotide Excision Repair (GG-NER) | 84 | 31 | -0.63145 | -2.2073 | 0 | 0 |
| R-HSA-606279 | Deposition of new CENPA-containing nucleosomes at the centromere | 63 | 36 | -0.70907 | -2.5507 | 0 | 0 |
| R-HSA-6781827 | Transcription-Coupled Nucleotide Excision Repair (TC-NER) | 77 | 34 | -0.6929 | -2.399 | 0 | 0 |
| R-HSA-6782135 | Dual incision in TC-NER | 64 | 27 | -0.72714 | -2.3136 | 0 | 0 |
| R-HSA-6783783 | Interleukin-10 signaling | 45 | 28 | 0.86974 | 1.6503 | 0 | 0.000267 |
| R-HSA-6790901 | rRNA modification in the nucleus and cytosol | 52 | 35 | -0.80009 | -2.6392 | 0 | 0 |
| R-HSA-69202 | Cyclin E associated events during G1/S transition | 82 | 50 | -0.61312 | -2.2508 | 0 | 0 |
| R-HSA-69206 | G1/S Transition | 124 | 75 | -0.64433 | -2.4821 | 0 | 0 |
| R-HSA-69618 | Mitotic Spindle Checkpoint | 101 | 56 | -0.67804 | -2.3397 | 0 | 0 |
| R-HSA-69656 | Cyclin A:Cdk2-associated events at S phase entry | 84 | 50 | -0.60739 | -2.4501 | 0 | 0 |
| R-HSA-72165 | mRNA Splicing - Minor Pathway | 46 | 20 | -0.74059 | -2.3252 | 0 | 0 |
| R-HSA-73863 | RNA Polymerase I Transcription Termination | 30 | 12 | -0.81293 | -2.5196 | 0 | 0 |
| R-HSA-73864 | RNA Polymerase I Transcription | 106 | 43 | -0.61126 | -2.3211 | 0 | 0 |
| R-HSA-73884 | Base Excision Repair | 39 | 17 | -0.77946 | -2.3177 | 0 | 0 |
| R-HSA-73933 | Resolution of Abasic Sites (AP sites) | 39 | 17 | -0.77946 | -2.3177 | 0 | 0 |
| R-HSA-774815 | Nucleosome assembly | 63 | 36 | -0.70907 | -2.5507 | 0 | 0 |
| R-HSA-877300 | Interferon gamma signaling | 90 | 53 | 0.82409 | 1.5933 | 0 | 0.00553 |
| R-HSA-912526 | Interleukin receptor SHC signaling | 27 | 15 | 0.88441 | 1.6345 | 0 | 0.000905 |
| R-HSA-983695 | Antigen activates B Cell Receptor (BCR) leading to generation of second messengers | 32 | 18 | 0.86 | 1.6179 | 0 | 0.002744 |
Table 4. Reactome pathway gene set enrichment analysis of ARHGAP30 in lung adenocarcinoma.
| Gene set | Description | Size | Leading edge number | ES | NES | P Value | FDR |
| WP3937 | Microglia Pathogen Phagocytosis Pathway | 40 | 25 | 0.93221 | 1.7523 | 0 | 0 |
| WP69 | T-Cell antigen Receptor (TCR) Signaling Pathway | 89 | 39 | 0.86566 | 1.6825 | 0 | 0 |
| WP3863 | T-Cell antigen Receptor (TCR) pathway during Staphylococcus aureus infection | 61 | 26 | 0.86662 | 1.6615 | 0 | 0 |
| WP3945 | TYROBP Causal Network | 59 | 40 | 0.88146 | 1.6593 | 0 | 0 |
| WP2328 | Allograft Rejection | 87 | 55 | 0.86119 | 1.6499 | 0 | 0 |
| WP286 | IL-3 Signaling Pathway | 48 | 22 | 0.87343 | 1.6334 | 0 | 0 |
| WP78 | TCA Cycle (aka Krebs or citric acid cycle) | 18 | 13 | -0.79775 | -2.1053 | 0 | 0 |
| WP4752 | Base Excision Repair | 31 | 13 | -0.76263 | -2.224 | 0 | 0 |
| WP4521 | Glycosylation and related congenital defects | 25 | 13 | -0.78449 | -2.2261 | 0 | 0 |
| WP466 | DNA Replication | 36 | 19 | -0.75101 | -2.3665 | 0 | 0 |
| WP623 | Oxidative phosphorylation | 37 | 27 | -0.81707 | -2.3904 | 0 | 0 |
| WP405 | Eukaryotic Transcription Initiation | 42 | 24 | -0.77435 | -2.4676 | 0 | 0 |
| WP477 | Cytoplasmic Ribosomal Proteins | 88 | 72 | -0.77946 | -2.4707 | 0 | 0 |
| WP107 | Translation Factors | 50 | 28 | -0.76662 | -2.4884 | 0 | 0 |
| WP4324 | Mitochondrial complex I assembly model OXPHOS system | 44 | 39 | -0.84395 | -2.6711 | 0 | 0 |
| WP111 | Electron Transport Chain (OXPHOS system in mitochondria) | 73 | 61 | -0.83256 | -2.9456 | 0 | 0 |
| WP4595 | Urea cycle and associated pathways | 21 | 9 | -0.73691 | -2.0795 | 0 | 0.000281 |
| WP531 | DNA Mismatch Repair | 22 | 10 | -0.77183 | -2.0484 | 0 | 0.000515 |
| WP619 | Type II interferon signaling (IFNG) | 37 | 22 | 0.87609 | 1.625 | 0 | 0.000533 |
| WP4753 | Nucleotide Excision Repair | 44 | 16 | -0.59965 | -2.0373 | 0 | 0.000713 |
| WP2446 | Retinoblastoma Gene in Cancer | 86 | 45 | -0.55877 | -1.9707 | 0 | 0.001443 |
| WP4022 | Pyrimidine metabolism | 83 | 39 | -0.49658 | -1.9718 | 0 | 0.001546 |
| WP4559 | Interactions between immune cells and microRNAs in tumor microenvironment | 28 | 20 | 0.86424 | 1.6013 | 0 | 0.001864 |
| WP4585 | Cancer immunotherapy by PD-1 blockade | 23 | 15 | 0.88715 | 1.6016 | 0 | 0.00205 |
| WP49 | IL-2 Signaling Pathway | 42 | 17 | 0.84445 | 1.6036 | 0 | 0.002278 |
| WP22 | IL-9 Signaling Pathway | 17 | 9 | 0.92271 | 1.6042 | 0 | 0.00233 |
| WP205 | IL-7 Signaling Pathway | 25 | 12 | 0.89998 | 1.5928 | 0 | 0.003417 |
| WP4146 | Macrophage markers | 9 | 8 | 0.97473 | 1.5863 | 0 | 0.003594 |
| WP3929 | Chemokine signaling pathway | 163 | 62 | 0.82524 | 1.5876 | 0 | 0.003728 |
| WP4494 | Selective expression of chemokine receptors during T-cell polarization | 29 | 20 | 0.86987 | 1.5752 | 0 | 0.003837 |
| WP581 | EPO Receptor Signaling | 26 | 8 | 0.87123 | 1.5768 | 0 | 0.003844 |
| WP2849 | Hematopoietic Stem Cell Differentiation | 55 | 18 | 0.84073 | 1.5807 | 0 | 0.003852 |
| WP4582 | Cancer immunotherapy by CTLA4 blockade | 14 | 7 | 0.91643 | 1.5725 | 0 | 0.004038 |
| WP2583 | T-Cell Receptor and Co-stimulatory Signaling | 29 | 13 | 0.86168 | 1.5679 | 0 | 0.004807 |
| WP23 | B Cell Receptor Signaling Pathway | 96 | 39 | 0.81089 | 1.5636 | 0 | 0.005498 |
| WP453 | Inflammatory Response Pathway | 30 | 15 | 0.84311 | 1.5595 | 0 | 0.005676 |
| WP24 | Peptide GPCRs | 73 | 19 | 0.81715 | 1.5604 | 0 | 0.005858 |
| WP2453 | TCA Cycle and Deficiency of Pyruvate Dehydrogenase complex | 16 | 11 | -0.77333 | -1.9018 | 0 | 0.006183 |
| WP127 | IL-5 Signaling Pathway | 40 | 13 | 0.82934 | 1.5565 | 0 | 0.006321 |
| WP4553 | FBXL10 enhancement of MAP/ERK signaling in diffuse large B-cell lymphoma | 32 | 10 | -0.59305 | -1.8368 | 0 | 0.011093 |
| WP1946 | Cori Cycle | 17 | 8 | -0.72333 | -1.8214 | 0 | 0.012022 |
| WP4629 | Computational Model of Aerobic Glycolysis | 11 | 7 | -0.77655 | -1.8124 | 0 | 0.013017 |
| WP197 | Cholesterol Biosynthesis Pathway | 13 | 9 | -0.76865 | -1.7715 | 0.009901 | 0.019786 |
| WP4240 | Regulation of sister chromatid separation at the metaphase-anaphase transition | 15 | 9 | -0.68148 | -1.7149 | 0 | 0.035479 |
| WP438 | Non-homologous end joining | 10 | 2 | -0.78427 | -1.6835 | 0.024194 | 0.040727 |
| WP4320 | The effect of progerin on the involved genes in Hutchinson-Gilford Progeria Syndrome | 36 | 14 | -0.57494 | -1.6836 | 0 | 0.042578 |
Table 5. Gene ontology biological process based gene set enrichment analysis of ARHGAP30 in lung adenocarcinoma.
| Gene set | Description | Size | Leading edge number | ES | NES | P Value | FDR |
| GO:0006968 | cellular defense response | 53 | 26 | 0.85607 | 1.6667 | 0 | 0 |
| GO:0000959 | mitochondrial RNA metabolic process | 33 | 22 | -0.67592 | -2.0538 | 0 | 0 |
| GO:0002181 | cytoplasmic translation | 84 | 50 | -0.58607 | -2.0597 | 0 | 0 |
| GO:0098781 | ncRNA transcription | 93 | 46 | -0.54515 | -2.0641 | 0 | 0 |
| GO:0071806 | protein transmembrane transport | 59 | 27 | -0.70316 | -2.1031 | 0 | 0 |
| GO:0034502 | protein localization to chromosome | 68 | 39 | -0.61386 | -2.1257 | 0 | 0 |
| GO:0042769 | DNA damage response, detection of DNA damage | 38 | 15 | -0.70411 | -2.1428 | 0 | 0 |
| GO:0006490 | oligosaccharide-lipid intermediate biosynthetic process | 20 | 9 | -0.8074 | -2.1678 | 0 | 0 |
| GO:0006354 | DNA-templated transcription, elongation | 84 | 27 | -0.54275 | -2.1898 | 0 | 0 |
| GO:0045454 | cell redox homeostasis | 59 | 24 | -0.65482 | -2.1915 | 0 | 0 |
| GO:0061641 | CENP-A containing chromatin organization | 24 | 16 | -0.77476 | -2.2312 | 0 | 0 |
| GO:0036260 | RNA capping | 30 | 13 | -0.79033 | -2.3135 | 0 | 0 |
| GO:0006353 | DNA-templated transcription, termination | 69 | 26 | -0.69744 | -2.3511 | 0 | 0 |
| GO:0072350 | tricarboxylic acid metabolic process | 38 | 21 | -0.73574 | -2.4276 | 0 | 0 |
| GO:0033108 | mitochondrial respiratory chain complex assembly | 68 | 53 | -0.82238 | -2.4489 | 0 | 0 |
| GO:0010257 | NADH dehydrogenase complex assembly | 49 | 41 | -0.83836 | -2.4807 | 0 | 0 |
| GO:0006289 | nucleotide-excision repair | 106 | 39 | -0.64825 | -2.4996 | 0 | 0 |
| GO:0006414 | translational elongation | 123 | 82 | -0.83503 | -3.2155 | 0 | 0 |
| GO:0032623 | interleukin-2 production | 63 | 31 | 0.83578 | 1.6105 | 0 | 0.000291 |
| GO:0032609 | interferon-gamma production | 102 | 56 | 0.84241 | 1.6107 | 0 | 0.000317 |
| GO:0070661 | leukocyte proliferation | 272 | 122 | 0.84138 | 1.6349 | 0 | 0.000349 |
| GO:0002285 | lymphocyte activation involved in immune response | 165 | 68 | 0.83527 | 1.6137 | 0 | 0.000349 |
| GO:0007159 | leukocyte cell-cell adhesion | 310 | 135 | 0.83054 | 1.6142 | 0 | 0.000388 |
| GO:0001773 | myeloid dendritic cell activation | 27 | 15 | 0.86561 | 1.6095 | 0 | 0.000403 |
| GO:0050690 | regulation of defense response to virus by virus | 29 | 12 | 0.85941 | 1.639 | 0 | 0.000437 |
| GO:0002250 | adaptive immune response | 366 | 175 | 0.835 | 1.6177 | 0 | 0.000437 |
| GO:0042110 | T cell activation | 437 | 184 | 0.83599 | 1.6255 | 0 | 0.000499 |
| GO:0050867 | positive regulation of cell activation | 298 | 126 | 0.82659 | 1.608 | 0 | 0.000499 |
| GO:0032633 | interleukin-4 production | 34 | 21 | 0.88557 | 1.6508 | 0 | 0.000582 |
| GO:0045730 | respiratory burst | 27 | 10 | 0.90536 | 1.6256 | 0 | 0.000582 |
| GO:0031123 | RNA 3'-end processing | 111 | 48 | -0.62236 | -1.9837 | 0 | 0.000584 |
| GO:0016073 | snRNA metabolic process | 82 | 42 | -0.56867 | -1.9865 | 0 | 0.000611 |
| GO:0051131 | chaperone-mediated protein complex assembly | 19 | 6 | -0.74976 | -2.0021 | 0 | 0.00064 |
| GO:0042107 | cytokine metabolic process | 106 | 43 | 0.83001 | 1.6024 | 0 | 0.000698 |
| GO:0071706 | tumor necrosis factor superfamily cytokine production | 133 | 54 | 0.82167 | 1.6013 | 0 | 0.000764 |
| GO:1990868 | response to chemokine | 86 | 44 | 0.84852 | 1.6524 | 0 | 0.000873 |
| GO:0030101 | natural killer cell activation | 79 | 30 | 0.83376 | 1.5967 | 0 | 0.000873 |
| GO:0002694 | regulation of leukocyte activation | 461 | 199 | 0.82149 | 1.5987 | 0 | 0.000924 |
| GO:0042113 | B cell activation | 221 | 86 | 0.82221 | 1.5887 | 0 | 0.000998 |
| GO:0050866 | negative regulation of cell activation | 172 | 78 | 0.82699 | 1.5914 | 0 | 0.001011 |
| GO:0002764 | immune response-regulating signaling pathway | 452 | 159 | 0.80813 | 1.5818 | 0 | 0.001215 |
| GO:0032613 | interleukin-10 production | 46 | 24 | 0.83341 | 1.5734 | 0 | 0.001293 |
Table 6. Gene ontology cellular component based gene set enrichment analysis of ARHGAP30 in lung adenocarcinoma.
| Gene set | Description | Size | Leading edge number | ES | NES | P Value | FDR |
| GO:0042611 | MHC protein complex | 19 | 16 | 0.91235 | 1.6397 | 0 | 0 |
| GO:0036452 | ESCRT complex | 23 | 12 | -0.7271 | -1.9814 | 0 | 0 |
| GO:0101031 | chaperone complex | 21 | 13 | -0.7488 | -2.089 | 0 | 0 |
| GO:0005732 | small nucleolar ribonucleoprotein complex | 20 | 14 | -0.84007 | -2.2357 | 0 | 0 |
| GO:0005844 | polysome | 70 | 44 | -0.64071 | -2.2843 | 0 | 0 |
| GO:0009295 | nucleoid | 36 | 27 | -0.76327 | -2.3211 | 0 | 0 |
| GO:1905368 | peptidase complex | 85 | 54 | -0.68339 | -2.4793 | 0 | 0 |
| GO:0005681 | spliceosomal complex | 155 | 64 | -0.60446 | -2.5676 | 0 | 0 |
| GO:0030964 | NADH dehydrogenase complex | 43 | 39 | -0.82377 | -2.6221 | 0 | 0 |
| GO:0070069 | cytochrome complex | 29 | 22 | -0.87423 | -2.6756 | 0 | 0 |
| GO:0070469 | respiratory chain | 84 | 62 | -0.82349 | -2.6858 | 0 | 0 |
| GO:0120114 | Sm-like protein family complex | 69 | 28 | -0.78085 | -2.7326 | 0 | 0 |
| GO:0030684 | preribosome | 66 | 39 | -0.73361 | -2.7355 | 0 | 0 |
| GO:0001772 | immunological synapse | 32 | 17 | 0.85713 | 1.5928 | 0 | 0.000759 |
| GO:1905348 | endonuclease complex | 23 | 10 | -0.7109 | -1.8954 | 0 | 0.003019 |
| GO:0098552 | side of membrane | 459 | 171 | 0.80484 | 1.5734 | 0 | 0.00354 |
| GO:0098636 | protein complex involved in cell adhesion | 35 | 14 | 0.83327 | 1.5509 | 0 | 0.00531 |
| GO:0042629 | mast cell granule | 21 | 9 | 0.85342 | 1.5417 | 0 | 0.006069 |
| GO:0001891 | phagocytic cup | 21 | 12 | 0.85394 | 1.536 | 0 | 0.006575 |
| GO:0042581 | specific granule | 152 | 44 | 0.77662 | 1.5083 | 0 | 0.010431 |
| GO:0070820 | tertiary granule | 155 | 43 | 0.77958 | 1.5136 | 0 | 0.010837 |
| GO:0005657 | replication fork | 62 | 21 | -0.52303 | -1.7674 | 0 | 0.012616 |
| GO:1990204 | oxidoreductase complex | 95 | 61 | -0.47317 | -1.7327 | 0 | 0.017008 |
| GO:0031970 | organelle envelope lumen | 73 | 28 | -0.44485 | -1.7196 | 0 | 0.017172 |
| GO:0030667 | secretory granule membrane | 279 | 76 | 0.75106 | 1.4744 | 0 | 0.023264 |
| GO:0005697 | telomerase holoenzyme complex | 20 | 10 | -0.62191 | -1.6713 | 0.017241 | 0.032323 |
| GO:0043235 | receptor complex | 391 | 143 | 0.73726 | 1.437 | 0 | 0.047337 |
| GO:0036019 | endolysosome | 19 | 9 | 0.82188 | 1.4317 | 0.004587 | 0.047999 |
Table 7. Gene ontology molecular function-based gene set enrichment analysis of ARHGAP30 in lung adenocarcinoma.
| Gene set | Size | Leading edge number | ES | NES | P Value | FDR | Description |
| GO:0042287 | MHC protein binding | 24 | 16 | 0.90783 | 1.6451 | 0 | 0 |
| GO:0008135 | translation factor activity, RNA binding | 81 | 34 | -0.59488 | -2.1067 | 0 | 0 |
| GO:0043021 | ribonucleoprotein complex binding | 117 | 44 | -0.55984 | -2.1205 | 0 | 0 |
| GO:0000049 | tRNA binding | 50 | 32 | -0.61345 | -2.1332 | 0 | 0 |
| GO:0015002 | heme-copper terminal oxidase activity | 24 | 16 | -0.84644 | -2.3002 | 0 | 0 |
| GO:0030515 | snoRNA binding | 28 | 19 | -0.80939 | -2.3053 | 0 | 0 |
| GO:0016675 | oxidoreductase activity, acting on a heme group of donors | 25 | 16 | -0.84613 | -2.3757 | 0 | 0 |
| GO:0019843 | rRNA binding | 60 | 42 | -0.74059 | -2.4081 | 0 | 0 |
| GO:0051082 | unfolded protein binding | 108 | 52 | -0.69233 | -2.6499 | 0 | 0 |
| GO:0003735 | structural constituent of ribosome | 154 | 119 | -0.83969 | -3.289 | 0 | 0 |
| GO:0016502 | nucleotide receptor activity | 22 | 14 | 0.87811 | 1.6115 | 0 | 0.00054724 |
| GO:0035586 | purinergic receptor activity | 26 | 16 | 0.86825 | 1.6126 | 0 | 0.00082086 |
| GO:0004896 | cytokine receptor activity | 88 | 49 | 0.84639 | 1.6087 | 0 | 0.0016417 |
| GO:0017069 | snRNA binding | 34 | 10 | -0.67977 | -1.9375 | 0 | 0.0022837 |
| GO:0003684 | damaged DNA binding | 67 | 26 | -0.49758 | -1.9239 | 0 | 0.0028547 |
| GO:0016779 | nucleotidyltransferase activity | 114 | 44 | -0.47695 | -1.9243 | 0 | 0.0031142 |
| GO:0035004 | phosphatidylinositol 3-kinase activity | 81 | 25 | 0.82041 | 1.5905 | 0 | 0.0032834 |
| GO:0019865 | immunoglobulin binding | 22 | 12 | 0.86362 | 1.5831 | 0.0022272 | 0.003518 |
| GO:0038187 | pattern recognition receptor activity | 20 | 11 | 0.87926 | 1.5833 | 0 | 0.0041043 |
| GO:0052813 | phosphatidylinositol bisphosphate kinase activity | 73 | 24 | 0.81306 | 1.5743 | 0 | 0.0045147 |
| GO:0043548 | phosphatidylinositol 3-kinase binding | 30 | 11 | 0.84191 | 1.546 | 0 | 0.0073877 |
| GO:0003823 | antigen binding | 52 | 25 | 0.83357 | 1.5482 | 0.0020367 | 0.0080262 |
| GO:0019239 | deaminase activity | 27 | 9 | 0.84449 | 1.5368 | 0 | 0.010149 |
| GO:0042169 | SH2 domain binding | 33 | 9 | 0.83581 | 1.5289 | 0 | 0.010229 |
| GO:0015026 | coreceptor activity | 39 | 20 | 0.83108 | 1.5324 | 0 | 0.010261 |
| GO:0019955 | cytokine binding | 119 | 53 | 0.7923 | 1.5183 | 0 | 0.012547 |
| GO:1990782 | protein tyrosine kinase binding | 76 | 18 | 0.79568 | 1.5158 | 0 | 0.012587 |
| GO:0031491 | nucleosome binding | 66 | 20 | -0.49926 | -1.7891 | 0 | 0.016689 |
| GO:0017056 | structural constituent of nuclear pore | 22 | 3 | -0.61094 | -1.758 | 0 | 0.023653 |
| GO:0016790 | thiolester hydrolase activity | 31 | 13 | -0.5909 | -1.7292 | 0 | 0.028166 |
| GO:0038024 | cargo receptor activity | 77 | 26 | 0.76716 | 1.4694 | 0 | 0.03776 |
| GO:0104005 | hijacked molecular function | 70 | 14 | 0.77566 | 1.4646 | 0 | 0.039884 |
| GO:0004713 | protein tyrosine kinase activity | 174 | 56 | 0.75063 | 1.4588 | 0 | 0.042685 |
| GO:0003697 | single-stranded DNA binding | 93 | 41 | -0.46853 | -1.6551 | 0 | 0.044247 |
| GO:0051087 | chaperone binding | 96 | 27 | -0.46803 | -1.6357 | 0 | 0.045003 |
| GO:0030506 | ankyrin binding | 20 | 2 | 0.81515 | 1.4498 | 0.0090703 | 0.04856 |
| GO:0051540 | metal cluster binding | 59 | 26 | -0.53488 | -1.6196 | 0 | 0.048846 |
Table 8. Kinase target network gene set enrichment analysis of ARHGAP30 in lung adenocarcinoma.
| Gene set | Description | Size | Leading edge number | ES | NES | P Value | FDR |
| Kinase_LYN | LYN proto-oncogene, Src family tyrosine kinase | 50 | 23 | 0.88163 | 1.69 | 0 | 0 |
| Kinase_SYK | spleen associated tyrosine kinase | 35 | 20 | 0.88807 | 1.6638 | 0 | 0 |
| Kinase_LCK | LCK proto-oncogene, Src family tyrosine kinase | 43 | 25 | 0.87754 | 1.6409 | 0 | 0 |
| Kinase_HCK | HCK proto-oncogene, Src family tyrosine kinase | 23 | 14 | 0.90568 | 1.6236 | 0 | 0.000453 |
| Kinase_BTK | Bruton tyrosine kinase | 9 | 4 | 0.96245 | 1.5569 | 0 | 0.014843 |
| Kinase_FGR | FGR proto-oncogene, Src family tyrosine kinase | 12 | 7 | 0.90291 | 1.5354 | 0.004819 | 0.023015 |
| Kinase_FYN | FYN proto-oncogene, Src family tyrosine kinase | 66 | 21 | 0.79674 | 1.5309 | 0 | 0.023306 |
| Kinase_PRKCQ | protein kinase C theta | 28 | 10 | 0.83313 | 1.5386 | 0.002179 | 0.023834 |
| Kinase_ITK | IL2 inducible T-cell kinase | 8 | 6 | 0.95805 | 1.5163 | 0 | 0.030592 |
| Kinase_JAK3 | Janus kinase 3 | 12 | 8 | 0.8914 | 1.5164 | 0.005051 | 0.033991 |
Table 9. Transcription factor network gene set enrichment analysis of ARHGAP30 in lung adenocarcinoma.
| Gene set | Size | Leading edge number | ES | NES | P Value | FDR |
| V$PU1_Q6 | 211 | 48 | 0.7456 | 1.4539 | 0 | 0.027156 |
| V$PEA3_Q6 | 242 | 73 | 0.74837 | 1.4483 | 0 | 0.027497 |
| RACCACAR_V$AML_Q6 | 241 | 66 | 0.74025 | 1.4434 | 0 | 0.028904 |
| RGAGGAARY_V$PU1_Q6 | 460 | 107 | 0.7462 | 1.4553 | 0 | 0.030226 |
| STTTCRNTTT_V$IRF_Q6 | 175 | 68 | 0.75524 | 1.4614 | 0 | 0.030856 |
| V$PAX5_02 | 15 | 7 | 0.85689 | 1.4665 | 0.009346 | 0.035138 |
| V$ISRE_01 | 234 | 77 | 0.75508 | 1.4722 | 0 | 0.038255 |
| V$IRF_Q6 | 229 | 78 | 0.76436 | 1.482 | 0 | 0.039042 |
| V$ELF1_Q6 | 220 | 69 | 0.77176 | 1.5138 | 0 | 0.039672 |
| V$ETS_Q4 | 238 | 55 | 0.72616 | 1.4108 | 0 | 0.043159 |
| TGTYNNNNNRGCARM_UNKNOWN | 81 | 26 | 0.73366 | 1.4113 | 0 | 0.046284 |
| V$ICSBP_Q6 | 230 | 75 | 0.71252 | 1.3885 | 0 | 0.047526 |
| V$ETS1_B | 237 | 76 | 0.71314 | 1.3914 | 0 | 0.047543 |
| V$STAT6_02 | 241 | 60 | 0.71256 | 1.3852 | 0 | 0.0477 |
| V$AML_Q6 | 239 | 75 | 0.72796 | 1.4135 | 0 | 0.047915 |
| GGGNNTTTCC_V$NFKB_Q6_01 | 130 | 51 | 0.76183 | 1.4879 | 0 | 0.048173 |
| YNTTTNNNANGCARM_UNKNOWN | 66 | 16 | 0.73294 | 1.3927 | 0.00202 | 0.048562 |
Table 10. PPI BIOGRID network gene set enrichment analysis of ARHGAP30 in lung adenocarcinoma.
| Gene set | Size | Leading edge number | ES | NES | P Value | FDR |
| PPI_BIOGRID_M856 | 27 | 20 | -0.80351 | -2.2385 | 0 | 0 |
| PPI_BIOGRID_M299 | 43 | 23 | -0.77865 | -2.3323 | 0 | 0 |
| PPI_BIOGRID_M422 | 41 | 25 | -0.78055 | -2.38 | 0 | 0 |
| PPI_BIOGRID_M298 | 50 | 37 | -0.8034 | -2.6225 | 0 | 0 |
| PPI_BIOGRID_M300 | 49 | 42 | -0.88664 | -3.0801 | 0 | 0 |
| PPI_BIOGRID_M272 | 85 | 44 | -0.53652 | -2.1103 | 0 | 0.000404 |
| PPI_BIOGRID_M428 | 43 | 23 | -0.62913 | -2.1148 | 0 | 0.000471 |
| PPI_BIOGRID_M441 | 36 | 15 | -0.63714 | -2.0772 | 0 | 0.000706 |
| PPI_BIOGRID_M734 | 30 | 11 | -0.69304 | -2.0258 | 0 | 0.00113 |
| PPI_BIOGRID_M848 | 22 | 11 | -0.67958 | -1.9924 | 0 | 0.001177 |
| PPI_BIOGRID_M857 | 14 | 13 | -0.83146 | -2.0371 | 0 | 0.001256 |
| PPI_BIOGRID_M581 | 56 | 23 | -0.63221 | -2.0062 | 0 | 0.001284 |
| PPI_BIOGRID_M172 | 31 | 14 | -0.63806 | -1.9488 | 0 | 0.001507 |
| PPI_BIOGRID_M544 | 20 | 12 | -0.7468 | -1.9646 | 0 | 0.001521 |
| PPI_BIOGRID_M438 | 16 | 6 | -0.74768 | -1.9459 | 0 | 0.001589 |
| PPI_BIOGRID_M597 | 13 | 6 | -0.85103 | -1.9511 | 0 | 0.001614 |
| PPI_BIOGRID_M309 | 238 | 89 | 0.83885 | 1.6286 | 0 | 0.003523 |
| PPI_BIOGRID_M185 | 32 | 21 | -0.63805 | -1.8991 | 0 | 0.003822 |
| PPI_BIOGRID_M702 | 15 | 8 | -0.76267 | -1.8672 | 0 | 0.006592 |
| PPI_BIOGRID_M722 | 46 | 24 | -0.58535 | -1.8575 | 0 | 0.007286 |
| PPI_BIOGRID_M189 | 11 | 7 | -0.86049 | -1.8475 | 0 | 0.008616 |
| PPI_BIOGRID_M717 | 23 | 12 | -0.67161 | -1.8398 | 0 | 0.008732 |
| PPI_BIOGRID_M583 | 69 | 27 | -0.54002 | -1.8412 | 0 | 0.008744 |
| PPI_BIOGRID_M951 | 10 | 5 | -0.81538 | -1.8293 | 0.008929 | 0.010809 |
| PPI_BIOGRID_M190 | 11 | 7 | -0.79575 | -1.8176 | 0.016949 | 0.012359 |
| PPI_BIOGRID_M819 | 10 | 8 | -0.80619 | -1.8117 | 0 | 0.012656 |
From the results of KEGG pathway GSEA (Table 1), Primary immunodeficiency, Th1 and Th2 cell differentiation, Chemokine signaling pathway, T cell receptor signaling pathway, Th17 cell differentiation, and Fc gamma R-mediated phagocytosis were associated with immunity. From the results of Panther Pathway GSEA (Table 2), T cell activation, B cell activation, Inflammation mediated by chemokine and cytokine signaling pathway, Interleukin signaling pathway, and Toll receptor signaling pathway were associated with immunity. From the results of Reactome Pathway GSEA (Table 3), Defensins, Translocation of ZAP-70 to Immunological synapse, Generation of second messenger molecules, Costimulation by the CD28 family, PD-1 signaling, Interleukin-2 family signaling, Interleukin-10 signaling, Interleukin-3, Interleukin-5 and GM-CSF signaling, DAP12 interactions, Immunoregulatory interactions between a Lymphoid and a non-Lymphoid cell, Phosphorylation of CD3 and TCR zeta chains, DAP12 signaling, Interleukin receptor SHC signaling, Antigen activates B Cell Receptor (BCR) leading to generation of second messengers, RHO GTPases Activate NADPH Oxidases, Chemokine receptors bind chemokines, Interferon-gamma signaling, and Regulation of actin dynamics for phagocytic cup formation were associated with immunity. From the results of Wikipathway GSEA analysis (Table 4), T-Cell antigen Receptor (TCR) Signaling Pathway, T-Cell antigen Receptor (TCR) pathway during Staphylococcus aureus infection, Allograft Rejection, IL-3 Signaling Pathway, Type II interferon signaling (IFNG), Interactions between immune cells and microRNAs in the tumor microenvironment, Cancer immunotherapy by PD-1 blockade, IL-2 Signaling Pathway, IL-9 Signaling Pathway, IL-7 Signaling Pathway, Macrophage markers, Chemokine signaling pathway, Selective expression of chemokine receptors during T-cell polarization, Cancer immunotherapy by CTLA4 blockade, T-Cell Receptor and Co-stimulatory Signaling, B Cell Receptor Signaling Pathway, Inflammatory Response Pathway, and IL-5 Signaling Pathway were associated with immunity. From the results of Gene ontology Biological Process GSEA (Table 5), the GO terms cellular defense response, interleukin-2 production, interferon-gamma production, leukocyte proliferation, lymphocyte activation involved in immune response, leukocyte cell-cell adhesion, myeloid dendritic cell activation, adaptive immune response, T cell activation, interleukin-4 production, cytokine metabolic process, tumor necrosis factor superfamily cytokine production, response to chemokine, natural killer cell activation, regulation of leukocyte activation, B cell activation, immune response-regulating signaling pathway, and interleukin-10 production were associated with immunity. From the results of the Gene ontology Cellular Component GSEA (Table 6), the GO terms MHC protein complex, immunological synapse, and mast cell granule were associated with immunity. From the results of Gene ontology Molecular Function GSEA (Table 7–10) the GO terms MHC protein binding, cytokine receptor activity, immunoglobulin binding, antigen binding, and cytokine binding were associated with immunity.
The relationship between TILs, immunostimulators, MHC molecules, chemokines, and chemokine receptors and the expression and DNA methylation of ARHGAP30 in lung adenocarcinoma
The relationship between ARHGAP30 expression and TILs, immunostimulators, MHC molecules, chemokines, and chemokine receptors in LUAD
Figures 8A, 9A, 10A, 11A, 12A, respectively, show heat maps of the relationship between the abundance of TILs, immunostimulators, MHC molecules, chemokines, and chemokine receptors and the expression of ARHGAP30. These heatmaps were mostly red, indicating that most of the TILs, immunostimulators, MHC molecules, chemokines, and chemokine receptors correlated positively with the expression of ARHGAP30. Also, dark red areas indicated that some of them had a strong positive correlation with the expression of ARHGAP30.
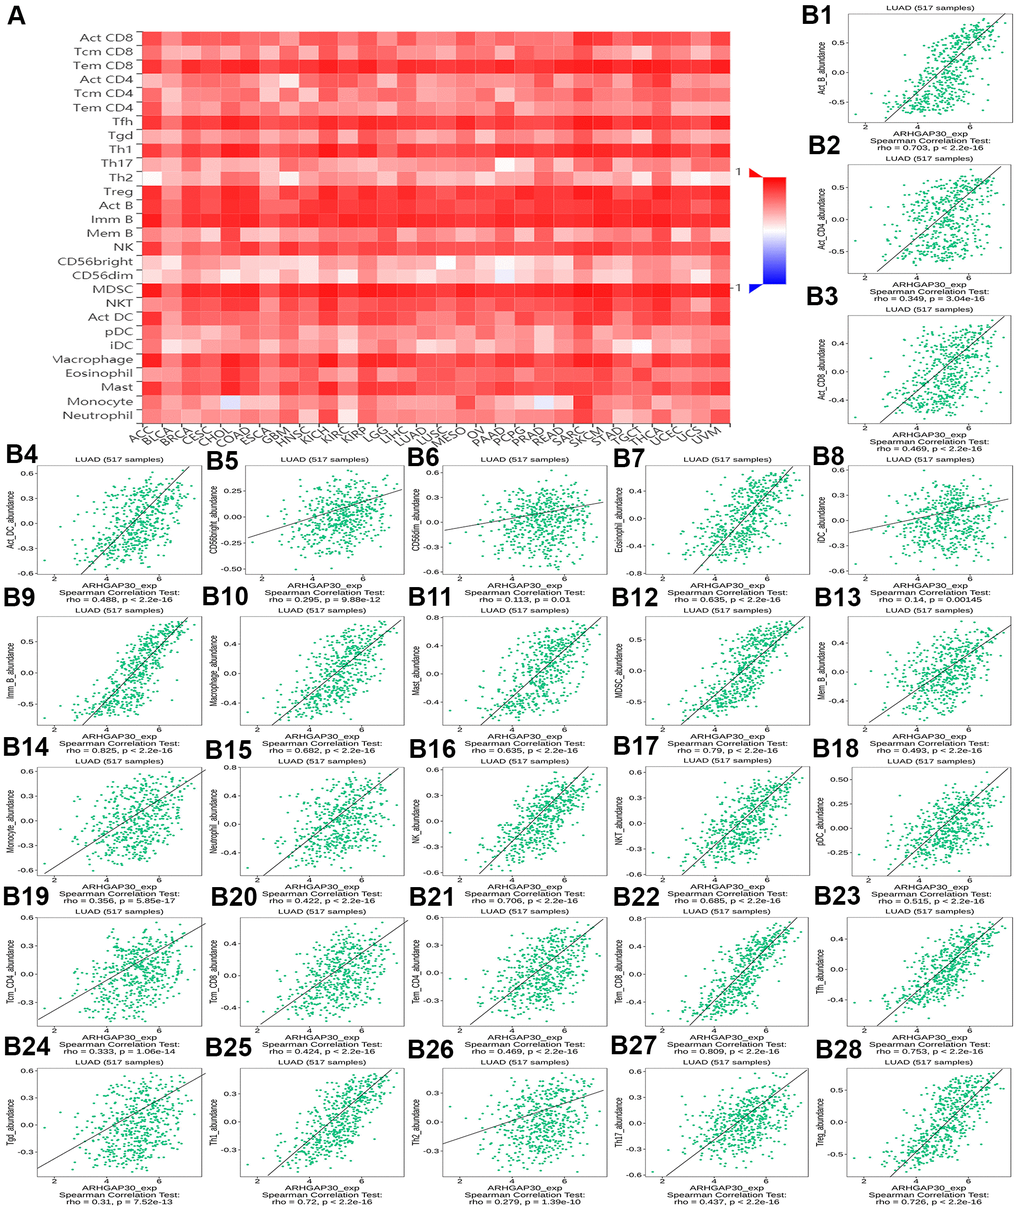
Figure 8. The correlation between the abundance of tumor-infiltrating lymphocytes (TILs) and expression of ARHGAP30. (A) Heat map of the relationship between the abundance of TILs and ARHGAP30 expression. (B1–B28) Scatter plots showing the positive correlation between ARHGAP30 expression and TILs in the treatment of lung adenocarcinoma. Act_CD8, Activated CD8 T cell; Tcm_CD8, Central memory CD8 T cell; Tem_CD8, Effector memory CD8 T cell; Act_CD4, Activated CD4 T cell; Tcm_CD4, Central memory CD4 T cell; Tem_CD4, Effector memory CD4 T cell; Tgd, Gamma delta T cell; Tfh, T follicular helper cell; Th1, Type 1 T helper cell; Th17, Type 17 T helper cell; Th2, Type 2 T helper cell; Treg, Regulatory T cell; MDSC, Myeloid derived suppressor cell; Act_B, Activated B cell; Imm_B, Immature B cell; Mem_B, Memory B cell; NK, Natural killer cell; CD56brigh, CD56bright natural killer cell; CD56dim, CD56dim natural killer cell; NKT, Natural killer T cell; Act_DC, Activated dendritic cell; iDC, Immature dendritic cell; pDC, Plasmacytoid dendritic cell; Mast, Mast cell.
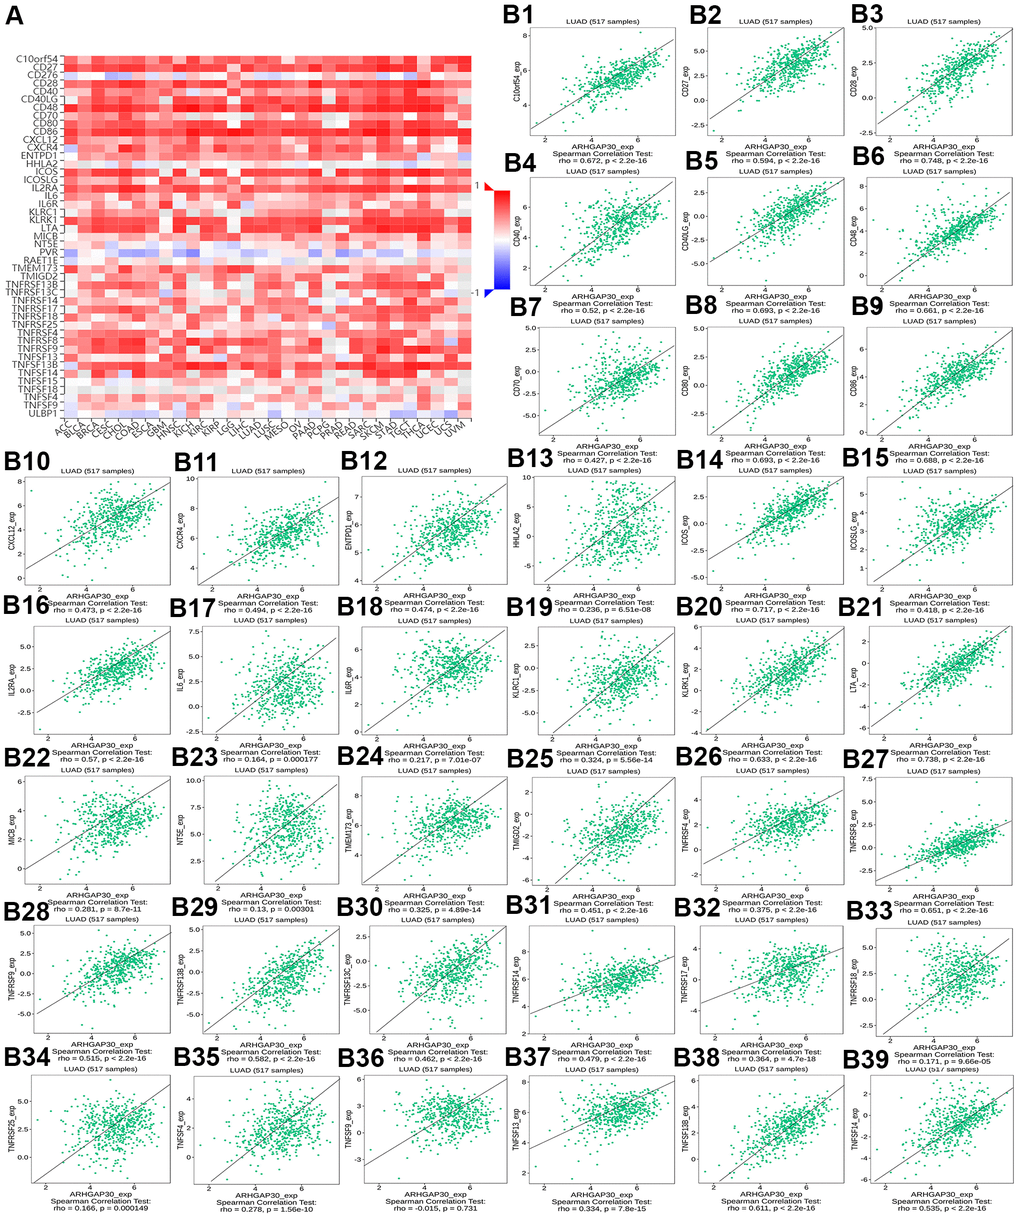
Figure 9. The correlation between the abundance of tumor-infiltrating lymphocytes (TILs) and the methylation of ARHGAP30. (A) Heat map of the relationship between the abundance of TILs abundance and ARHGAP30 DNA methylation. (B1–B39) Scatter plots showing the negative correlation between ARHGAP30 DNA methylation and TILs in the treatment of lung adenocarcinoma. Act_CD8, Activated CD8 T cell; Tcm_CD8, Central memory CD8 T cell; Tem_CD8, Effector memory CD8 T cell; Act_CD4, Activated CD4 T cell; Tcm_CD4, Central memory CD4 T cell; Tem_CD4, Effector memory CD4 T cell; Tgd, Gamma delta T cell; Tfh, T follicular helper cell; Th1, Type 1 T helper cell; Th17, Type 17 T helper cell; Th2, Type 2 T helper cell; Treg, Regulatory T cell; MDSC, Myeloid derived suppressor cell; Act_B, Activated B cell; Imm_B, Immature B cell; Mem_B, Memory B cell; NK, Natural killer cell; CD56brigh, CD56bright natural killer cell; CD56dim, CD56dim natural killer cell; NKT, Natural killer T cell; Act_DC, Activated dendritic cell; iDC, Immature dendritic cell; pDC, Plasmacytoid dendritic cell; Mast, Mast cell.
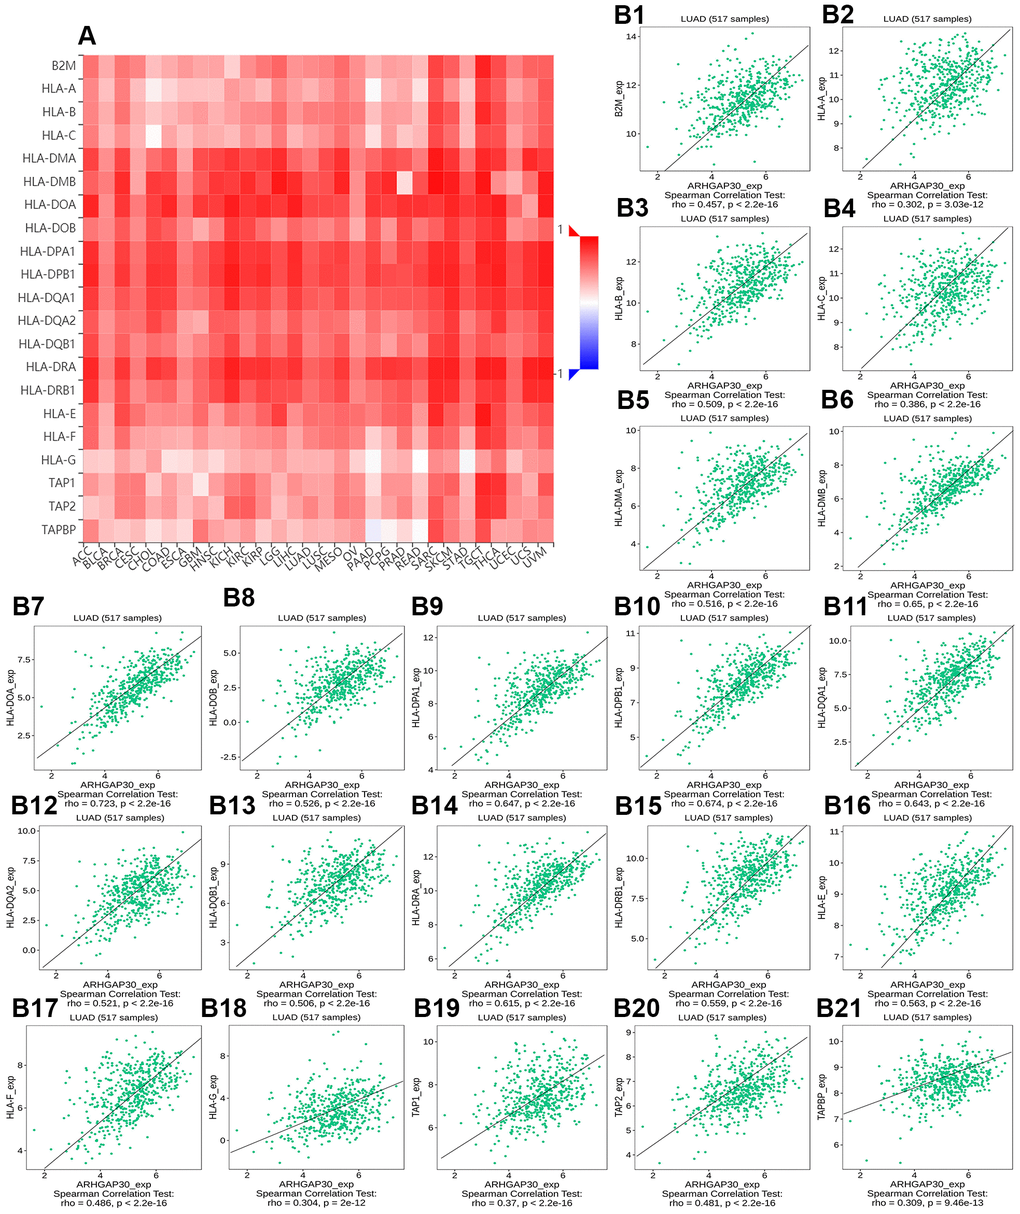
Figure 10. The correlation between the expression of ARHGAP30 and immune inhibitors. (A) Heat map of Spearman correlations between ARHGAP30 expression and immune inhibitors across human cancers. (B1–B21) Scatter plots showing the positive correlation between ARHGAP30 expression and immune inhibitors in the treatment of lung adenocarcinoma.
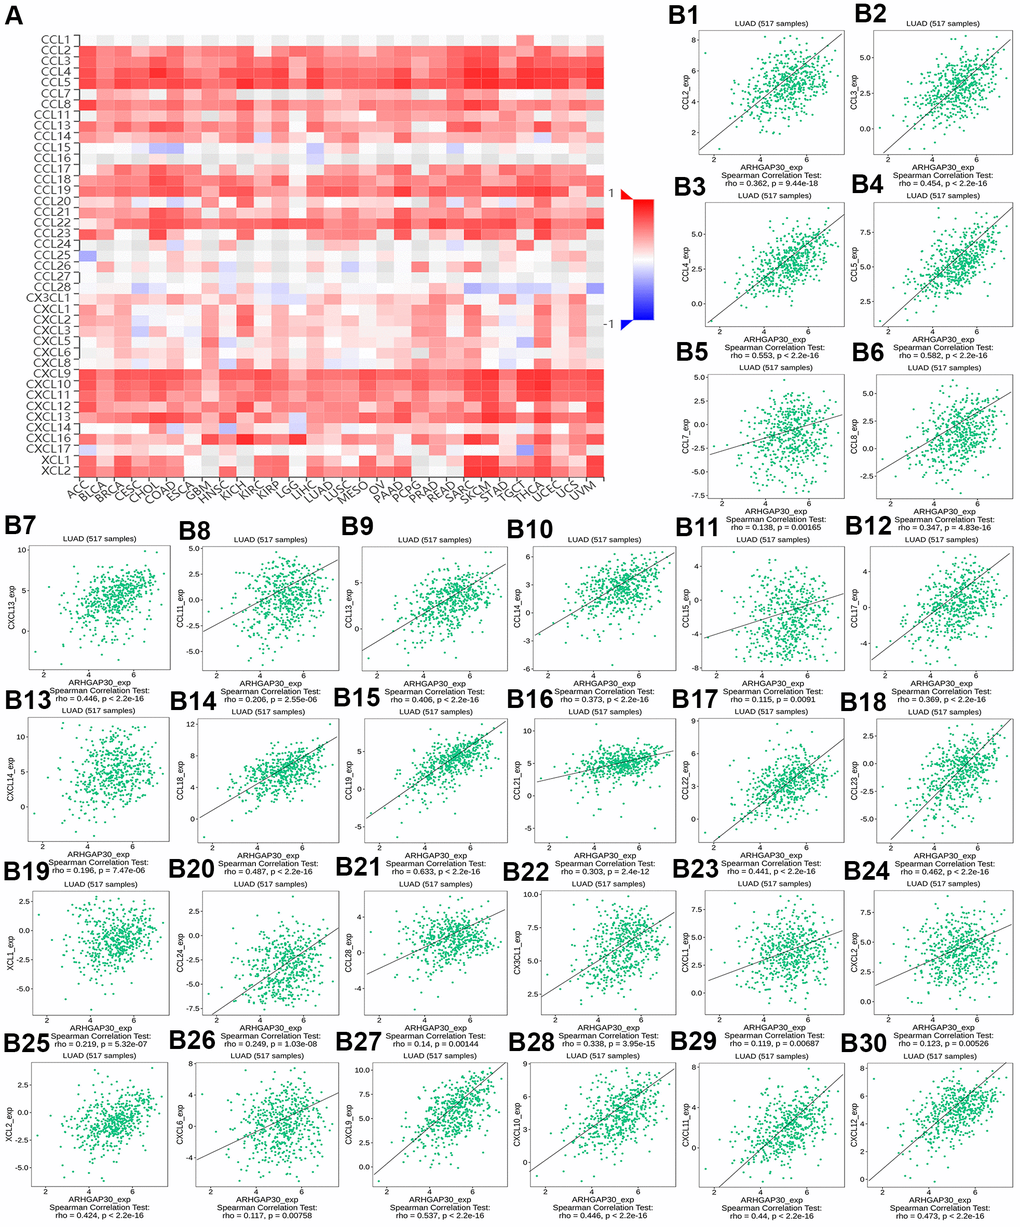
Figure 11. The correlation between the DNA methylation of ARHGAP30 and immune inhibitors. (A) Heat map of Spearman correlations between DNA methylation of ARHGAP30 and immune inhibitors across human cancers. (B1–B30) Scatter plots showing the negative correlation between DNA methylation of ARHGAP30 and immune inhibitors in the treatment of lung adenocarcinoma.
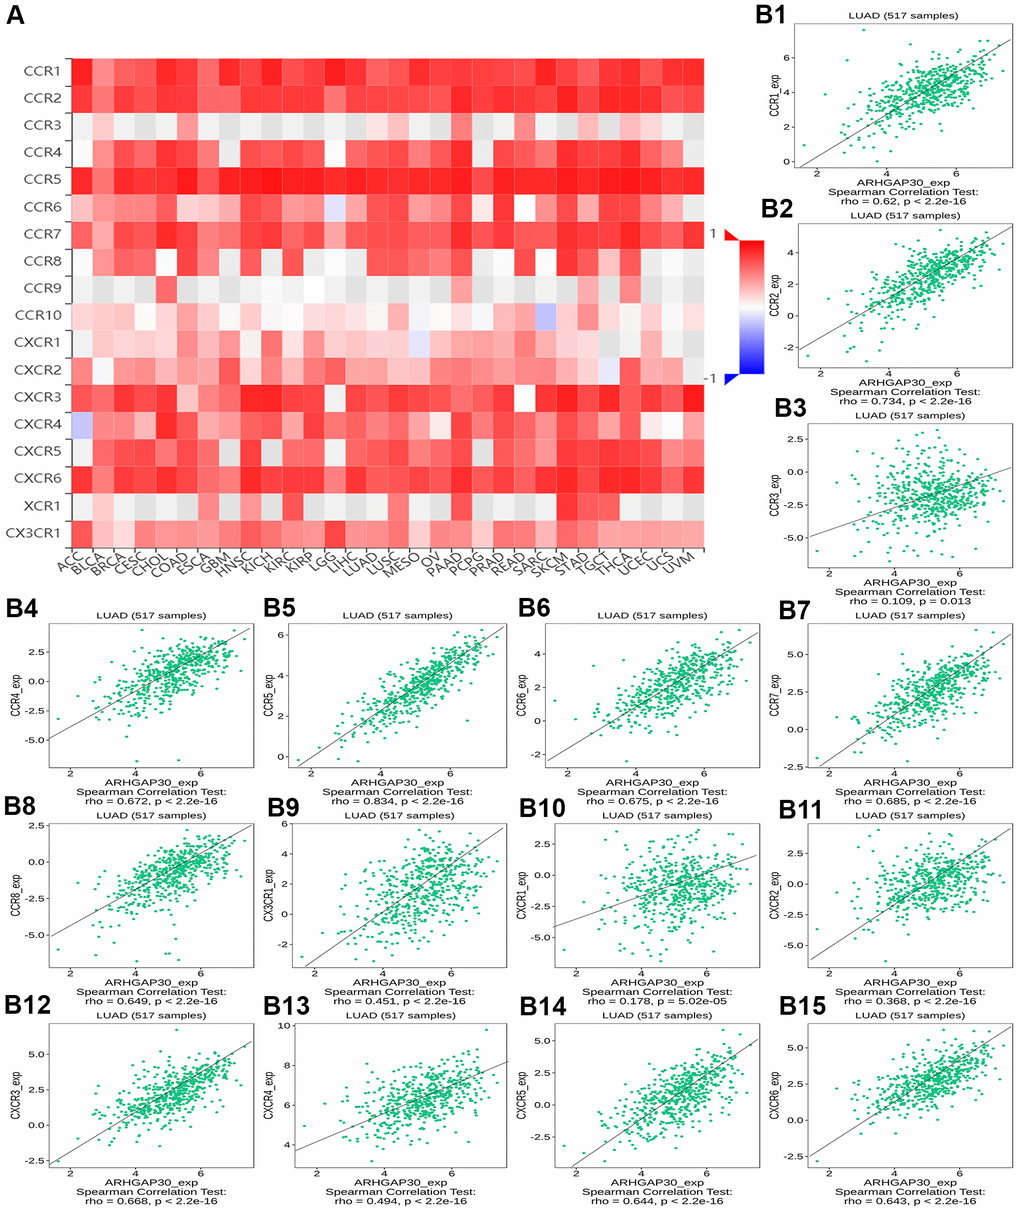
Figure 12. The correlation between the expression of ARHGAP30 and immunostimulators. (A) Heat map of Spearman correlations between ARHGAP30 expression and immunostimulators across human cancers. (B1–B15) Scatter plots showing the positive correlation between ARHGAP30 expression and immunostimulators in the treatment of lung adenocarcinoma.
Figure 8B1–8B28 show scatter plots of the relations the abundance of TILs and ARHGAP30 expression. The results showed that effector memory CD8 T cells, T follicular helper cells, type 1 T helper cells, regulatory T cells, myeloid derived suppressor cells, activated B cells, immature B cells, natural killer cells, natural killer T cells, macrophages, eosinophils, and mast cells showed a strong positive correlation with the expression of ARHGAP30 in LUAD (Spearman correlation coefficient, r > 0.6; p value < 0.01). Figure 9B1–9B39 shows scatter plots of the relationship between the abundance of immunostimulators and ARHGAP30 expression. The results showed that C10orf54, CD28, CD40LG, CD48, CD80, CD86, ICOS, KLRK1, LTA, and TNFRSF8 showed a strong positive correlation with the expression of ARHGAP30 in LUAD (Spearman correlation coefficient, r > 0.6; p value < 0.01). Figure 10B1–10B21 show scatter plots of the relationship between the abundance of MHC molecules and ARHGAP30 expression. The results showed that HLA-DMB, HLA-DOA, HLA-DPA1, HLA-DPB1, HLA-DQA1, and HLA-DRA showed a strong positive correlation with the expression of ARHGAP30 in LUAD (Spearman correlation coefficient, r > 0.6; p value < 0.01). Figure 11B1–11B30 show scatter plots of the relationship between the abundance of chemokines and ARHGAP30 expression. The results showed that CCL19 showed a strong positive correlation with the expression of ARHGAP30 in LUAD (Spearman correlation coefficient, r > 0.6; p value < 0.01). Figure 12B1–12B15 show scatter plots of the relationship between the abundance of chemokine receptors and ARHGAP30 expression. The results showed that CCR1, CCR2, CCR4, CCR5, CCR6, CCR7, CCR8, CXCR3, CXCR5, and CXCR6 showed a strong positive correlation with the expression of ARHGAP30 in LUAD (Spearman correlation coefficient, r > 0.6; p value < 0.01).
The relationship between DNA methylation of ARHGAP30 and TILs, immunostimulators, MHC molecules, chemokines, and chemokine receptors in LUAD
Figures 13A and Supplementary Figures 10A, 11A, 12A, 13A, respectively, show heat maps of the relationship between TILs, immunostimulators, MHC molecules, chemokines, and chemokine receptors and DNA methylation of ARHGAP30. The results showed that in LUAD, most of them were blue, indicating that most of the TILs, immunostimulators, MHC molecules, chemokines, and chemokine receptors correlated negatively with DNA methylation of ARHGAP30. Also, some of them were very dark blue, indicating that they had a strong negative correlation with DNA methylation of ARHGAP30.
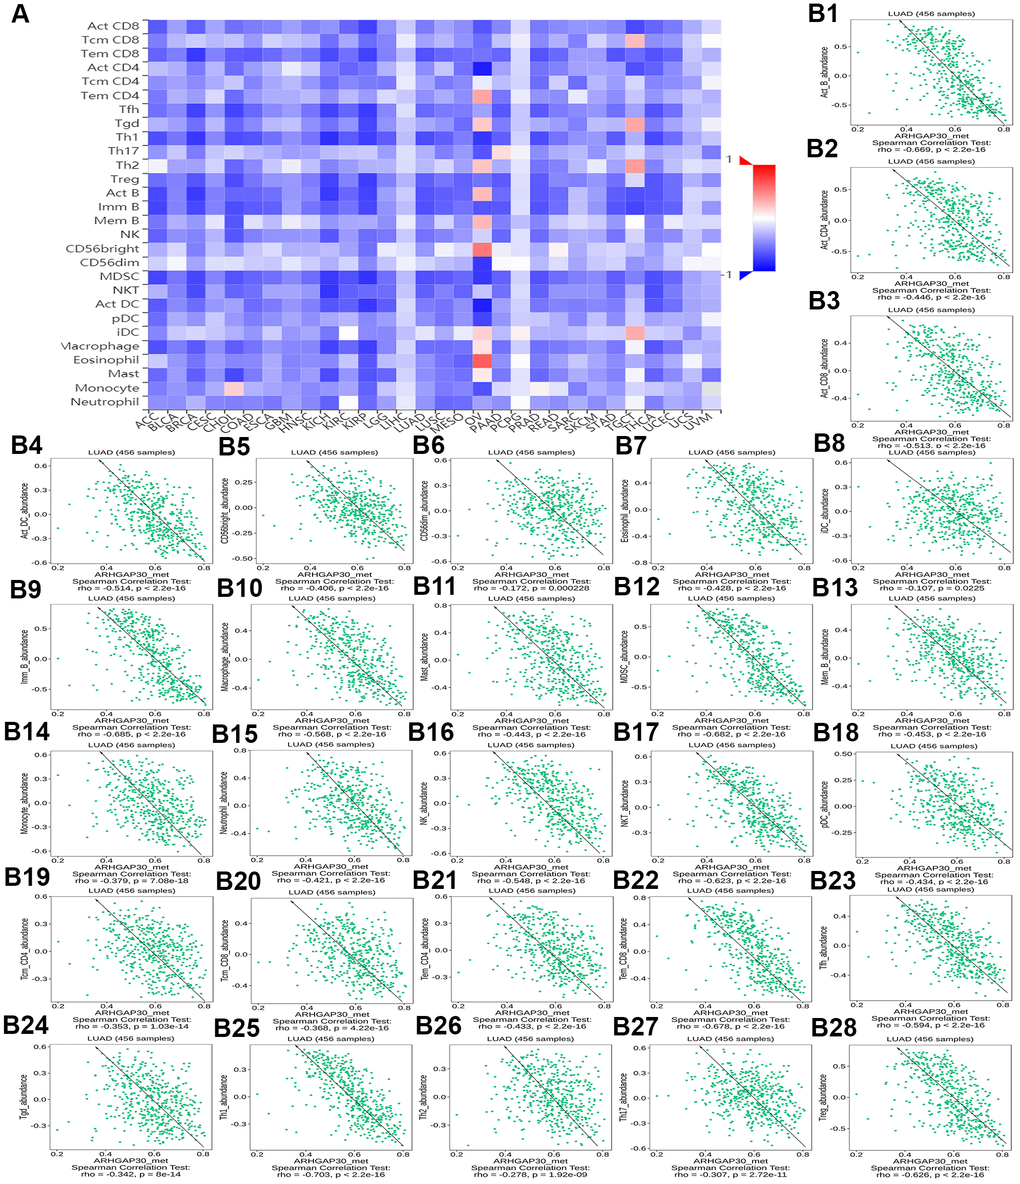
Figure 13. The correlation between the DNA methylation of ARHGAP30 and Immunostimulators. (A) Heat map of Spearman correlations between DNA methylation of ARHGAP30 and immunostimulators across human cancers. (B1–B28) Scatter plots showing the negative correlation between DNA methylation of ARHGAP30 and immunostimulators in the treatment of lung adenocarcinoma.
Figure 13B1–13B28 show scatter plots of the relationship between the abundance of TILs and DNA methylation of ARHGAP30. The results showed that activated B cell, immature B cell, myeloid derived suppressor cell, natural killer T cell, effector memory CD8 T cell, type 1 T helper cell, and regulatory T cell had a strong negative correlation with the DNA methylation of ARHGAP30 in LUAD (Spearman correlation coefficient, r < - 0.6; p value < 0.01). Supplementary Figure 10B1–10B39 show scatter plots of the relationship between the abundance of immunostimulators and DNA methylation of ARHGAP30. The results showed that CD28, CD48, LTA, and TNFRSF8 had a strong negative correlation with the DNA methylation of AGHGAP30 in LUAD (Spearman correlation coefficient, r < - 0.6; p value < 0.01). Supplementary Figure 11B1–11B21 show scatter plots of the relationship between the abundance of MHC molecules and DNA methylation of ARHGAP30. Supplementary Figure 12B1–12B30 show scatter plots of the relationship between the abundance of chemokines and DNA methylation of ARHGAP30. Supplementary Figure 13B1–13B15 show scatter plots of the relationship between the abundance of chemokine receptors and DNA methylation of ARHGAP30. The results showed that CCR5 and CCR6 had a strong negative correlation with the DNA methylation of ARHGAP30 in LUAD (Spearman correlation coefficient, r < - 0.6; p value < 0.01).
Discussion and conclusions
In this study, we showed that the expression of ARHGAP30 in LUAD tissues was significantly lower than that in normal tissues. There were differences in ARHGAP30 mRNA expression levels in patients with LUAD with different sexes, cancer stages, and nodal metastatic status (Figure 1). The expression of ARHGAP30 in LUAD tissues was significantly lower in the presence of KEAP1 and STK11 mutations. The correlation between DNA methylation of ARHGAP30 and its mRNA expression levels was considerably higher in LUAD tissues than in normal tissues (Figure 2). There are some studies on the differential expression of ARHGAP30 in cancer [8, 34, 35]. The high DNA methylation level of ARHGAP30 might also be one of the reasons for the decreased ARHGAP30 expression in LUAD tissues. Genetic mutations in KEAP1 and STK11 might also be another reason for decreased expression of ARHGAP30 in LUAD tissues. These were not reported in previous studies.
Patients with LUAD with low ARHGAP30 expression had a significantly better prognosis than those with high ARHGAP30 expression (Figure 3). A study by Mao and Tong [35] also supports this point. Although some prognostic molecular markers have been found in patients with LUAD [36–43], ARHGAP30 might be developed as a molecular marker to evaluate the prognosis of patients with LUAD after surgery or in patients with advanced disease. We identified genes, miRNAs, and lncRNAs that were highly associated with ARHGAP30 in LUAD (Figures 4–6), which could provide new ideas and targets for epigenetic studies of ARHGAP30 in LUAD.
We identified many pathways related to tumor immunity from the enrichment results of KEGG Pathway, Panther Pathway, Reactome Pathway, and Wikipathway (Figures 7, 14 and Supplementary Figures 1–3). Recent studies have demonstrated a close relationship between Rho GTPases and the development and metastasis of a variety of human tumors [7]. KEGG pathways included Primary immunodeficiency, Th1 and Th2 cell differentiation, Chemokine signaling pathway, T cell receptor signaling pathway, Th17 cell differentiation, and Fc gamma R-mediated phagocytosis. Panther pathways included T cell activation, B cell activation, Inflammation mediated by chemokine and cytokine signaling pathway, Interleukin signaling pathway and Toll receptor signaling pathway. Reactome Pathways Defensins, Translocation of ZAP-70 to Immunological synapse, Generation of second messenger molecules, Costimulation by the CD28 family, PD-1 signaling, Interleukin-2 family signaling, Interleukin-10 signaling, Interleukin-3, Interleukin-5 and GM-CSF signaling, DAP12 inter-actions, Immunoregulatory interactions between a Lymphoid and a non-Lymphoid cell, Phosphorylation of CD3 and TCR zeta chains, DAP12 signaling, Interleukin receptor SHC signaling, Antigen activates B Cell Receptor (BCR) leading to generation of second messengers, RHO GTPases Activate NADPH Oxidases, Chemokine receptors bind chemokines, Interferon gamma signaling and Regulation of actin dynamics for phagocytic cup formation. Wikipathways included T-Cell antigen Receptor (TCR) Signaling Pathway, T-Cell antigen Receptor (TCR) pathway during Staphylococcus aureus infection, Allograft Rejection, IL-3 Signaling Pathway, Type II interferon signaling (IFNG), Interactions between immune cells and microRNAs in tumor microenvironment, Cancer immunotherapy by PD-1 blockade, IL-2 Signaling Pathway, IL-9 Signaling Pathway, IL-7 Signaling Pathway, Macrophage markers, Chemokine signaling pathway, Selective expression of chemokine receptors during T-cell polarization, Cancer immunotherapy by CTLA4 blockade, T-Cell Receptor and Co-stimulatory Signaling, B Cell Receptor Signaling Pathway, Inflammatory Response Pathway, and IL-5 Signaling Pathway.
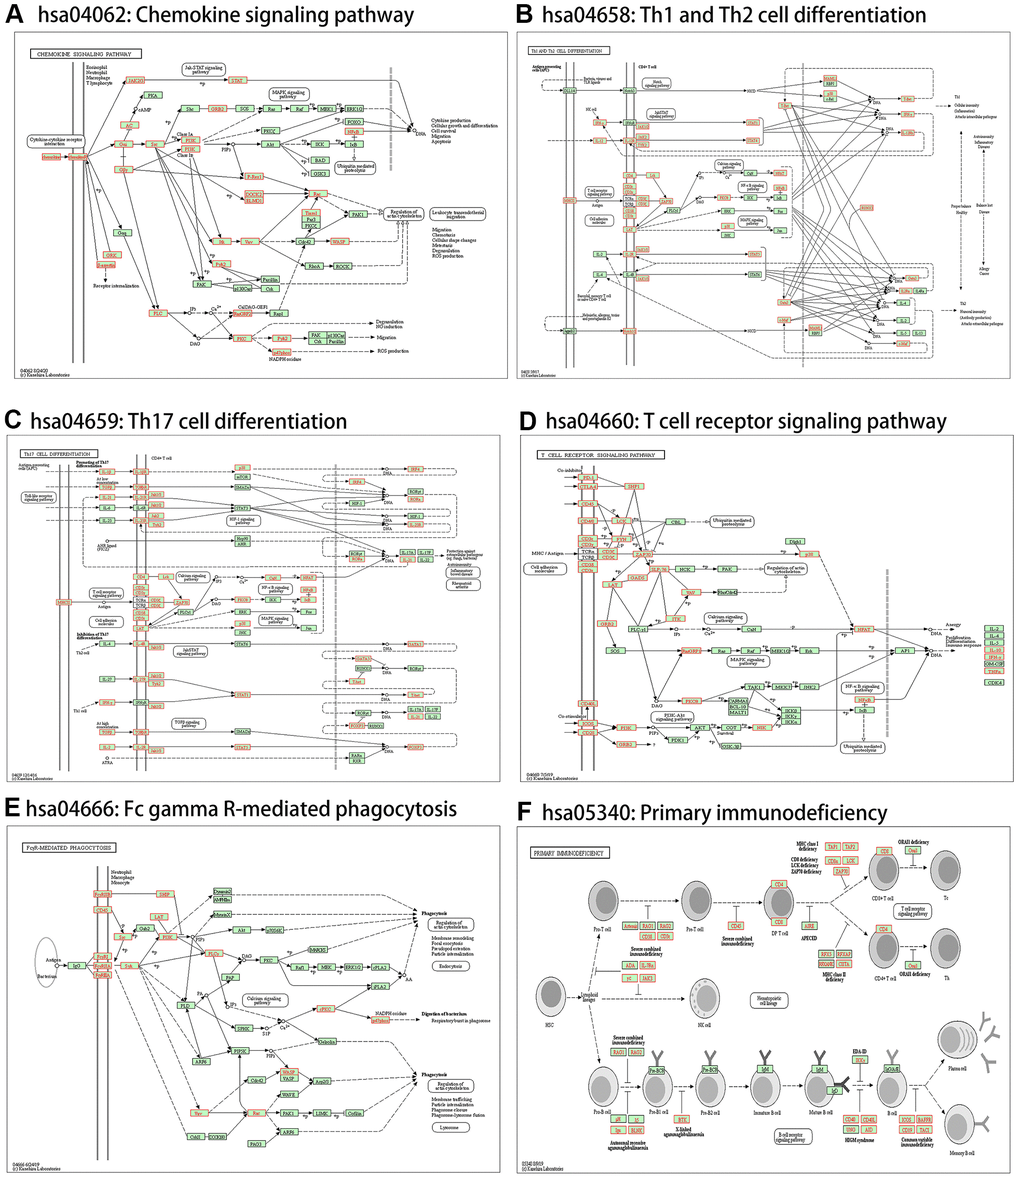
Figure 14. Immune-related statistically significant KEGG pathway annotations. (A) Chemokine signaling pathway (hsa04062). (B) Th1 and Th2 cell differentiation (hsa04658). (C) Th17 cell differentiation (hsa04659). (D) T cell receptor signaling pathway (hsa04660). (E) Fc gamma R-mediated phagocytosis (hsa04666). (F) Primary immunodeficiency (hsa05340). Red denotes leading-edge genes; green denotes the remaining genes.
We further observed that the levels of TILs, immunostimulators, MHC molecules, chemokines, chemokine receptors and ARHGAP30 expression correlated positively in LUAD (Figures 8–13); however, these factors correlated negatively with the DNA methylation level of ARHGAP30 (Supplementary Figures 10–13). Anti-tumor immunotherapy is promising treatment modality in the fight against tumors; however, previous application found that its efficacy was not as good as expected. Through in-depth studies, it has been found that immune tolerance in the tumor microenvironment might be the most important reason leading to the unsatisfactory effects of immunotherapy [44, 45]. Defects in the development or function of CD8+ cytotoxic T lymphocytes (CTLs), CD4+ Th1 helper T cells, or natural killer (NK) cells all lead to more frequent tumorigenesis and/or more rapid growth [46]. Immunostimulators could accumulate in tumors and significantly inhibit tumor growth [47]. A tumor can escape T cell reactions by losing major histocompatibility complex (MHC) molecules [48]. Chemokines and chemokine receptors mediate the host response to cancer by directing leukocytes into the tumor microenvironment [49, 50]. Our results supported the above points. ARHGAP30 expression correlated positively with TILs, immunostimulators, MHC molecules, chemokines, and chemokine receptors in LUAD (Figures 8–12), which might be related to the significantly reduced ARHGAP30 expression in LUAD. Levels of TILs, immunostimulators, MHC molecules, chemokines, and chemokine receptors were decreased in LUAD. Reduced or functional defects in tumor immune function result in more frequent occurrence and more rapid proliferation and growth of LUAD.
Therefore, we proposed that DNA methylation of ARHGAP30 and mutations in KEAP1 and STK11 genes inhibit ARHGAP30 expression in LUAD. Decreased ARHGAP30 expression might inhibit TILs, immunostimulators, MHC molecules, chemokines, and chemokine receptors in lung adenocarcinoma through pathways identified in the enrichment analysis, which in turn inhibits tumor immunity and ultimately promotes the formation and growth of LUAD.
Our study is the first to perform prognostic analysis and evaluation of ARHGAP30 in patients with LUAD, to carry out GSEA of ARHGAP30, and to investigate the relationship between ARHGAP30 and TILs, immunostimulators, MHC molecules, chemokines, and chemokine receptors in LUAD. These findings have important implications for the diagnosis, prognostic evaluation, and cancer immunotherapy of patients with LUAD Our study was limited by a lack of further experimental validation. We could also assess the relationship of ARHGAP30 with other types of lung cancer to determine the specific role of ARHGAP30 expression in the diagnosis and treatment of different types of lung cancer.
Overall, our results suggest that DNA methylation of ARHGAP30, as well as mutations in KEAP1 and STK11, inhibit ARHGAP30 expression in LUAD, which in turn promotes LUAD formation and growth through multiple pathways that suppress tumor infiltrating immunity, thus contributing to poor prognosis of patients with LUAD.
Materials and Methods
We used the Oncomine 4.5 [10] database to analyze the differential expression of ARHGAP30 in various cancers and in the Hou lung, Selamat lung, and Okayama lung adenocarcinoma datasets. We used the SurvExpress [11] database to analyze the differential expression of ARHGAP30 in two lung adenocarcinoma datasets. We used the GEPIA [12] database to analyze the differential expression of ARHGAP30 in lung adenocarcinoma. We used the Warner [13] database to explore the abundance of different exons of the ARHGAP30 gene in normal and tumor tissues of patients with LUAD. We used the Ualcan [14] database to analyze the differences of ARHGAP30 mRNA expression in subgroups of patients with lung adenocarcinoma patients according to sample type, individual cancer stage, ethnicity, sex, age, smoking habit, nodal metastasis status, and TP53 mutation status. We used the Ualcan [14] and CPTAC [15] databases to analyze the differential expression of ARHGAP30 protein in patients with LUAD stratified by sample type, individual cancer stage, ethnicity, sex, age, weight, tumor grade, and tumor histology.
We used the TCGA portal [16] database to analyze the differential expression of ARHGAP30 after highly mutated gene mutation. We also used the TCGA portal database to analyze the correlation between ARHGAP30 gene expression and DNA methylation in primary tumors and normal tissue samples. We analyzed the mRNA expression of ARHGAP30 in LUAD before and after mutation of highly mutated genes (KEAP1, STK11) using the Linkedomics [17] database. We analyzed the heatmap of ARHGAP30 methylation in lung adenocarcinoma using the MethSurv [18] database. The Kaplan–Meier plots of patients with LUAD assessed using different ARHGAP30 methylation probes (cg07837534 and cg00045607) were analyzed.
We used GEPIA [12], Oncolnc [19], Ualcan [14], UCSC [20], TCGAportal [16], TISIDB [21], KMplot [22], TIMER [23], Linkedomics [17], and PrognoScan [24] databases to analyze the overall survival (OS) curves for patients with LUAD. We used the GEPIA [12] database to analyze the disease-free survival (DFS) curves for patients with LUAD (in months and days, respectively). We used the PrognoScan database to analyze the recurrence-free survival (RFS) curves in patients with LUAD.
We analyzed the genes and mRNAs that were highly associated with ARHGAP30 in LUAD using the Linkedomics [17] database and obtained the corresponding volcano plots, heat plots, and scatter plots. We analyzed the lncRNAs that were highly associated with ARHGAP30 in LUAD using the TANRIC [25] database and obtained the corresponding scatter plots and survival curves.
We used the TISIDB [21] database to analyze the relationship between TILs, immunostimulators, MHC molecules, chemokines, chemokine receptors and the expression and DNA methylation of ARHGAP30 in LUAD.
Statistical methods
We used a t-test to analyze the differential expression levels of ARHGAP30 in normal and tumor samples. We analyzed the DNA methylation expression levels of ARHGAP30 in normal and tumor samples using the Wilcoxon rank sum test. We used Pearson correlation [51–54] to analyze ARHGAP30-associated genes, miRNAs, and lncRNAs. We performed survival analysis and plotted Kaplan–Meier curves for ARHGAP30. We performed gene set enrichment analysis (GSEA) [26] of ARHGAP30 for KEGG Pathway [27], Panther Pathway [28], Reactome Pathway [29], Wikipathway [30], Gene ontology Biological Process [31, 32], Gene ontology Cellular Component [31, 32], Gene ontology Molecular Function [31, 32], Kinase Target Network, Transcription Factor Network, and PPI BIOGRID Network [33].
Ethics approval and declaration
This study was approved by the academic ethics review board of the Second Affiliated Hospital of Nanchang University. Human participants and research animals were not involved in this study. All software applications are freely and publicly available without custom code. All data in this article were obtained from publicly available databases, and all the data and pictures in this article are authorized.
Author Contributions
Conceptualization, S.H. and YP.W.; methodology, S.H., JY. Y, WB. Z, WX. Z, Y.Z, DY. Z, JJ.X, DL.Y, YP. W, J.P; software, S.H.; validation, X.X., Y.Y. and Z.Z.; formal analysis, S.H.; investigation, S.H.; resources, S.H.; data curation, S.H.; writing—original draft preparation, S.H., JY. Y, WB. Z, WX. Z, Y.Z, DY. Z, JJ.X, DL.Y, YP. W, J.P; writing—review and editing, S.H., YP. W., JH. P; visualization, S.H.; supervision, S.H., YP. W., JH. P.; project administration, S.H., YP. W., JH. P.; funding acquisition, YP.W.
Acknowledgments
We are grateful to the staff from the Department of Thoracic Surgery of the Second Affiliated Hospital of Nanchang University, China for their support during the preparation of this manuscript.
Conflicts of Interest
The authors declare that they have no conflicts of interest.
Funding
This work was supported by grants from the National Natural Science Foundation of China [grant number 81860379], the Preeminence Youth Fund of Jiangxi Province [grant number 20162BCB23058], and the Natural Science Foundation of Jiangxi Province, China [grant number 20171BAB 205075].
References
- 1. Bray F, Ferlay J, Soerjomataram I, Siegel RL, Torre LA, Jemal A. Global cancer statistics 2018: GLOBOCAN estimates of incidence and mortality worldwide for 36 cancers in 185 countries. CA Cancer J Clin. 2018; 68:394–424. https://doi.org/10.3322/caac.21492 [PubMed]
- 2. Bade BC, Dela Cruz CS. Lung Cancer 2020: Epidemiology, Etiology, and Prevention. Clin Chest Med. 2020; 41:1–24. https://doi.org/10.1016/j.ccm.2019.10.001 [PubMed]
- 3. Govindan R, Page N, Morgensztern D, Read W, Tierney R, Vlahiotis A, Spitznagel EL, Piccirillo J. Changing epidemiology of small-cell lung cancer in the United States over the last 30 years: analysis of the surveillance, epidemiologic, and end results database. J Clin Oncol. 2006; 24:4539–44. https://doi.org/10.1200/JCO.2005.04.4859 [PubMed]
- 4. Etienne-Manneville S, Hall A. Rho GTPases in cell biology. Nature. 2002; 420:629–35. https://doi.org/10.1038/nature01148 [PubMed]
- 5. Sah VP, Seasholtz TM, Sagi SA, Brown JH. The role of Rho in G protein-coupled receptor signal transduction. Annu Rev Pharmacol Toxicol. 2000; 40:459–89. https://doi.org/10.1146/annurev.pharmtox.40.1.459 [PubMed]
- 6. Naji L, Pacholsky D, Aspenström P. ARHGAP30 is a Wrch-1-interacting protein involved in actin dynamics and cell adhesion. Biochem Biophys Res Commun. 2011; 409:96–102. https://doi.org/10.1016/j.bbrc.2011.04.116 [PubMed]
- 7. Heasman SJ, Ridley AJ. Mammalian Rho GTPases: new insights into their functions from in vivo studies. Nat Rev Mol Cell Biol. 2008; 9:690–701. https://doi.org/10.1038/nrm2476 [PubMed]
- 8. Zhou Y, Hua Z, Zhu Y, Wang L, Chen F, Shan T, Zhou Y, Dai T. Upregulation of ARHGAP30 attenuates pancreatic cancer progression by inactivating the β-catenin pathway. Cancer Cell Int. 2020; 20:225. https://doi.org/10.1186/s12935-020-01288-7 [PubMed]
- 9. Wang J, Qian J, Hu Y, Kong X, Chen H, Shi Q, Jiang L, Wu C, Zou W, Chen Y, Xu J, Fang JY. ArhGAP30 promotes p53 acetylation and function in colorectal cancer. Nat Commun. 2014; 5:4735. https://doi.org/10.1038/ncomms5735 [PubMed]
- 10. Rhodes DR, Kalyana-Sundaram S, Mahavisno V, Varambally R, Yu J, Briggs BB, Barrette TR, Anstet MJ, Kincead-Beal C, Kulkarni P, Varambally S, Ghosh D, Chinnaiyan AM. Oncomine 3.0: genes, pathways, and networks in a collection of 18,000 cancer gene expression profiles. Neoplasia. 2007; 9:166–80. https://doi.org/10.1593/neo.07112 [PubMed]
- 11. Aguirre-Gamboa R, Gomez-Rueda H, Martínez-Ledesma E, Martínez-Torteya A, Chacolla-Huaringa R, Rodriguez-Barrientos A, Tamez-Peña JG, Treviño V. SurvExpress: an online biomarker validation tool and database for cancer gene expression data using survival analysis. PLoS One. 2013; 8:e74250. https://doi.org/10.1371/journal.pone.0074250 [PubMed]
- 12. Tang Z, Li C, Kang B, Gao G, Li C, Zhang Z. GEPIA: a web server for cancer and normal gene expression profiling and interactive analyses. Nucleic Acids Res. 2017; 45:W98–102. https://doi.org/10.1093/nar/gkx247 [PubMed]
- 13. Díez-Villanueva A, Mallona I, Peinado MA. Wanderer, an interactive viewer to explore DNA methylation and gene expression data in human cancer. Epigenetics Chromatin. 2015; 8:22. https://doi.org/10.1186/s13072-015-0014-8 [PubMed]
- 14. Chandrashekar DS, Bashel B, Balasubramanya SA, Creighton CJ, Ponce-Rodriguez I, Chakravarthi BV, Varambally S. UALCAN: A Portal for Facilitating Tumor Subgroup Gene Expression and Survival Analyses. Neoplasia. 2017; 19:649–58. https://doi.org/10.1016/j.neo.2017.05.002 [PubMed]
- 15. Chen F, Chandrashekar DS, Varambally S, Creighton CJ. Pan-cancer molecular subtypes revealed by mass-spectrometry-based proteomic characterization of more than 500 human cancers. Nat Commun. 2019; 10:5679. https://doi.org/10.1038/s41467-019-13528-0 [PubMed]
- 16. Xu S, Feng Y, Zhao S. Proteins with Evolutionarily Hypervariable Domains are Associated with Immune Response and Better Survival of Basal-like Breast Cancer Patients. Comput Struct Biotechnol J. 2019; 17:430–40. https://doi.org/10.1016/j.csbj.2019.03.008 [PubMed]
- 17. Vasaikar SV, Straub P, Wang J, Zhang B. LinkedOmics: analyzing multi-omics data within and across 32 cancer types. Nucleic Acids Res. 2018; 46:D956–63. https://doi.org/10.1093/nar/gkx1090 [PubMed]
- 18. Modhukur V, Iljasenko T, Metsalu T, Lokk K, Laisk-Podar T, Vilo J. MethSurv: a web tool to perform multivariable survival analysis using DNA methylation data. Epigenomics. 2018; 10:277–88. https://doi.org/10.2217/epi-2017-0118 [PubMed]
- 19. Jordan A. Guide to using OncoLnc, a new TCGA data portal. 2016.
- 20. Goldman MJ, Craft B, Hastie M, Repečka K, McDade F, Kamath A, Banerjee A, Luo Y, Rogers D, Brooks AN, Zhu J, Haussler D. Visualizing and interpreting cancer genomics data via the Xena platform. Nat Biotechnol. 2020; 38:675–78. https://doi.org/10.1038/s41587-020-0546-8 [PubMed]
- 21. Ru B, Wong CN, Tong Y, Zhong JY, Zhong SS, Wu WC, Chu KC, Wong CY, Lau CY, Chen I, Chan NW, Zhang J. TISIDB: an integrated repository portal for tumor-immune system interactions. Bioinformatics. 2019; 35:4200–202. https://doi.org/10.1093/bioinformatics/btz210 [PubMed]
- 22. Nagy Á, Munkácsy G, Győrffy B. Pancancer survival analysis of cancer hallmark genes. Sci Rep. 2021; 11:6047. https://doi.org/10.1038/s41598-021-84787-5 [PubMed]
- 23. Li T, Fan J, Wang B, Traugh N, Chen Q, Liu JS, Li B, Liu XS. TIMER: A Web Server for Comprehensive Analysis of Tumor-Infiltrating Immune Cells. Cancer Res. 2017; 77:e108–10. https://doi.org/10.1158/0008-5472.CAN-17-0307 [PubMed]
- 24. Mizuno H, Kitada K, Nakai K, Sarai A. PrognoScan: a new database for meta-analysis of the prognostic value of genes. BMC Med Genomics. 2009; 2:18. https://doi.org/10.1186/1755-8794-2-18 [PubMed]
- 25. Li J, Han L, Roebuck P, Diao L, Liu L, Yuan Y, Weinstein JN, Liang H. TANRIC: An Interactive Open Platform to Explore the Function of lncRNAs in Cancer. Cancer Res. 2015; 75:3728–37. https://doi.org/10.1158/0008-5472.CAN-15-0273 [PubMed]
- 26. Subramanian A, Tamayo P, Mootha VK, Mukherjee S, Ebert BL, Gillette MA, Paulovich A, Pomeroy SL, Golub TR, Lander ES, Mesirov JP. Gene set enrichment analysis: a knowledge-based approach for interpreting genome-wide expression profiles. Proc Natl Acad Sci USA. 2005; 102:15545–50. https://doi.org/10.1073/pnas.0506580102 [PubMed]
- 27. Kanehisa M, Sato Y. KEGG Mapper for inferring cellular functions from protein sequences. Protein Sci. 2020; 29:28–35. https://doi.org/10.1002/pro.3711 [PubMed]
- 28. Mi H, Thomas P. PANTHER pathway: an ontology-based pathway database coupled with data analysis tools. Methods Mol Biol. 2009; 563:123–40. https://doi.org/10.1007/978-1-60761-175-2_7 [PubMed]
- 29. Jassal B, Matthews L, Viteri G, Gong C, Lorente P, Fabregat A, Sidiropoulos K, Cook J, Gillespie M, Haw R, Loney F, May B, Milacic M, et al. The reactome pathway knowledgebase. Nucleic Acids Res. 2020; 48:D498–503. https://doi.org/10.1093/nar/gkz1031 [PubMed]
- 30. Martens M, Ammar A, Riutta A, Waagmeester A, Slenter DN, Hanspers K, Miller RA, Digles D, Lopes EN, Ehrhart F, Dupuis LJ, Winckers LA, Coort SL, et al. WikiPathways: connecting communities. Nucleic Acids Res. 2021; 49:D613–21. https://doi.org/10.1093/nar/gkaa1024 [PubMed]
- 31. Gene Ontology Consortium. The Gene Ontology resource: enriching a GOld mine. Nucleic Acids Res. 2021; 49:D325–34. https://doi.org/10.1093/nar/gkaa1113 [PubMed]
- 32. Ashburner M, Ball CA, Blake JA, Botstein D, Butler H, Cherry JM, Davis AP, Dolinski K, Dwight SS, Eppig JT, Harris MA, Hill DP, Issel-Tarver L, et al. Gene ontology: tool for the unification of biology. Nat Genet. 2000; 25:25–29. https://doi.org/10.1038/75556 [PubMed]
- 33. Stark C, Breitkreutz BJ, Reguly T, Boucher L, Breitkreutz A, Tyers M. BioGRID: a general repository for interaction datasets. Nucleic Acids Res. 2006; 34:D535–39. https://doi.org/10.1093/nar/gkj109 [PubMed]
- 34. Wang JL, Guo CR, Sun TT, Su WY, Hu Q, Guo FF, Liang LX, Xu J, Xiong H, Fang JY. SRSF3 functions as an oncogene in colorectal cancer by regulating the expression of ArhGAP30. Cancer Cell Int. 2020; 20:120. https://doi.org/10.1186/s12935-020-01201-2 [PubMed]
- 35. Mao X, Tong J. ARHGAP30 suppressed lung cancer cell proliferation, migration, and invasion through inhibition of the Wnt/β-catenin signaling pathway. Onco Targets Ther. 2018; 11:7447–57. https://doi.org/10.2147/OTT.S175255 [PubMed]
- 36. Hu S, Zeng W, Zhang W, Xu J, Yu D, Peng J, Wei Y. KIAA0101 as a new diagnostic and prognostic marker, and its correlation with gene regulatory networks and immune infiltrates in lung adenocarcinoma. Aging (Albany NY). 2020; 13:301–39. https://doi.org/10.18632/aging.104144 [PubMed]
- 37. Timsah Z, Berrout J, Suraokar M, Behrens C, Song J, Lee JJ, Ivan C, Gagea M, Shires M, Hu X, Vallien C, Kingsley CV, Wistuba I, Ladbury JE. Expression pattern of FGFR2, Grb2 and Plcγ1 acts as a novel prognostic marker of recurrence recurrence-free survival in lung adenocarcinoma. Am J Cancer Res. 2015; 5:3135–48. [PubMed]
- 38. Wang L, Meng Y, Zhang QY. LAPTM4B is a novel diagnostic and prognostic marker for lung adenocarcinoma and associated with mutant EGFR. BMC Cancer. 2019; 19:293. https://doi.org/10.1186/s12885-019-5506-7 [PubMed]
- 39. Wang D, Jia Y, Zheng W, Li C, Cui W. Overexpression of eIF3D in Lung Adenocarcinoma Is a New Independent Prognostic Marker of Poor Survival. Dis Markers. 2019; 2019:6019637. https://doi.org/10.1155/2019/6019637 [PubMed]
- 40. Zhao J, Cheng M, Gai J, Zhang R, Du T, Li Q. SPOCK2 Serves as a Potential Prognostic Marker and Correlates With Immune Infiltration in Lung Adenocarcinoma. Front Genet. 2020; 11:588499. https://doi.org/10.3389/fgene.2020.588499 [PubMed]
- 41. Zhao S, Gao X, Zang S, Li Y, Feng X, Yuan X. MicroRNA-383-5p acts as a prognostic marker and inhibitor of cell proliferation in lung adenocarcinoma by cancerous inhibitor of protein phosphatase 2A. Oncol Lett. 2017; 14:3573–79. https://doi.org/10.3892/ol.2017.6603 [PubMed]
- 42. Gao L, Qiu H, Liu J, Ma Y, Feng J, Qian L, Zhang J, Liu Y, Bian T. KLF15 promotes the proliferation and metastasis of lung adenocarcinoma cells and has potential as a cancer prognostic marker. Oncotarget. 2017; 8:109952–61. https://doi.org/10.18632/oncotarget.21972 [PubMed]
- 43. Liu HY, Zhao H, Li WX. Integrated Analysis of Transcriptome and Prognosis Data Identifies FGF22 as a Prognostic Marker of Lung Adenocarcinoma. Technol Cancer Res Treat. 2019; 18:1533033819827317. https://doi.org/10.1177/1533033819827317 [PubMed]
- 44. Poggi A, Zocchi MR. Mechanisms of tumor escape: role of tumor microenvironment in inducing apoptosis of cytolytic effector cells. Arch Immunol Ther Exp (Warsz). 2006; 54:323–33. https://doi.org/10.1007/s00005-006-0038-7 [PubMed]
- 45. Liotta LA, Kohn EC. The microenvironment of the tumour-host interface. Nature. 2001; 411:375–79. https://doi.org/10.1038/35077241 [PubMed]
- 46. Hanahan D, Weinberg RA. Hallmarks of cancer: the next generation. Cell. 2011; 144:646–74. https://doi.org/10.1016/j.cell.2011.02.013 [PubMed]
- 47. Wu T, Qiao Q, Qin X, Zhang D, Zhang Z. Immunostimulatory cytokine and doxorubicin co-loaded nanovesicles for cancer immunochemotherapy. Nanomedicine. 2019; 18:66–77. https://doi.org/10.1016/j.nano.2019.02.008 [PubMed]
- 48. Garrido F, Aptsiauri N. Cancer immune escape: MHC expression in primary tumours versus metastases. Immunology. 2019; 158:255–66. https://doi.org/10.1111/imm.13114 [PubMed]
- 49. Chow MT, Luster AD. Chemokines in cancer. Cancer Immunol Res. 2014; 2:1125–31. https://doi.org/10.1158/2326-6066.CIR-14-0160 [PubMed]
- 50. Mollica Poeta V, Massara M, Capucetti A, Bonecchi R. Chemokines and Chemokine Receptors: New Targets for Cancer Immunotherapy. Front Immunol. 2019; 10:379. https://doi.org/10.3389/fimmu.2019.00379 [PubMed]
- 51. Győrffy B, Bottai G, Fleischer T, Munkácsy G, Budczies J, Paladini L, Børresen-Dale AL, Kristensen VN, Santarpia L. Aberrant DNA methylation impacts gene expression and prognosis in breast cancer subtypes. Int J Cancer. 2016; 138:87–97. https://doi.org/10.1002/ijc.29684 [PubMed]
- 52. Deng Y, Xu Y, Xu S, Zhang Y, Han B, Liu Z, Liu X, Zhu Z. Secondary data mining of GEO database for long non-coding RNA and Competing endogenous RNA network in keloid-prone individuals. Aging (Albany NY). 2020; 12:25076–89. https://doi.org/10.18632/aging.104054 [PubMed]
- 53. Kraft P, Schadt E, Aten J, Horvath S. A family-based test for correlation between gene expression and trait values. Am J Hum Genet. 2003; 72:1323–30. https://doi.org/10.1086/375167 [PubMed]
- 54. Jia D, Lin W, Tang H, Cheng Y, Xu K, He Y, Geng W, Dai Q. Integrative analysis of DNA methylation and gene expression to identify key epigenetic genes in glioblastoma. Aging (Albany NY). 2019; 11:5579–92. https://doi.org/10.18632/aging.102139 [PubMed]