


Introduction
Previous studies have shown that traditional clinical risk factors known to be associated with mortality risk, such as smoking, obesity, chronic diseases and comorbidity in the general adult population, lose their importance in old populations, typically older than 65 years. Instead, disability, poor physical and cognitive functions were more strongly predictive of mortality [1, 2]. This may be explained by the survival effect among individuals who remain alive while their contemporaries have already died in middle-age or younger-old age from smoking-, alcohol- and obesity-related diseases. Indeed, among very old people (over 75 s), paradoxical inverse mortality risks are sometimes found in association with obesity and cholesterol. Smokers, drinkers and obese individuals who survive into older age may perhaps have genetic and/or environmental characteristics that protect them against the toxic effects of harmful habits. Risk factors measured at old age may not reflect lifetime exposures since non-smoker and non-drinkers may have stopped their habits for health-related reasons, and there may have been significant weight changes previously.
Clinical measures of health and functional statuses such as cognition [3], depression [4], impaired pulmonary function [5], slow gait velocity [6] and frailty [7] have been investigated and consistently shown to predict mortality among older adults. These measures are not only related to specific chronic disease(s) or multi-morbidity, but also reflect the broad underlying intrinsic capacity of older people resulting from the interaction of physical and mental health declines. Few studies have evaluated various physical and functional measures together and compared their performance in predicting long-term mortality.
The Timed Up-and-Go test (TUG) is a widely used physical performance test of functional mobility in older persons, as it is easily performed without special equipment. It has high interrater and test-retest reliability [8]. TUG assesses static balance, dynamic balance, lower limbs strength [9, 10], and gait speed. Poor TUG performance has been linked to recurrent falls [11], impaired physical and cognitive function [12], poor quality of life [13], dementia [14] and frailty [15, 16]. Previous studies have shown that TUG predicts all-cause mortality of older adults [17–23].
In this study, we evaluated the predictive accuracy of TUG for long-term mortality and compared its performance with those of other commonly used measures of physical strength, balance and gait, functional mobility, global cognition and depression in a cohort of over-55-year-olds participating in the Singapore Longitudinal Aging Study 2 (SLAS-2) followed up for mortality risks up to 9 years (mean of 5.8 years). We hypothesized that the TUG has surpassing accuracy for predicting long-term mortality over gait velocity (measured on the fast gait test), knee extension strength (KES), the Performance-Oriented Mobility Assessment (POMA), the Mini-Mental State Examination (MMSE), depressive symptoms (measured by the Geriatric Depression Scale), forced expiratory volume - one second (FEV1), as well as frailty (Frailty Index and Physical Frailty phenotype) and multi-morbidity, which are two other clinical diagnoses known to predict mortality.
Results
The participants have a mean age of 66.6 ± 7.7 years. More than half of the participants were female (n = 1829, 62.9%), never smokers (n = 2276, 78.3%) and had hypertension (n = 1807, 62.2%). (Table 1) TUG was significantly correlated (p < 0.001) with GV (r = −0.593), KES (r = −0.238), POMA (r = −0.430) and MMSE (r = −0.326), as well as FEV1% (r = −0.133), GDS (r = 0.196), FI (r = 0.443), and physical frailty (r = 0.356). Up to 31 Dec 2016, a total of 111 (3.8%) participants died during a total follow up period of 16976.7 person-years. The principal causes of death were cancer (40%, including 12% lung cancer, 5% colorectal cancer), cardiovascular diseases (25%, including 10% stroke), pneumonia (15%), COPD (5%), kidney failure (2%).
We found that TUG was associated with significant mortality risk, whether it was analysed as a continuous variable or a binary categorical variable. The association of TUG and mortality in an unadjusted model has the HR of 2.6 (95% CI, 2.05–3.29, p < 0.001) per SD increase of TUG, and HR of 5.05 (95% CI, 3.27–7.80, p < 0.001) when analyzed as a binary variable (≥9 s vs. <9 s). It remained significantly associated with mortality even after adjusting for baseline sociodemographic, lifestyle risk factors, as well as comorbidities (HR = 1.64, 95% CI, 1.20–2.19, p < 0.001, per SD increase; HR = 2.66, 95% CI, 1.67–4.23, p < 0.001, TUG ≥9 s vs. <9 s). (Table 2A, 2B) When all physical and functional performance measure was analyzed simultaneously in the same model with all covariates, TUG remained significantly associated with mortality (HR = 1.45, 95% CI, 1.01–2.07, p < 0.05, per SD increase; HR = 2.02, 95% CI, 1.26–3.25, p = 0.004 with TUG binary score). In contrast, other physical and functional performance measures were no longer significantly associated with mortality per SD score increase, except for low KES (HR = 1.80, 95% CI, 1.20–2.69, p = 0.004) (Table 3).
Table 1. Characteristics of study participants in the Singapore Longitudinal Ageing Study (SLAS-2) cohort (N = 2906).
| Characteristics | Mean or % | ± SD or (N) | Skewness | ||||||||||||||||||||||||||||||||||||||||||||||||||||||||||||||||||||||||||||||||||||||||||||||||
| Age | Mean ± SD | 66.6 | ± 7.7 | ||||||||||||||||||||||||||||||||||||||||||||||||||||||||||||||||||||||||||||||||||||||||||||||||
| Sex | Female | 62.9 | (1829) | ||||||||||||||||||||||||||||||||||||||||||||||||||||||||||||||||||||||||||||||||||||||||||||||||
| Ethnicity | Chinese | 87.7 | (2549) | ||||||||||||||||||||||||||||||||||||||||||||||||||||||||||||||||||||||||||||||||||||||||||||||||
| Non-Chinese (Malay, Indian and Others) | 12.3 | (357) | |||||||||||||||||||||||||||||||||||||||||||||||||||||||||||||||||||||||||||||||||||||||||||||||||
| Education | None | 19.4 | (563) | ||||||||||||||||||||||||||||||||||||||||||||||||||||||||||||||||||||||||||||||||||||||||||||||||
| 1–6 years | 43.2 | (1254) | |||||||||||||||||||||||||||||||||||||||||||||||||||||||||||||||||||||||||||||||||||||||||||||||||
| >6 years | 37.5 | (1089) | |||||||||||||||||||||||||||||||||||||||||||||||||||||||||||||||||||||||||||||||||||||||||||||||||
| Housing type | Low-end 1–2 rooms | 21.3 | (619) | ||||||||||||||||||||||||||||||||||||||||||||||||||||||||||||||||||||||||||||||||||||||||||||||||
| 3 rooms | 28.5 | (827) | |||||||||||||||||||||||||||||||||||||||||||||||||||||||||||||||||||||||||||||||||||||||||||||||||
| ≥4 rooms and others | 50.2 | (1460) | |||||||||||||||||||||||||||||||||||||||||||||||||||||||||||||||||||||||||||||||||||||||||||||||||
| Live alone | 14.6 | (424) | |||||||||||||||||||||||||||||||||||||||||||||||||||||||||||||||||||||||||||||||||||||||||||||||||
| Smoking | Never | 78.3 | (2276) | ||||||||||||||||||||||||||||||||||||||||||||||||||||||||||||||||||||||||||||||||||||||||||||||||
| Ex-smoker | 11.8 | (344) | |||||||||||||||||||||||||||||||||||||||||||||||||||||||||||||||||||||||||||||||||||||||||||||||||
| Current smoker | 9.8 | (286) | |||||||||||||||||||||||||||||||||||||||||||||||||||||||||||||||||||||||||||||||||||||||||||||||||
| BMI, kg/m2 | Mean ± SD | 24.2 | ± 4.1 | ||||||||||||||||||||||||||||||||||||||||||||||||||||||||||||||||||||||||||||||||||||||||||||||||
| <18.5 | Underweight | 5.5 | (159) | ||||||||||||||||||||||||||||||||||||||||||||||||||||||||||||||||||||||||||||||||||||||||||||||||
| 18.5–29.9 | Non-obese | 84.4 | (2453) | ||||||||||||||||||||||||||||||||||||||||||||||||||||||||||||||||||||||||||||||||||||||||||||||||
| ≥30 | Obese | 7.5 | (219) | ||||||||||||||||||||||||||||||||||||||||||||||||||||||||||||||||||||||||||||||||||||||||||||||||
| Waist circumference, cm (men) | Mean ± SD | 88.6 | ± 9.9 | ||||||||||||||||||||||||||||||||||||||||||||||||||||||||||||||||||||||||||||||||||||||||||||||||
| (women) | Mean ± SD | 83.2 | ± 10.5 | ||||||||||||||||||||||||||||||||||||||||||||||||||||||||||||||||||||||||||||||||||||||||||||||||
| Central obesity (men) | Yes vs. no | 43.5 | (469) | ||||||||||||||||||||||||||||||||||||||||||||||||||||||||||||||||||||||||||||||||||||||||||||||||
| (women) | Yes vs. no | 61.6 | (1127) | ||||||||||||||||||||||||||||||||||||||||||||||||||||||||||||||||||||||||||||||||||||||||||||||||
| Physical activity score | 1–12 | 6.2 | ± 1.5 | ||||||||||||||||||||||||||||||||||||||||||||||||||||||||||||||||||||||||||||||||||||||||||||||||
| Social activity score | 6–24 | 11.1 | ± 2.6 | ||||||||||||||||||||||||||||||||||||||||||||||||||||||||||||||||||||||||||||||||||||||||||||||||
| Productive activity score | 4–16 | 9.9 | ± 1.9 | ||||||||||||||||||||||||||||||||||||||||||||||||||||||||||||||||||||||||||||||||||||||||||||||||
| Multi-morbidity | ≥5 vs. 0–4 | 18.1 | (525) | ||||||||||||||||||||||||||||||||||||||||||||||||||||||||||||||||||||||||||||||||||||||||||||||||
| Heart disease | Yes vs. no | 8.8 | (257) | ||||||||||||||||||||||||||||||||||||||||||||||||||||||||||||||||||||||||||||||||||||||||||||||||
| Stroke | Yes vs. no | 3.5 | (102) | ||||||||||||||||||||||||||||||||||||||||||||||||||||||||||||||||||||||||||||||||||||||||||||||||
| Diabetes | Yes vs. no | 20.2 | (587) | ||||||||||||||||||||||||||||||||||||||||||||||||||||||||||||||||||||||||||||||||||||||||||||||||
| Hypertension | Yes vs. no | 62.2 | (1807) | ||||||||||||||||||||||||||||||||||||||||||||||||||||||||||||||||||||||||||||||||||||||||||||||||
| Chronic kidney disease | Yes vs. no | 8.4 | (244) | ||||||||||||||||||||||||||||||||||||||||||||||||||||||||||||||||||||||||||||||||||||||||||||||||
| TUG | Mean ± SD | 8.9 | ± 3.7 | 4.57 | |||||||||||||||||||||||||||||||||||||||||||||||||||||||||||||||||||||||||||||||||||||||||||||||
| GV (Reversed) | Mean ± SD | 1.3 | ± 0.35 | 0.01 | |||||||||||||||||||||||||||||||||||||||||||||||||||||||||||||||||||||||||||||||||||||||||||||||
| KES (Reversed) | Mean ± SD | 16.4 | ± 6.7 | 1.08 | |||||||||||||||||||||||||||||||||||||||||||||||||||||||||||||||||||||||||||||||||||||||||||||||
| POMA (Reversed) | Mean ± SD | 25.6 | ± 1.6 | −6.90 | |||||||||||||||||||||||||||||||||||||||||||||||||||||||||||||||||||||||||||||||||||||||||||||||
| FEV1% (Reversed) | Mean ± SD | 104.4 | ± 23.0 | −0.18 | |||||||||||||||||||||||||||||||||||||||||||||||||||||||||||||||||||||||||||||||||||||||||||||||
| MMSE (Reversed) | Mean ± SD | 27.8 | ± 2.8 | −2.44 | |||||||||||||||||||||||||||||||||||||||||||||||||||||||||||||||||||||||||||||||||||||||||||||||
| GDS | Mean ± SD | 0.74 | ± 1.48 | 4.38 | |||||||||||||||||||||||||||||||||||||||||||||||||||||||||||||||||||||||||||||||||||||||||||||||
| Frailty Index | Mean ± SD | 0.10 | ± 0.06 | 1.65 | |||||||||||||||||||||||||||||||||||||||||||||||||||||||||||||||||||||||||||||||||||||||||||||||
| Physical frailty | Prefrail vs. robust | 43.8 | (1274) | ||||||||||||||||||||||||||||||||||||||||||||||||||||||||||||||||||||||||||||||||||||||||||||||||
| Frail vs. robust | 4.9 | (141) | |||||||||||||||||||||||||||||||||||||||||||||||||||||||||||||||||||||||||||||||||||||||||||||||||
| TUG | ≥9 | 31.8 | (923) | ||||||||||||||||||||||||||||||||||||||||||||||||||||||||||||||||||||||||||||||||||||||||||||||||
| POMA | <25 | 8.4 | (224) | ||||||||||||||||||||||||||||||||||||||||||||||||||||||||||||||||||||||||||||||||||||||||||||||||
| GV | >1.0 m/s | 18.5 | (539) | ||||||||||||||||||||||||||||||||||||||||||||||||||||||||||||||||||||||||||||||||||||||||||||||||
| KES | <15 kg (M), <11 kg (F) | 30.0 | (871) | ||||||||||||||||||||||||||||||||||||||||||||||||||||||||||||||||||||||||||||||||||||||||||||||||
| FEV1% | <70% | 8.5 | (248) | ||||||||||||||||||||||||||||||||||||||||||||||||||||||||||||||||||||||||||||||||||||||||||||||||
| MMSE | ≤23 | 7.6 | (2.21) | ||||||||||||||||||||||||||||||||||||||||||||||||||||||||||||||||||||||||||||||||||||||||||||||||
| GDS | ≥5 | 2.5 | (73) | ||||||||||||||||||||||||||||||||||||||||||||||||||||||||||||||||||||||||||||||||||||||||||||||||
| Frailty Index | ≥0.15 | 17.1 | (498) | ||||||||||||||||||||||||||||||||||||||||||||||||||||||||||||||||||||||||||||||||||||||||||||||||
| Physical frailty | 1–5 | 48.7 | (1415) | ||||||||||||||||||||||||||||||||||||||||||||||||||||||||||||||||||||||||||||||||||||||||||||||||
| Abbreviations: TUG: Timed Up-and-Go; POMA: Performance Oriented Mobility Assessment; GV: gait velocity; KES: knee extension strength; FEV1%: forced expiratory volume in 1 second in percentage; MMSE: Mini-Mental State Examination; GDS: Geriatric Depression Scale. | |||||||||||||||||||||||||||||||||||||||||||||||||||||||||||||||||||||||||||||||||||||||||||||||||||
Table 2A. Hazard ratio estimates of physical and functional performance and chronic disease markers predicting mortality.
| Predictor variable | Measurement Units | Unadjusted | Model 1 | Model 2 | |||||||||||||||||||||||||||||||||||||||||||||||||||||||||||||||||||||||||||||||||||||||||||||||
| HR | 95% CI | P | HR | 95% CI | P | HR | 95% CI | P | |||||||||||||||||||||||||||||||||||||||||||||||||||||||||||||||||||||||||||||||||||||||||||
| Per SD or equivalent | |||||||||||||||||||||||||||||||||||||||||||||||||||||||||||||||||||||||||||||||||||||||||||||||||||
| TUG | Per SD increase | 2.60 | (2.05, 3.29) | *** | 1.85 | (1.42, 2.42) | *** | 1.64 | (1.20, 2.19) | *** | |||||||||||||||||||||||||||||||||||||||||||||||||||||||||||||||||||||||||||||||||||||||||
| GV (Reversed) | Per SD increase | 1.83 | (1.48, 2.27) | *** | 1.47 | (1.18, 1.85) | *** | 1.33 | (1.04, 1.69) | * | |||||||||||||||||||||||||||||||||||||||||||||||||||||||||||||||||||||||||||||||||||||||||
| KES (Reversed) | Per SD increase | 1.24 | (1.01, 1.53) | * | 1.46 | (1.15, 1.86) | ** | 1.38 | (1.07, 1.78) | * | |||||||||||||||||||||||||||||||||||||||||||||||||||||||||||||||||||||||||||||||||||||||||
| FEV1% (Reversed) | Per SD increase | 1.24 | (1.02, 1.51) | * | 1.29 | (1.06, 1.56) | ** | 1.15 | (0.94, 1.41) | ||||||||||||||||||||||||||||||||||||||||||||||||||||||||||||||||||||||||||||||||||||||||||
| POMA (Reversed) | Per SD increase | 1.47 | (1.09, 1.97) | ** | 1.18 | (0.87, 1.59) | 1.04 | (0.75, 1.44) | |||||||||||||||||||||||||||||||||||||||||||||||||||||||||||||||||||||||||||||||||||||||||||
| MMSE (Reversed) | Per SD increase | 1.65 | (1.31, 2.08) | ** | 1.32 | (1.02, 1.70) | * | 1.20 | (0.91, 1.60) | ||||||||||||||||||||||||||||||||||||||||||||||||||||||||||||||||||||||||||||||||||||||||||
| GDS | Per SD increase | 1.42 | (1.08, 1.87) | ** | 1.28 | (0.97, 1.68) | 0.96 | (0.71, 1.28) | |||||||||||||||||||||||||||||||||||||||||||||||||||||||||||||||||||||||||||||||||||||||||||
| Frailty Index | Per SD increase | 1.70 | (1.38, 2.08) | *** | 1.41 | (1.13, 1.76) | ** | 1.18 | (0.90, 1.53) | ||||||||||||||||||||||||||||||||||||||||||||||||||||||||||||||||||||||||||||||||||||||||||
| Physical frailty | Per point score | 1,53 | (1.29, 1.81) | *** | 1.27 | (1.07, 1.11) | *** | 1.12 | (0.92, 1.37) | ||||||||||||||||||||||||||||||||||||||||||||||||||||||||||||||||||||||||||||||||||||||||||
| Age | Per SD increase | 2.46 | (1.97, 3.06) | *** | 2.34 | (1.88, 2.92) | *** | 1.75 | (1.34, 2.28) | *** | |||||||||||||||||||||||||||||||||||||||||||||||||||||||||||||||||||||||||||||||||||||||||
| Per binary variables | |||||||||||||||||||||||||||||||||||||||||||||||||||||||||||||||||||||||||||||||||||||||||||||||||||
| TUG | > = 9 vs. <9 s | 5.05 | (3.27, 7.80) | *** | 3.28 | (2.06, 5.22) | *** | 2.66 | (1.67, 4.23) | *** | |||||||||||||||||||||||||||||||||||||||||||||||||||||||||||||||||||||||||||||||||||||||||
| GV | <1.0 m/s | 2.81 | (1.91, 4.12) | *** | 1.83 | (1.21, 2.77) | ** | 1.69 | (1.08, 2.63) | * | |||||||||||||||||||||||||||||||||||||||||||||||||||||||||||||||||||||||||||||||||||||||||
| KES | 15 kg (M), 11 kg (F) | 2.58 | (1.78, 3.75) | *** | 2.06 | (1.41, 3.01) | *** | 2.02 | (1.36, 3.01) | *** | |||||||||||||||||||||||||||||||||||||||||||||||||||||||||||||||||||||||||||||||||||||||||
| FEV1% | <70% vs. ≥70% | 2.10 | (1.29, 3.39) | ** | 2.15 | (1.32, 3.53) | ** | 1.84 | (1.09, 3.10) | * | |||||||||||||||||||||||||||||||||||||||||||||||||||||||||||||||||||||||||||||||||||||||||
| POMA | 24/25 | 2.20 | (1.35, 3.57) | ** | 1.57 | (0.96, 2.58) | 1.39 | (0.82, 2.38) | |||||||||||||||||||||||||||||||||||||||||||||||||||||||||||||||||||||||||||||||||||||||||||
| MMSE | ≤23 vs. ≥24 | 2.51 | (1.54, 4.08) | *** | 1.53 | (0.90, 2.57) | 1.28 | (0.73, 2.23) | |||||||||||||||||||||||||||||||||||||||||||||||||||||||||||||||||||||||||||||||||||||||||||
| GDS | ≥5 vs. <5 | 1.68 | (1.13, 2.38) | ** | 1.66 | (0.68, 4.09) | 0.76 | (0.27, 2.13) | |||||||||||||||||||||||||||||||||||||||||||||||||||||||||||||||||||||||||||||||||||||||||||
| Frailty Index | ≥0.15 vs. <0.15 | 2.99 | (2.03, 4.39) | *** | 2.13 | (1.41, 3.22) | *** | 1.75 | (1.08, 2.82) | * | |||||||||||||||||||||||||||||||||||||||||||||||||||||||||||||||||||||||||||||||||||||||||
| Physical frailty | 0 vs. 1–5 | 2.56 | (1.41, 4.67) | ** | 1.89 | (1.26, 2.82) | ** | 1.58 | (1.01, 2.47) | * | |||||||||||||||||||||||||||||||||||||||||||||||||||||||||||||||||||||||||||||||||||||||||
| Age | ≥75 vs. <75 | 4.66 | (3.21, 6.78) | *** | 4.24 | (2.91, 6.17) | *** | 2.74 | (1.75, 4.31) | *** | |||||||||||||||||||||||||||||||||||||||||||||||||||||||||||||||||||||||||||||||||||||||||
| Model 1: adjusted for age (per year) and sex. Model 2: adjusted for covariates in Model 1 (age and sex) + education, housing status, living alone, physical activity, social activity, productive activity, smoking, BMI, central obesity, heart disease, stroke, diabetes/prediabetes, hypertension, chronic kidney disease and multimorbidity. | |||||||||||||||||||||||||||||||||||||||||||||||||||||||||||||||||||||||||||||||||||||||||||||||||||
Table 2B. Hazard ratio estimates of chronic disease and behavioural risk markers predicting mortality with base model co-variables.
| Other clinical predictors and base model variables | Unadjusted | Model 1 | Model 2 | ||||||||||||||||||||||||||||||||||||||||||||||||||||||||||||||||||||||||||||||||||||||||||||||||
| HR | 95%CI | P | HR | 95% CI | P | HR | 95% CI | P | |||||||||||||||||||||||||||||||||||||||||||||||||||||||||||||||||||||||||||||||||||||||||||
| Smoking | Past (vs. Never) | 4.07 | (2.63, 6.28) | *** | 2.23 | (1.34, 3.69) | ** | 2.01 | (1.20, 3.39) | ** | |||||||||||||||||||||||||||||||||||||||||||||||||||||||||||||||||||||||||||||||||||||||||
| Current (vs. Never) | 3.59 | (2.23, 5.78) | *** | 2.88 | (1.71, 4.86) | *** | 2.53 | (1.46, 4.37) | ** | ||||||||||||||||||||||||||||||||||||||||||||||||||||||||||||||||||||||||||||||||||||||||||
| BMI, kg/m2 | 18.5–29.9 (vs. <18.5) | 0.61 | (0.32, 1.18) | 0.74 | (0.38, 1.42) | 0.82 | (0.41, 1.65) | ||||||||||||||||||||||||||||||||||||||||||||||||||||||||||||||||||||||||||||||||||||||||||||
| ≥30 (vs. <18.5) | 0.30 | (0.09, 0.97) | * | 0.49 | (0.15, 1.56) | 0.52 | (0.15, 1.81) | ||||||||||||||||||||||||||||||||||||||||||||||||||||||||||||||||||||||||||||||||||||||||||||
| Central obesity | Yes vs. no | 0.64 | (0.44, 0.93) | * | 0.74 | (0.50, 1.08) | 0.77 | (0.50, 1.17) | |||||||||||||||||||||||||||||||||||||||||||||||||||||||||||||||||||||||||||||||||||||||||||
| Hypertension | Yes vs. no | 2.11 | (1.35, 3.29) | ** | 1.28 | (0.81, 2.03) | 1.27 | (0.75, 2.15) | |||||||||||||||||||||||||||||||||||||||||||||||||||||||||||||||||||||||||||||||||||||||||||
| Diabetes | Yes vs. no | 2.16 | (1.46, 3.17) | *** | 1.87 | (1.27, 2.76) | ** | 1.81 | (1.11, 2.94) | * | |||||||||||||||||||||||||||||||||||||||||||||||||||||||||||||||||||||||||||||||||||||||||
| Heart disease | Yes vs. no | 2.40 | (1.49, 3.86) | *** | 1.66 | (1.03, 2.68) | * | 1.48 | (0.86, 2.53) | ||||||||||||||||||||||||||||||||||||||||||||||||||||||||||||||||||||||||||||||||||||||||||
| Stroke | Yes vs. no | 2.05 | (0.99, 4.20) | 1.41 | (0.68, 2.90) | 1.09 | (0.50, 2.36) | ||||||||||||||||||||||||||||||||||||||||||||||||||||||||||||||||||||||||||||||||||||||||||||
| Chronic kidney disease | Yes vs. no | 2.60 | (1.63, 4.15) | *** | 1.18 | (0.72, 1.94) | 0.82 | (0.48, 1.40) | |||||||||||||||||||||||||||||||||||||||||||||||||||||||||||||||||||||||||||||||||||||||||||
| Multi-morbidity | ≥5 vs. 0–4 | 2.48 | (1.68, 3.66) | *** | 1.69 | (1.12, 2.52) | ** | 1.08 | (0.62, 1.88) | ||||||||||||||||||||||||||||||||||||||||||||||||||||||||||||||||||||||||||||||||||||||||||
| Age | Single year | 1.10 | (1.07, 1.21) | *** | 1.09 | (1.07, 1.12) | *** | 1.08 | (1.05, 1.10) | *** | |||||||||||||||||||||||||||||||||||||||||||||||||||||||||||||||||||||||||||||||||||||||||
| Male sex | 2.70 | (1.84, 3.95) | *** | 2.39 | (1.63, 3.51) | *** | 0.78 | (0.46, 1.31) | |||||||||||||||||||||||||||||||||||||||||||||||||||||||||||||||||||||||||||||||||||||||||||
| Education | 1–6 years vs. >6 years | 1.32 | (0.83, 2.07) | 1.07 | (0.67, 1.70) | 0.96 | (0.59, 1.56) | ||||||||||||||||||||||||||||||||||||||||||||||||||||||||||||||||||||||||||||||||||||||||||||
| None vs. >6 years | 1.86 | (1.13, 3.06) | * | 1.22 | (0.70, 2.12) | 0.94 | (0.52, 1.70) | ||||||||||||||||||||||||||||||||||||||||||||||||||||||||||||||||||||||||||||||||||||||||||||
| Housing type | 3 room vs. 4 + room | 1.60 | (0.96, 2.66) | 1.28 | (0.77, 2.14) | 0.98 | (0.57, 1.67) | ||||||||||||||||||||||||||||||||||||||||||||||||||||||||||||||||||||||||||||||||||||||||||||
| 1–2 room vs. 4 + room | 3.49 | (2.23, 5.44) | *** | 2.14 | (1.35, 3.40) | *** | 1.64 | (0.97, 2.76) | |||||||||||||||||||||||||||||||||||||||||||||||||||||||||||||||||||||||||||||||||||||||||||
| Live alone | Yes vs. no | 1.43 | (0.90, 2.26) | 1.24 | (0.78, 1.97) | 0.93 | (0.55, 1.57) | ||||||||||||||||||||||||||||||||||||||||||||||||||||||||||||||||||||||||||||||||||||||||||||
| Physical activity score | Per point score | 0.80 | (0.70, 0.92) | ** | 0.83 | (0.72, 0.96) | ** | 0.92 | (0.79, 1.09) | ||||||||||||||||||||||||||||||||||||||||||||||||||||||||||||||||||||||||||||||||||||||||||
| Social activity score | Per point score | 0.87 | (0.80, 0.95) | *** | 0.90 | (0.83, 0.98) | * | 0.94 | (0.86, 1.03) | ||||||||||||||||||||||||||||||||||||||||||||||||||||||||||||||||||||||||||||||||||||||||||
| Productive activity score | Per point score | 0.72 | (0.65, 0.80) | *** | 0.84 | (0.75, 0.93) | ** | 0.92 | (0.82, 1.03) | ||||||||||||||||||||||||||||||||||||||||||||||||||||||||||||||||||||||||||||||||||||||||||
| Abbreviation: HR: hazard ratio; *p < 0.05; **p < 0.01; ***P < 0.001. Model 1: adjusted for age (per year) and sex. Model 2: adjusted for covariates in Model 1 (age and sex) + education, housing status, living alone, physical activity, social activity, productive activity, smoking, BMI, central obesity, heart disease, stroke, diabetes/prediabetes, hypertension, chronic kidney disease and multi-morbidity. Hazard ratios are unadjusted for functional predictors; Binary cut-offs shown are commonly used in previous research and clinical applications. | |||||||||||||||||||||||||||||||||||||||||||||||||||||||||||||||||||||||||||||||||||||||||||||||||||
Table 3. Hazard ratios of association with mortality for physical and functional performance measures simultaneously present in the same model.
| Measure | Model 1 | Model 2 | |||||||||||||||||||||||||||||||||||||||||||||||||||||||||||||||||||||||||||||||||||||||||||||||||
| HR | 95% CI | P | HR | 95% CI | P | ||||||||||||||||||||||||||||||||||||||||||||||||||||||||||||||||||||||||||||||||||||||||||||||
| Standard deviation score | |||||||||||||||||||||||||||||||||||||||||||||||||||||||||||||||||||||||||||||||||||||||||||||||||||
| TUG | Per SD increase | 2.17 | (1.55, 3.04) | *** | 1.45 | (1.01, 2.07) | * | ||||||||||||||||||||||||||||||||||||||||||||||||||||||||||||||||||||||||||||||||||||||||||||
| GV (Reversed) | Per SD increase | 1.10 | (0.82, 1.46) | 1.02 | (0.75, 1.38) | ||||||||||||||||||||||||||||||||||||||||||||||||||||||||||||||||||||||||||||||||||||||||||||||
| KES | Per SD increase | 0.90 | (0.72, 1.23) | 1.27 | (0.98, 1.66) | ||||||||||||||||||||||||||||||||||||||||||||||||||||||||||||||||||||||||||||||||||||||||||||||
| POMA | Per SD increase | 0.84 | (0.61, 1.16) | 0.86 | (0.61, 1.21) | ||||||||||||||||||||||||||||||||||||||||||||||||||||||||||||||||||||||||||||||||||||||||||||||
| MMSE (Reversed) | Per SD increase | 1.15 | (0.89, 1.49) | 1.07 | (0.80, 1.43) | ||||||||||||||||||||||||||||||||||||||||||||||||||||||||||||||||||||||||||||||||||||||||||||||
| GDS | Per SD increase | 1.04 | (0.78, 1.39) | 0.94 | (0.70, 1.27) | ||||||||||||||||||||||||||||||||||||||||||||||||||||||||||||||||||||||||||||||||||||||||||||||
| Frailty Index | Per SD increase | 1.18 | (0.90, 1.54) | 1.08 | (0.81, 1.44) | ||||||||||||||||||||||||||||||||||||||||||||||||||||||||||||||||||||||||||||||||||||||||||||||
| Physical frailty | Per point increase | 1.12 | (0.91, 1.54) | 0.98 | (0.80, 1.21) | ||||||||||||||||||||||||||||||||||||||||||||||||||||||||||||||||||||||||||||||||||||||||||||||
| Binary score | |||||||||||||||||||||||||||||||||||||||||||||||||||||||||||||||||||||||||||||||||||||||||||||||||||
| TUG | > = 9 vs. <9 s | 2.74 | (1.75, 4.30) | *** | 2.02 | (1.26, 3.25) | ** | ||||||||||||||||||||||||||||||||||||||||||||||||||||||||||||||||||||||||||||||||||||||||||||
| GV | <1.0 m/s | 0.78 | (0.49, 1.25) | 1.16 | (0.72, 1.88) | ||||||||||||||||||||||||||||||||||||||||||||||||||||||||||||||||||||||||||||||||||||||||||||||
| KES | 15 kg (M), 11 kg (F) | 1.78 | (1.20, 2.65) | ** | 1.80 | (1.20, 2.69) | ** | ||||||||||||||||||||||||||||||||||||||||||||||||||||||||||||||||||||||||||||||||||||||||||||
| POMA | 24/25 | 1.15 | (0.68, 1.94) | 1.02 | (0.59, 1.76) | ||||||||||||||||||||||||||||||||||||||||||||||||||||||||||||||||||||||||||||||||||||||||||||||
| MMSE | ≤23 vs. ≥24 | 0.80 | (0.47, 1.35) | 1.02 | (0.58, 1.79) | ||||||||||||||||||||||||||||||||||||||||||||||||||||||||||||||||||||||||||||||||||||||||||||||
| GDS | ≥5 vs. <5 | 0.93 | (0.37, 2.34) | 0.84 | (0.32, 2.16) | ||||||||||||||||||||||||||||||||||||||||||||||||||||||||||||||||||||||||||||||||||||||||||||||
| Frailty Index | ≥0.15 vs. <0.15 | 1.71 | (1.08, 2.70) | * | 1.50 | (0.25, 1.10) | |||||||||||||||||||||||||||||||||||||||||||||||||||||||||||||||||||||||||||||||||||||||||||||
| Physical frailty | 3–5 vs. 0–2 | 0.73 | (0.37, 1.44) | 0.50 | (0.25, 1.01) | ||||||||||||||||||||||||||||||||||||||||||||||||||||||||||||||||||||||||||||||||||||||||||||||
| Abbreviation: HR: hazard ratio; *p < 0.05; **p < 0.01; ***p < 0.001. Model 1: All physical and functional performance measure included in the same model together. Model 2: All physical and functional performance measure included in the same model together with covariates (age, sex, education, housing status, living alone, smoking, physical activity, social activity, productive activity, heart disease, stroke, diabetes/prediabetes, hypertension, chronic kidney disease and multi-morbidity). Binary cut-offs shown are commonly used in previous research and clinical applications. | |||||||||||||||||||||||||||||||||||||||||||||||||||||||||||||||||||||||||||||||||||||||||||||||||||
TUG (AUC = 0.737) demonstrated a significantly higher predictive accuracy for mortality than GV (AUC = 0.666, p < 0.001), MMSE (AUC = 0.63, p < 0.001), FI (AUC = 0.620, p < 0.001) and physical frailty (AUC = 0.610, p < 0.001). (Table 4 and Figure 1) AUCs for chronic diseases and multi-morbidity were between 0.552 and 0.589, smoking was 0.662, BMI and central obesity were 0.386 and 0.480. The AUC for age was 0.730 (95% CI, 0.681–0.778).
Table 4. Predictive accuracy of TUG for mortality compared to gait velocity, frailty index, and physical frailty.
| Measures | AUC | 95% CI | p | Cut-off | Sensitivity | Specificity | PPV | NPV | |||||||||||||||||||||||||||||||||||||||||||||||||||||||||||||||||||||||||||||||||||||||||||
| TUG | 0.737 | (0.693, 0.781) | (a) | *** | 8.0 s | 0.856 | 0.488 | 0.062 | 0.988 | ||||||||||||||||||||||||||||||||||||||||||||||||||||||||||||||||||||||||||||||||||||||||||
| (b) | *** | 9.0 s | 0.656 | 0.696 | 0.079 | 0.981 | |||||||||||||||||||||||||||||||||||||||||||||||||||||||||||||||||||||||||||||||||||||||||||||
| (c) | *** | 10.0 s | 0.468 | 0.804 | 0.087 | 0.974 | |||||||||||||||||||||||||||||||||||||||||||||||||||||||||||||||||||||||||||||||||||||||||||||
| (d) | *** | 11.0 s | 0.351 | 0.870 | 0.097 | 0.971 | |||||||||||||||||||||||||||||||||||||||||||||||||||||||||||||||||||||||||||||||||||||||||||||
| 12.0 s | 0.261 | 0.918 | 0.102 | 0.969 | |||||||||||||||||||||||||||||||||||||||||||||||||||||||||||||||||||||||||||||||||||||||||||||||
| GV (Reversed) | 0.666 | (0.617, 0.715) | (b) | *** | 0.8 m/s | 0.189 | 0.933 | 0.102 | 0.967 | ||||||||||||||||||||||||||||||||||||||||||||||||||||||||||||||||||||||||||||||||||||||||||
| 0.9 m/s | 0.261 | 0.891 | 0.087 | 0.968 | |||||||||||||||||||||||||||||||||||||||||||||||||||||||||||||||||||||||||||||||||||||||||||||||
| 1.0 m/s | 0.378 | 0.822 | 0.078 | 0.971 | |||||||||||||||||||||||||||||||||||||||||||||||||||||||||||||||||||||||||||||||||||||||||||||||
| 1.1 m/s | 0.477 | 0.740 | 0.068 | 0.973 | |||||||||||||||||||||||||||||||||||||||||||||||||||||||||||||||||||||||||||||||||||||||||||||||
| 1.2 m/s | 0.559 | 0.651 | 0.060 | 0.974 | |||||||||||||||||||||||||||||||||||||||||||||||||||||||||||||||||||||||||||||||||||||||||||||||
| 1.3 m/s | 0.631 | 0.547 | 0.052 | 0.974 | |||||||||||||||||||||||||||||||||||||||||||||||||||||||||||||||||||||||||||||||||||||||||||||||
| 1.4 m/s | 0.802 | 0.415 | 0.052 | 0.981 | |||||||||||||||||||||||||||||||||||||||||||||||||||||||||||||||||||||||||||||||||||||||||||||||
| MMSE (Reversed) | 0.630 | (0.578, 0.682) | (c) | *** | 18/19 | 0.045 | 0.983 | 0.096 | 0.963 | ||||||||||||||||||||||||||||||||||||||||||||||||||||||||||||||||||||||||||||||||||||||||||
| 23/24 | 0.180 | 0.928 | 0.090 | 0.966 | |||||||||||||||||||||||||||||||||||||||||||||||||||||||||||||||||||||||||||||||||||||||||||||||
| 26/27 | 0.324 | 0.816 | 0.062 | 0.968 | |||||||||||||||||||||||||||||||||||||||||||||||||||||||||||||||||||||||||||||||||||||||||||||||
| 28/29 | 0.649 | 0.549 | 0.054 | 0.975 | |||||||||||||||||||||||||||||||||||||||||||||||||||||||||||||||||||||||||||||||||||||||||||||||
| Frailty Index | 0.620 | (0.561, 0.678) | (a) | *** | 0.070 | 0.766 | 0.390 | 0.041 | 0.969 | ||||||||||||||||||||||||||||||||||||||||||||||||||||||||||||||||||||||||||||||||||||||||||
| 0.080 | 0.712 | 0.480 | 0.044 | 0.971 | |||||||||||||||||||||||||||||||||||||||||||||||||||||||||||||||||||||||||||||||||||||||||||||||
| 0.090 | 0.658 | 0.482 | 0.048 | 0.973 | |||||||||||||||||||||||||||||||||||||||||||||||||||||||||||||||||||||||||||||||||||||||||||||||
| 0.150 | 0.369 | 0.836 | 0.082 | 0.971 | |||||||||||||||||||||||||||||||||||||||||||||||||||||||||||||||||||||||||||||||||||||||||||||||
| 0.210 | 0.207 | 0.949 | 0.139 | 0.968 | |||||||||||||||||||||||||||||||||||||||||||||||||||||||||||||||||||||||||||||||||||||||||||||||
| 0.250 | 0.117 | 0.974 | 0.151 | 0.965 | |||||||||||||||||||||||||||||||||||||||||||||||||||||||||||||||||||||||||||||||||||||||||||||||
| Physical frailty | 0.610 | (0.560, 0.669) | (d) | *** | 0/1–5 | 0.667 | 0.520 | 0.052 | 0.975 | ||||||||||||||||||||||||||||||||||||||||||||||||||||||||||||||||||||||||||||||||||||||||||
| 0–2/3–5 | 0.108 | 0.954 | 0.085 | 0.964 | |||||||||||||||||||||||||||||||||||||||||||||||||||||||||||||||||||||||||||||||||||||||||||||||
| ***p < 0.001, (a) TUG vs. Frailty index; (b) TUG vs. GV; (c) TUG vs. MMSE; (d) TUG vs. Physical frailty. Binary cut-offs shown cover a range commonly used in previous research and clinical applications. Only predictors with AUC above 0.60 were shown. Abbreviations: AUC: area under the curve; PPV: positive predictive value; NPV: negative predictive value. AUC for age: 0.730 (95% CI: 0.681–0.778) | |||||||||||||||||||||||||||||||||||||||||||||||||||||||||||||||||||||||||||||||||||||||||||||||||||
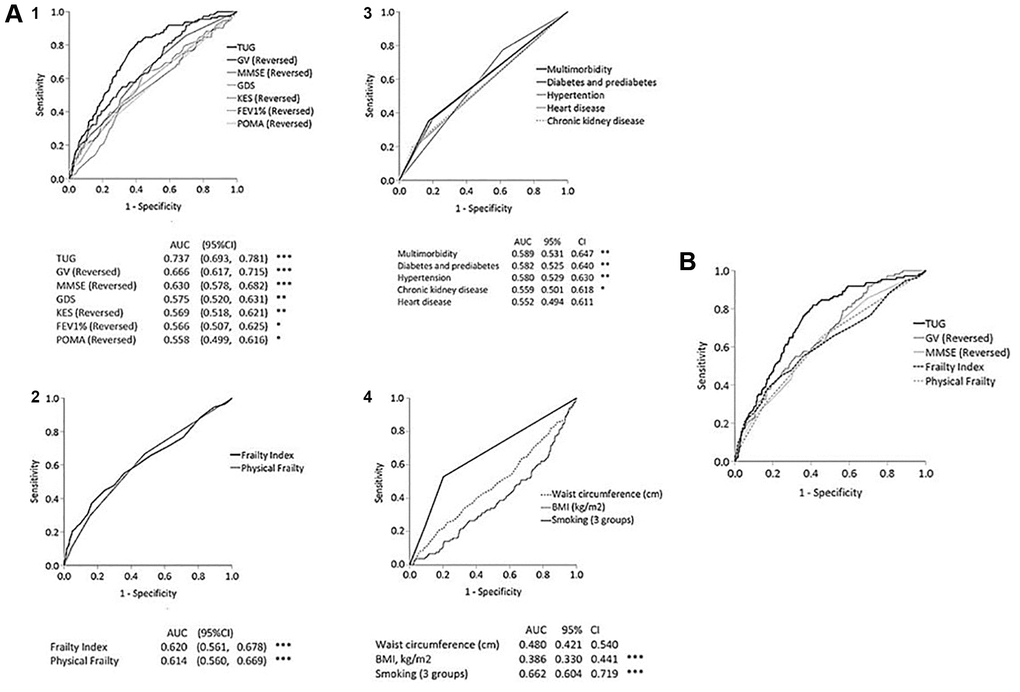
Figure 1. (A) Receiver operating curves of 1-year mortality prediction by physical and functional tests (panel 1), frailty index and physical frailty (panel 2), chronic disease and multi-morbidity (panel 3), and smoking, BMI and waist circumference (panel 4). (B) Receiver operating curves of 10-year mortality prediction by TUG, GV, MMSE, FI and physical frailty.
A TUG cut-off of 8.0 s was associated with high sensitivity to 0.856 (with low specificity of 0.488), and TUG of 10.0 s was associated with high specificity of 0.804 (with low sensitivity of 0.468). A TUG cut-off of 9.0 s was associated with optimal sensitivity and specificity of 0.656 and 0.696, respectively.
We conducted further stratified analyses by sex and age groups and found consistent associations and similar predictive accuracy for both men and women and younger (<75) and older (≥75) individuals (Supplementary Tables 1 and 2).
Discussion
In this study, we re-capitulated previous observations that physical and functional measures predict mortality risk. Notably, we showed that TUG, gait speed, KES, FEV1, and frailty were significantly associated with increased mortality, even after adjusting for sociodemographic, lifestyle, and traditional disease and health behavioural risk markers. Diabetes, cardiovascular disease, and multi-morbidity were also associated with increased mortality risks but low predictive accuracy in this cohort. Notably, compared with standardized units using their SD value, TUG showed the strongest hazard ratio for mortality risk among physical and functional measures. The AUC’s for all measures clearly showed that the discriminant accuracy for predicting mortality risk was highest for TUG. The finding remained consistent, whether the TUG was analyzed as a continuous variable or a binary categorical variable with the cut-off of 9 s.
Previous studies have reported similarly that TUG predicts mortality [17–23]. Among them, three studied only men [17] or women [18, 19]; one studied middle-aged postmenopausal women [19]; three were Asian studies [21–23], of which one evaluated short-term 2-year mortality risk [22], and one evaluated cardiovascular mortality [23]. Only a few studies, beside our study, evaluated TUG alongside other physical or functional measures: one study evaluated two measures (TUG and handgrip strength) [22], another study evaluated four measures (TUG, handgrip strength, five times sit-to-stand test, standing balance) [17], and another study also evaluated four measures (TUG, usual gait velocity, functional reach, one-leg stance) [18]. Our finding showing TUG to have surpassing predictive accuracy for long-term mortality is consistent with the findings reported of older men aged 71–86 in Belgium [17], and another cohort of older men and women aged 65–94 in Singapore [22]. However, differing results were reported by Idland et al., who followed up a small group of 300 community-dwelling older women (mean age 80.9 years) for 13.5 years showing that usual gait velocity was the strongest predictor for all-cause mortality [18]. We performed stratified analyses by sex and found consistent associations and predictive accuracy for both men and women.
The TUG is a complex test of functional mobility that reflects strength, balance and mobility through assessing the ability to transfer, sit-to-stand, walk, and turn [9, 10]. The sit-to-stand component includes a sequence of multiple subtasks, requiring forward movement of the centre-of-mass while still seated (preparatory to standing), acceleration of the centre-of- mass in the anterior-posterior and vertical plane, push-off, and stabilization once standing is achieved. The walking component requires appropriate initiation of stepping, acceleration and deceleration, and preparation to turn twice. The first turning sequence and the final turning around to sit down requires some level of planning, orientation in space and organization. The transfer and turning components are thus cognitively demanding, particularly on tasks of executive function [24].
The significant correlations between TUG and other physical and functional measures suggest that they have overlapping and non-overlapping domains of physical, cognitive and functional performance with each other. TUG is less correlated with muscle strength (KES) than with gait speed. This is in accord with observations [25] that muscle strength partially determines variations in gait performance, besides other determinants such as reaction time, balance, and proprioception. Furthermore, physical performance tests decline faster than muscle decline in the older population [26]. GV was also shown in this study to be more strongly predictive of mortality than muscle strength.
Muscle strength and gait speed are recommended for diagnosing sarcopenia and assessing its severity, respectively [27]. TUG’s strong association with mortality is likely due to its ability to identify sarcopenia and frailty; both documented to predict mortality [7, 28]. Sarcopenia, involving the accelerated loss of generalized skeletal muscle mass and function, is considered a precursor and component [29, 30] of frailty, which increases the vulnerability to adverse health outcomes. Sarcopenia is about twice as common as frailty, depending on the criteria used [29]; hence not all sarcopenic older people are frail. Two widely accepted operational conceptualizations of frailty are used in this study: the FI considers the cumulative deficits from all diagnosable health conditions; the other physical phenotype of frailty is more closely related to sarcopenia but includes inactivity and exhaustion as additional criteria. Per other studies [7], FI appears to be a stronger predictor of mortality in this study.
Taken together, TUG thus provides more information in a single test than GV, POMA, FEV1 or MMSE alone. It also shows a surpassing accuracy than these physical and functional tests, as well as known disease and health risk markers in predicting mortality. Among the latter, only smoking showed a relatively high AUC of 0.662, whereas BMI and central obesity showed AUCs significantly below 0.50, consonant with their well-known paradoxical ‘protective’ effect on mortality that has been reported in numerous studies [31]. On the other hand, age showed a higher AUC of 0.730. Although the TUG appears to have only marginally higher AUC than age in predicting mortality, this does not detract from its potential clinical utility. TUG differs from age in being a modifiable risk predictor that provide clinically useful information for targeted intervention to reduce mortality risk.
TUG cut-off
Our results align with previous studies showing a monotonic increase of mortality risk per SD increase in TUG [28]. There is no recommended cut-off for mortality prediction. Various optimal cut-off points are recommended specifically for different predicted adverse outcomes and different population groups of healthy and unwell persons. For example, the American Geriatrics Society (AGS) and British Geriatrics Society (BGS) guidelines recommended a TUG cut-off of 13.5 s for fall risk prediction of community-dwelling older adults [32]. Asian older adults have a lower TUG than the Caucasian population due to the differences in habitual gait speed [33]. Two studies of Japanese and Singaporean older adults suggest appropriate cut-offs of 9.0 s or 9.5 s for ADL disability risk among Asians [33, 34]. Consistent with these studies, TUG cut-off of 9.0 s gave the optimal balance of sensitivity (0.656) and specificity (0.696), whereas a cut-off of 8.0 s increases the sensitivity to 0.856 (while lowering the specificity to 0.488), and a higher cut-off of 10.s increases the specificity to 0.804 (while lowering the sensitivity to 0.468).
Clinical implications
Our findings contribute to a greater appreciation of the TUG as a powerful clinical tool predicting not only physical and cognitive impairment, sarcopenia, frailty, and other adverse health outcomes [11–15], but long-term mortality as well. The TUG appears unique among other physical and functional measures commonly explored for use as prognostication tools in clinical research and practice. Its overall discriminant accuracy for mortality (AUC = 0.737) is no less than other accepted risk prediction or prognostication tools such as the Framingham risk index for cardiovascular disease mortality (AUC = 0.61) [35] or the BODE score for chronic obstructive pulmonary disease (AUC = 0.71) [36].
Further studies should explore whether combinations of clinical and functional markers could improve its prognostication value. Already, the TUG has been recommended by the AGS and BGS guidelines for fall risk prediction of community-dwelling older adults. As such there is broader justification for routine screening with the TUG (cut-off of ≥9 s) for early comprehensive assessment and intervention, particularly with clinical consideration of patients’ life expectancy during shared clinical decision making regarding chronic disease management, major surgeries and cancer screening.
Strengths and limitations
Our study is uniquely able to evaluate the TUG alongside many clinical measures of physical and functional health status to compare their relative strengths and limitations for clinical use. We could do this in a large sample community-based cohort with diverse demographic, socio-economic and health characteristics. Follow up over 10 years for mortality was complete using computerized search for deaths via the National Death Registry. The results are reasonably generalizable to other Asian populations, but additional studies in other non-Asian ethnic populations should be conducted.
Materials and Methods
Participants and setting
The Singapore Longitudinal Ageing Study is a prospective population-based study of ageing and health transitions of older adults aged 55 and above in Singapore. The current SLAS-2 study cohort was recruited between 2009 and 2013 from the South West and South Central regions of Singapore. A total of 3270 recruited participants underwent assessments for an extensive range of psychosocial, lifestyle and behaviour, medical, biological, physiological, diet and nutrition, physical and neurocognitive functioning, and health status variables. Previous publications have described the details of the participants’ recruitment and measurements [37]. The present study involved 2906 participants who provided baseline data who were followed up to 9 years (mean of 5.8) years for mortality. Participants who were not included in the mortality follow-up study did not have complete baseline data for physical, cognitive, and functional tests and did not differ substantially in baseline characteristics from the participants in this study. The study was approved by the National University of Singapore Institutional Review Board, and written informed consent was obtained.
Baseline measurements
Physical and functional performance
Timed Up-and-Go (TUG) was measured by the time taken by the participant to stand up from an armchair (46 cm height), walk 3 metres, turn, walk back to the chair, and sit down again. The participants wore their regular footwear and used their customary walking aid, if required. Participants walked at their fastest pace with no physical assistance given. The test was administered twice, and the best performance time was used [8]. Various TUG cut-offs have been proposed or recommended for falls or disability prediction specific for different populations, and there are no suggested TUG cut-offs for mortality prediction. Asians generally have shorter mean TUG (faster gait speed) than Caucasians [33, 34]. We used an optimal TUG cut-off of 9.0s from receiver operating characteristics (ROC) analyses, consistent with a recommended cut-off of 9.0 s predicting disability in Japanese older adults [38].
Gait velocity (GV) was measured by the time in seconds taken for the participant to walk 6 metres at their fastest pace, averaged for two trials. Participants performed the test with a dynamic start on a smooth, flat 10-metre walkway with red-tape markers placed at the 0-, 2-, 8, and 10-metre points along the walkway, allowing for acceleration the first 2 metres and deceleration over the last 2 metres. The timing made a stopwatch is started when the toes of the leading foot cross the 2-meter mark and stopped when the toes of the leading foot cross the 8-meter mark. Cut-offs for Asians of <1.0 m/s has been recommended by previous studies [39].
Knee extension strength (KES) was measured for the lower limb maximum isometric strength. It was measured with the participant seated, the hip and knee angles at 90° using the strap and strain gauge component of the Physiological Profile Assessment [40], using three trials’ dominant leg average value (in kilograms). Cut-offs of 15 kg for males and 11 kg for females based on the lowest quintile value stratified by sex, were used to define low KES [41].
The Performance Oriented Mobility Assessment (POMA) battery measures both static and dynamic balance, with a separate subtest for balance and gait [42]. POMA is commonly used to predict falls and mortality of older adults [43, 44]. A cut-off score of <25 indicates a medium to high fall risk.
The Geriatric Depression Scale 15-items (GDS-15) score (0–15) was used to identify the presence of depressive symptoms (GDS ≥5) [45], and the Mini-Mental State Examination (MMSE) was used to assess global cognition and identify cognitive impairment (MMSE <23) [46]. Pulmonary function was assessed with the forced expiratory volume in 1 second (FEV1). FEV1 below 70% of the value predicted by age, sex, ethnicity, and height using local population equations indicates airflow obstruction.
Frailty
Two widely accepted models were used to measure the frailty status of the participants:
Frailty Index (FI) [47]: a cumulative deficit model based on counts of dysfunction and impairment across multiple body systems. A total of 98 non-laboratory based evaluable health deficits were used to construct the index, expressed as a fractional value (number of observed deficits/number of evaluable deficits) from 0 (extremely robust) to 1 (extremely frail) (Supplementary Table 3). FI was analyzed as a continuous variable and binary variable using a cut-off of 0.15 and more to define frailty, based on calculations of stratum-specific likelihood ratios to determine the most appropriate cutoff to discriminate between frailty and non-frailty in predicting mortality in this cohort [44].
Physical frailty: a physical phenotype model used in the Cardiovascular Health Study [48]. We used 5 operationally modified measures described in our previous study [41] for assessing shrinking, weakness, slowness, exhaustion and low activity. One point was assigned for the presence of each of the components, and the total summed score (from 0 to 5) was used to categorize participants as robust (0 points), prefrail (1–2 points) and frail (3–5 points).
Covariates
We collected baseline information such as age, sex and years of education. Participants’ housing type: low-end 1–2 room public housing apartments, 3 rooms or a higher-end with 4 rooms or others was used as an indicator of socio-economic status based on the Singapore population census data [49]. Lifestyle factors included participation in 16 categories of physical, social and productive activities described in a previous publication to derive aggregate score based on the number of activities and frequency of participation (on a 5-point Likert scale), with a higher score representing a higher level of participation [50].
Mortality assessment
Participants’ mortality status from baseline up to 31 Dec 2016 was determined using the participants’ unique National Registration Identity Card number for computerized record linkage with the National Death Registry through the National Disease Registry Office of the Ministry of Health.
Statistical analysis
We used Cox proportional hazard models to evaluate the association of TUG, other physical and functional measures, and chronic disease and behavioural risk markers (multi-morbidity, heart disease, diabetes mellitus, hypertension, chronic kidney disease, smoking, BMI, central obesity, frailty index, physical frailty) with mortality in a crude model and two adjusted models. In Model 1, the mortality HR estimate associated with each predictor variable was adjusted for age and sex (but not for ethnicity, as no deaths were observed among the small numbers of non-Chinese participants). Model 2 further adjusted for covariates in Model 1 as well as for education, housing status, living alone, smoking (but not alcohol, due to small sample size), physical activity, social activity, productive activity, heart disease, stroke, diabetes, hypertension, chronic kidney disease and multi-morbidity. Hazard ratios (HR) and 95% confidence intervals (95%CI) were estimated for each physical, functional and clinical predictor as a continuous variable and binary variable. The mortality HR value is variable for different cut-offs along with the range of values of the same predictor variable and for different measurement units of different predictor variables. Thus, for a valid comparison of the strengths of association with mortality between different predictors, we used a standardized approach to show per standard deviation (SD) increment of mortality HR.
The measures in predicting mortality were evaluated using receiver operating characteristic (ROC) curves, and the areas under the curves (AUCs) were compared using the DeLong’s method for significance testing [49]. An AUC between 0.7 and 0.8 is considered acceptable discrimination, between 0.8 and 0.9 is deemed excellent discrimination, and more than 0.9 is outstanding discrimination [51]. The discriminant accuracy of various optimal cut-off values was expressed as sensitivity, specificity, positive predictive value, and negative predictive values. Analysis of the data was performed using IBM SPSS version 25.
Conclusions
Our study highlights the superior accuracy of TUG compared to other physical and functional measures in predicting long-term mortality among community-dwelling older adults. Taken together with evidence of the ability of the TUG to predict falls and other adverse health outcomes, the TUG appears to be uniquely positioned for use in early comprehensive geriatric assessment, and particularly in regard to shared clinical decision making requiring the prognostication of future life expectancy.
Supplementary Materials
Author Contributions
CYC and TPN reviewed the literature, designed the study, drafted and revised the manuscript. TPN analyzed the data. PY, KBY, XYG, DQLC contributed to the study design and data collection. All authors reviewed the results and drafts, and approved the final manuscript.
Acknowledgments
We thank the following voluntary welfare organizations for their support: Geylang East Home for the Aged, Presbyterian Community Services, St Luke’s Eldercare Services, Thye Hua Kwan Moral Society (Moral Neighbourhood Links), Yuhua Neighbourhood Link, Henderson Senior Citizens’ Home, NTUC Eldercare Co-op Ltd, Thong Kheng Seniors Activity Centre (Queenstown Centre) and Redhill Moral Seniors Activity Centre. We thank National Registry of Disease Office (NRDO) for performing the computerized record linkage.
Conflicts of Interest
The authors declare no conflicts of interest related to this study.
Funding
The study was supported by research grants from the Agency for Science Technology and Research (A*STAR) Biomedical Research Council (BMRC) [Grant: 08/1/21/19/567] and from the National Medical Research Council [Grant: NMRC/1108/2007].
References
- 1. Nybo H, Petersen HC, Gaist D, Jeune B, Andersen K, McGue M, Vaupel JW, Christensen K. Predictors of mortality in 2,249 nonagenarians--the Danish 1905-Cohort Survey. J Am Geriatr Soc. 2003; 51:1365–73. https://doi.org/10.1046/j.1532-5415.2003.51453.x [PubMed]
- 2. Marengoni A, von Strauss E, Rizzuto D, Winblad B, Fratiglioni L. The impact of chronic multimorbidity and disability on functional decline and survival in elderly persons. A community-based, longitudinal study. J Intern Med. 2009; 265:288–95. https://doi.org/10.1111/j.1365-2796.2008.02017.x [PubMed]
- 3. Feng L, Zin Nyunt MS, Gao Q, Feng L, Yap KB, Ng TP. Cognitive Frailty and Adverse Health Outcomes: Findings From the Singapore Longitudinal Ageing Studies (SLAS). J Am Med Dir Assoc. 2017; 18:252–58. https://doi.org/10.1016/j.jamda.2016.09.015 [PubMed]
- 4. Ho CS, Jin A, Nyunt MS, Feng L, Ng TP. Mortality rates in major and subthreshold depression: 10-year follow-up of a Singaporean population cohort of older adults. Postgrad Med. 2016; 128:642–47. https://doi.org/10.1080/00325481.2016.1221319 [PubMed]
- 5. Panizza JA, James AL, Ryan G, de Klerk N, Finucane KE. Mortality and airflow obstruction in asthma: a 17-year follow-up study. Intern Med J. 2006; 36:773–80. https://doi.org/10.1111/j.1445-5994.2006.01214.x [PubMed]
- 6. White DK, Neogi T, Nevitt MC, Peloquin CE, Zhu Y, Boudreau RM, Cauley JA, Ferrucci L, Harris TB, Satterfield SM, Simonsick EM, Strotmeyer ES, Zhang Y. Trajectories of gait speed predict mortality in well-functioning older adults:the Health, Aging and Body Composition study. J Gerontol A Biol Sci Med Sci. 2013; 68:456–64. https://doi.org/10.1093/gerona/gls197 [PubMed]
- 7. Kojima G, Iliffe S, Walters K. Frailty index as a predictor of mortality: a systematic review and meta-analysis. Age Ageing. 2018; 47:193–200. https://doi.org/10.1093/ageing/afx162 [PubMed]
- 8. Podsiadlo D, Richardson S. The timed "Up & Go": a test of basic functional mobility for frail elderly persons. J Am Geriatr Soc. 1991; 39:142–48. https://doi.org/10.1111/j.1532-5415.1991.tb01616.x [PubMed]
- 9. Herman T, Giladi N, Hausdorff JM. Properties of the 'timed up and go' test: more than meets the eye. Gerontology. 2011; 57:203–10. https://doi.org/10.1159/000314963 [PubMed]
- 10. Janssen WG, Bussmann HB, Stam HJ. Determinants of the sit-to-stand movement: a review. Phys Ther. 2002; 82:866–79. [PubMed]
- 11. Chun SH, Cho B, Yang HK, Ahn E, Han MK, Oh B, Shin DW, Son KY. Performance on physical function tests and the risk of fractures and admissions: Findings from a national health screening of 557,648 community-dwelling older adults. Arch Gerontol Geriatr. 2017; 68:174–80. https://doi.org/10.1016/j.archger.2016.10.008 [PubMed]
- 12. Donoghue OA, Savva GM, Cronin H, Kenny RA, Horgan NF. Using timed up and go and usual gait speed to predict incident disability in daily activities among community-dwelling adults aged 65 and older. Arch Phys Med Rehabil. 2014; 95:1954–61. https://doi.org/10.1016/j.apmr.2014.06.008 [PubMed]
- 13. Hirano K, Imagama S, Hasegawa Y, Ito Z, Muramoto A, Ishiguro N. Impact of low back pain, knee pain, and timed up-and-go test on quality of life in community-living people. J Orthop Sci. 2014; 19:164–71. https://doi.org/10.1007/s00776-013-0476-0 [PubMed]
- 14. Lee JE, Shin DW, Jeong SM, Son KY, Cho B, Yoon JL, Park BJ, Kwon IS, Lee J, Kim S. Association Between Timed Up and Go Test and Future Dementia Onset. J Gerontol A Biol Sci Med Sci. 2018; 73:1238–43. https://doi.org/10.1093/gerona/glx261 [PubMed]
- 15. Dent E, Lien C, Lim WS, Wong WC, Wong CH, Ng TP, Woo J, Dong B, de la Vega S, Hua Poi PJ, Kamaruzzaman SBB, Won C, Chen LK, et al. The Asia-Pacific Clinical Practice Guidelines for the Management of Frailty. J Am Med Dir Assoc. 2017; 18:564–75. https://doi.org/10.1016/j.jamda.2017.04.018 [PubMed]
- 16. Fried LP, Ferrucci L, Darer J, Williamson JD, Anderson G. Untangling the concepts of disability, frailty, and comorbidity: implications for improved targeting and care. J Gerontol A Biol Sci Med Sci. 2004; 59:255–63. https://doi.org/10.1093/gerona/59.3.m255 [PubMed]
- 17. De Buyser SL, Petrovic M, Taes YE, Toye KR, Kaufman JM, Goemaere S. Physical function measurements predict mortality in ambulatory older men. Eur J Clin Invest. 2013; 43:379–86. https://doi.org/10.1111/eci.12056 [PubMed]
- 18. Idland G, Engedal K, Bergland A. Physical performance and 13.5-year mortality in elderly women. Scand J Public Health. 2013; 41:102–108. https://doi.org/10.1177/1403494812466460 [PubMed]
- 19. Tice JA, Kanaya A, Hue T, Rubin S, Buist DS, Lacroix A, Lacey JV
Jr , Cauley JA, Litwack S, Brinton LA, Bauer DC. Risk factors for mortality in middle-aged women. Arch Intern Med. 2006; 166:2469–77. https://doi.org/10.1001/archinte.166.22.2469 [PubMed] - 20. Bergland A, Jørgensen L, Emaus N, Strand BH. Mobility as a predictor of all-cause mortality in older men and women: 11.8 year follow-up in the Tromsø study. BMC Health Serv Res. 2017; 17:22. https://doi.org/10.1186/s12913-016-1950-0 [PubMed]
- 21. Otsuka H, Kobayashi H, Suzuki K, Hayashi Y, Ikeda J, Kushimoto M, Hara M, Abe M, Kato K, Soma M. Mobility performance impacts mortality risk in community-dwelling healthy older adults in Japan: a prospective observational study. Aging Clin Exp Res. 2021; 33:2511–17. https://doi.org/10.1007/s40520-021-01787-1 [PubMed]
- 22. Chua KY, Lim WS, Lin X, Yuan JM, Koh WP. Handgrip Strength and Timed Up-and-Go (TUG) Test are Predictors of Short-Term Mortality among Elderly in a Population-Based Cohort in Singapore. J Nutr Health Aging. 2020; 24:371–78. https://doi.org/10.1007/s12603-020-1337-0 [PubMed]
- 23. Son KY, Shin DW, Lee JE, Kim SH, Yun JM, Cho B. Association of timed up and go test outcomes with future incidence of cardiovascular disease and mortality in adults aged 66 years: Korean national representative longitudinal study over 5.7 years. BMC Geriatr. 2020; 20:111. https://doi.org/10.1186/s12877-020-01509-8 [PubMed]
- 24. Donoghue OA, Horgan NF, Savva GM, Cronin H, O'Regan C, Kenny RA. Association between timed up-and-go and memory, executive function, and processing speed. J Am Geriatr Soc. 2012; 60:1681–86. https://doi.org/10.1111/j.1532-5415.2012.04120.x [PubMed]
- 25. Harris-Love MO, Benson K, Leasure E, Adams B, McIntosh V. The Influence of Upper and Lower Extremity Strength on Performance-Based Sarcopenia Assessment Tests. J Funct Morphol Kinesiol. 2018; 3:53. https://doi.org/10.3390/jfmk3040053 [PubMed]
- 26. Chodzko-Zajko WJ, Proctor DN, Fiatarone Singh MA, Minson CT, Nigg CR, Salem GJ, Skinner JS, and American College of Sports Medicine. American College of Sports Medicine position stand. Exercise and physical activity for older adults. Med Sci Sports Exerc. 2009; 41:1510–30. https://doi.org/10.1249/MSS.0b013e3181a0c95c [PubMed]
- 27. Cruz-Jentoft AJ, Bahat G, Bauer J, Boirie Y, Bruyère O, Cederholm T, Cooper C, Landi F, Rolland Y, Sayer AA, Schneider SM, Sieber CC, Topinkova E, et al, and Writing Group for the European Working Group on Sarcopenia in Older People 2 (EWGSOP2), and the Extended Group for EWGSOP2. Sarcopenia: revised European consensus on definition and diagnosis. Age Ageing. 2019; 48:601. https://doi.org/10.1093/ageing/afz046 [PubMed]
- 28. Liu P, Hao Q, Hai S, Wang H, Cao L, Dong B. Sarcopenia as a predictor of all-cause mortality among community-dwelling older people: A systematic review and meta-analysis. Maturitas. 2017; 103:16–22. https://doi.org/10.1016/j.maturitas.2017.04.007 [PubMed]
- 29. von Haehling S, Morley JE, Anker SD. An overview of sarcopenia: facts and numbers on prevalence and clinical impact. J Cachexia Sarcopenia Muscle. 2010; 1:129–33. https://doi.org/10.1007/s13539-010-0014-2 [PubMed]
- 30. Cesari M, Landi F, Vellas B, Bernabei R, Marzetti E. Sarcopenia and physical frailty: two sides of the same coin. Front Aging Neurosci. 2014; 6:192. https://doi.org/10.3389/fnagi.2014.00192 [PubMed]
- 31. Ahmadi SF, Streja E, Zahmatkesh G, Streja D, Kashyap M, Moradi H, Molnar MZ, Reddy U, Amin AN, Kovesdy CP, Kalantar-Zadeh K. Reverse Epidemiology of Traditional Cardiovascular Risk Factors in the Geriatric Population. J Am Med Dir Assoc. 2015; 16:933–39. https://doi.org/10.1016/j.jamda.2015.07.014 [PubMed]
- 32. Panel on Prevention of Falls in Older Persons, and American Geriatrics Society and British Geriatrics Society. Summary of the Updated American Geriatrics Society/British Geriatrics Society clinical practice guideline for prevention of falls in older persons. J Am Geriatr Soc. 2011; 59:148–57. https://doi.org/10.1111/j.1532-5415.2010.03234.x [PubMed]
- 33. Makizako H, Shimada H, Doi T, Tsutsumimoto K, Nakakubo S, Hotta R, Suzuki T. Predictive Cutoff Values of the Five-Times Sit-to-Stand Test and the Timed "Up & Go" Test for Disability Incidence in Older People Dwelling in the Community. Phys Ther. 2017; 97:417–24. [PubMed]
- 34. Choo PL, Tou NX, Jun Pang BW, Lau LK, Jabbar KA, Seah WT, Chen KK, Ng TP, Wee SL. Timed Up and Go (TUG) Reference Values and Predictive Cutoffs for Fall Risk and Disability in Singaporean Community-Dwelling Adults: Yishun Cross-Sectional Study and Singapore Longitudinal Aging Study. J Am Med Dir Assoc. 2021; 22:1640–45. https://doi.org/10.1016/j.jamda.2021.03.002 [PubMed]
- 35. Chia YC, Gray SY, Ching SM, Lim HM, Chinna K. Validation of the Framingham general cardiovascular risk score in a multiethnic Asian population: a retrospective cohort study. BMJ Open. 2015; 5:e007324. https://doi.org/10.1136/bmjopen-2014-007324 [PubMed]
- 36. de Torres JP, Casanova C, Marín JM, Pinto-Plata V, Divo M, Zulueta JJ, Berto J, Zagaceta J, Sanchez-Salcedo P, Cabrera C, Carrizo S, Cote C, Celli BR. Prognostic evaluation of COPD patients: GOLD 2011 versus BODE and the COPD comorbidity index COTE. Thorax. 2014; 69:799–804. https://doi.org/10.1136/thoraxjnl-2014-205770 [PubMed]
- 37. Ng TP, Feng L, Nyunt MS, Feng L, Gao Q, Lim ML, Collinson SL, Chong MS, Lim WS, Lee TS, Yap P, Yap KB. Metabolic Syndrome and the Risk of Mild Cognitive Impairment and Progression to Dementia: Follow-up of the Singapore Longitudinal Ageing Study Cohort. JAMA Neurol. 2016; 73:456–63. https://doi.org/10.1001/jamaneurol.2015.4899 [PubMed]
- 38. Kamide N, Takahashi K, Shiba Y. Reference values for the Timed Up and Go test in healthy Japanese elderly people: determination using the methodology of meta-analysis. Geriatr Gerontol Int. 2011; 11:445–51. https://doi.org/10.1111/j.1447-0594.2011.00704.x [PubMed]
- 39. Chen LK, Woo J, Assantachai P, Auyeung TW, Chou MY, Iijima K, Jang HC, Kang L, Kim M, Kim S, Kojima T, Kuzuya M, Lee JSW, et al. Asian Working Group for Sarcopenia: 2019 Consensus Update on Sarcopenia Diagnosis and Treatment. J Am Med Dir Assoc. 2020; 21:300–307.e2. https://doi.org/10.1016/j.jamda.2019.12.012 [PubMed]
- 40. Lord SR, Menz HB, Tiedemann A. A physiological profile approach to falls risk assessment and prevention. Phys Ther. 2003; 83:237–52. [PubMed]
- 41. Ng TP, Feng L, Nyunt MS, Larbi A, Yap KB. Frailty in older persons: multisystem risk factors and the Frailty Risk Index (FRI). J Am Med Dir Assoc. 2014; 15:635–42. https://doi.org/10.1016/j.jamda.2014.03.008 [PubMed]
- 42. Tinetti ME. Performance-oriented assessment of mobility problems in elderly patients. J Am Geriatr Soc. 1986; 34:119–26. https://doi.org/10.1111/j.1532-5415.1986.tb05480.x [PubMed]
- 43. Guralnik JM, Simonsick EM, Ferrucci L, Glynn RJ, Berkman LF, Blazer DG, Scherr PA, Wallace RB. A short physical performance battery assessing lower extremity function: association with self-reported disability and prediction of mortality and nursing home admission. J Gerontol. 1994; 49:M85–94. https://doi.org/10.1093/geronj/49.2.m85 [PubMed]
- 44. Nam S, Al Snih S, Markides KS. A concordance of self-reported and performance-based assessments of mobility as a mortality predictor for older Mexican Americans. Geriatr Gerontol Int. 2017; 17:433–39. https://doi.org/10.1111/ggi.12734 [PubMed]
- 45. Nyunt MS, Fones C, Niti M, Ng TP. Criterion-based validity and reliability of the Geriatric Depression Screening Scale (GDS-15) in a large validation sample of community-living Asian older adults. Aging Ment Health. 2009; 13:376–82. https://doi.org/10.1080/13607860902861027 [PubMed]
- 46. Feng L, Chong MS, Lim WS, Ng TP. The Modified Mini-Mental State Examination test: normative data for Singapore Chinese older adults and its performance in detecting early cognitive impairment. Singapore Med J. 2012; 53:458–62. [PubMed]
- 47. Mitnitski AB, Graham JE, Mogilner AJ, Rockwood K. Frailty, fitness and late-life mortality in relation to chronological and biological age. BMC Geriatr. 2002; 2:1. https://doi.org/10.1186/1471-2318-2-1 [PubMed]
- 48. Fried LP, Borhani NO, Enright P, Furberg CD, Gardin JM, Kronmal RA, Kuller LH, Manolio TA, Mittelmark MB, Newman A. The Cardiovascular Health Study: design and rationale. Ann Epidemiol. 1991; 1:263–76. https://doi.org/10.1016/1047-2797(91)90005-w [PubMed]
- 49. Average monthly household income by household size and type of dwelling. 2019. Available from: https://data.gov.sg/dataset/average-monthly-household-income-by-household-size-and-type-of-dwelling.
- 50. Niti M, Yap KB, Kua EH, Tan CH, Ng TP. Physical, social and productive leisure activities, cognitive decline and interaction with APOE-ε4 genotype in Chinese older adults. Int Psychogeriatrics. 2008; 20:237–51. https://doi.org/10.1017/S1041610207006655
- 51. Hosmer DW, Lemeshow S, Sturdivant RX. Applied logistic regression. New York: Wiley. 2000.