


Introduction
Population aging is predicted to become a major global public health challenge in the next decade, as the advanced age group population has been increasing [1]. The principal theories of aging are fraught with complications [2]. López-Otín C et al. have characterized aging as a progressive loss of physiological integrity, leading to impaired function and increased vulnerability to death [3]. They proposed nine candidate hallmarks that contribute to the aging process and together determine the aging phenotype; 1) genomic instability, 2) telomere attrition, 3) epigenetic alterations, 4) loss of proteostasis, 5) deregulated nutrient-sensing, 6) mitochondrial dysfunction, 7) cellular senescence, 8) stem cell exhaustion, and 9) altered intercellular communication. In addition, these hallmarks were grouped into three categories, which may suggest the order in which the hallmarks occur. Nevertheless, it is difficult to quantify and evaluate aging because the principal theories of aging are intricately intertwined. To overcome these difficulties, we must discover age-dependent changes occurring during various ages, which may provide new information and opportunities to understand the mechanisms of aging. Metabolomics, using blood, serum, and plasma, has emerged as a powerful tool to characterize organism phenotypes, and identify altered metabolites, pathways, and novel biomarkers in aging and disease, which will offer wide clinical applications [4, 5].
Metallothionein (MT) family proteins are low-molecular-weight cysteine-rich proteins induced by various chemical and physical stresses that produce reactive oxygen species (ROS) [6]. MTs play a role in zinc homeostasis and have potential protective effects against free radicals (e.g., hydroxyl radicals) and toxic metals (e.g., cadmium and mercury ions) [7]. Increased cellular abundance of MTs is associated with biological outcomes of cell viability, immune function, mitochondrial respiration, neuroprotection, and fat mass regulation, which are directly linked to aging [8]. We have shown that MTs protect adipose tissue from environmental stress and that MTs play a role in maintaining the appropriate size of adipocytes [9, 10]. The possible role of MTs in pro-longevity interventions has been elucidated in many species. Elevated MT gene expression has been observed in tissues from long-lived mice and worms [8, 11]. In rodents, MT-transgenic mice have extended lifespans [12, 13]. In humans, MT polymorphisms are associated with longevity [14–17]. However, MT1 and MT2 knockout (MTKO) mice were exclusively used to study the sensitivity and lethality of toxic substances, including cadmium [18] and cisplatin [19], compared with wild-type (WT) mice. The MTKO mice were used to elucidate the role of MT, because MT genes are induced in response to multiple stresses and exert protection against these stresses. However, it was unknown whether MT gene deficiency affects lifespan in an ordinary lifestyle without anthropogenic stressors. Our previous study showed that MT deficiency shortened the lifespan of 129sv strain mice of both sexes, and the median lifespans of male MTKO mice and WT mice were 106 and 129 weeks, respectively [20]. Older male MTKO mice that lived beyond the mean lifespan exhibited signs of excessive and extraordinary symptoms of senescence along with a drastic reduction in body weight. The reduction in the body weight of male MTKO mice started at approximately 50 weeks, which coincides with the first incidence of mortality in male MTKO mice; the first death of male MTKO and WT mice was observed at 55 weeks and 70 weeks, respectively [20]. Metabolic changes that affect longevity and aging may have occurred around this time in MTKO mice.
In this study, we performed a metabolomic analysis of plasma in middle-aged (50-week-old: the age at which the body weight of male MTKO mice began decreasing, and immediately before the first death in MTKO mice) and advanced age (100-week-old; close to the median lifespan of male MTKO mice) mice using liquid chromatography time-of-flight mass spectrometry (LC-TOF-MS), to obtain information regarding altered phenotypic profiles of both MTKO and WT male mice, and to determine the biomarkers of aging accelerated by the deficiency of MT genes.
Results
Multivariate statistical analyses
Representative base peak intensity (BPI) chromatograms were obtained from plasma in electrospray ionization positive (ESI+) and negative (ESI-) modes, respectively (Supplementary Figure 1A, 1B). All peaks in ESI+ or ESI- were merged and imported into the SIMCA-P software for multivariate statistical analysis. To investigate global metabolism variations, we first used principal component analysis (PCA) to analyze all observations acquired in both ion modes. As shown in the PCA plot (Supplementary Figure 2), an overview of all samples in the data can be observed and exhibits an unclear grouping trend between the two groups. To eliminate any non-specific effects of the operative technique and confirm the biomarkers, partial least squares discriminant analysis (PLS-DA) and orthogonal partial least squares-discriminant analysis (OPLS-DA) were used to compare metabolic changes between the two groups. In the PLS-DA score plot (Supplementary Figure 3) or OPLS-DA score plot (Figure 1A–1D), a clear separation of the two groups was observed. Univariate analyses, including fold change (FC) analysis and t-test, were performed on a volcano plot (Supplementary Figure 4). We selected metabolites with variable importance in projection (VIP) > 1.5, FC > 2.0, and P < 0.05 as significant compounds.
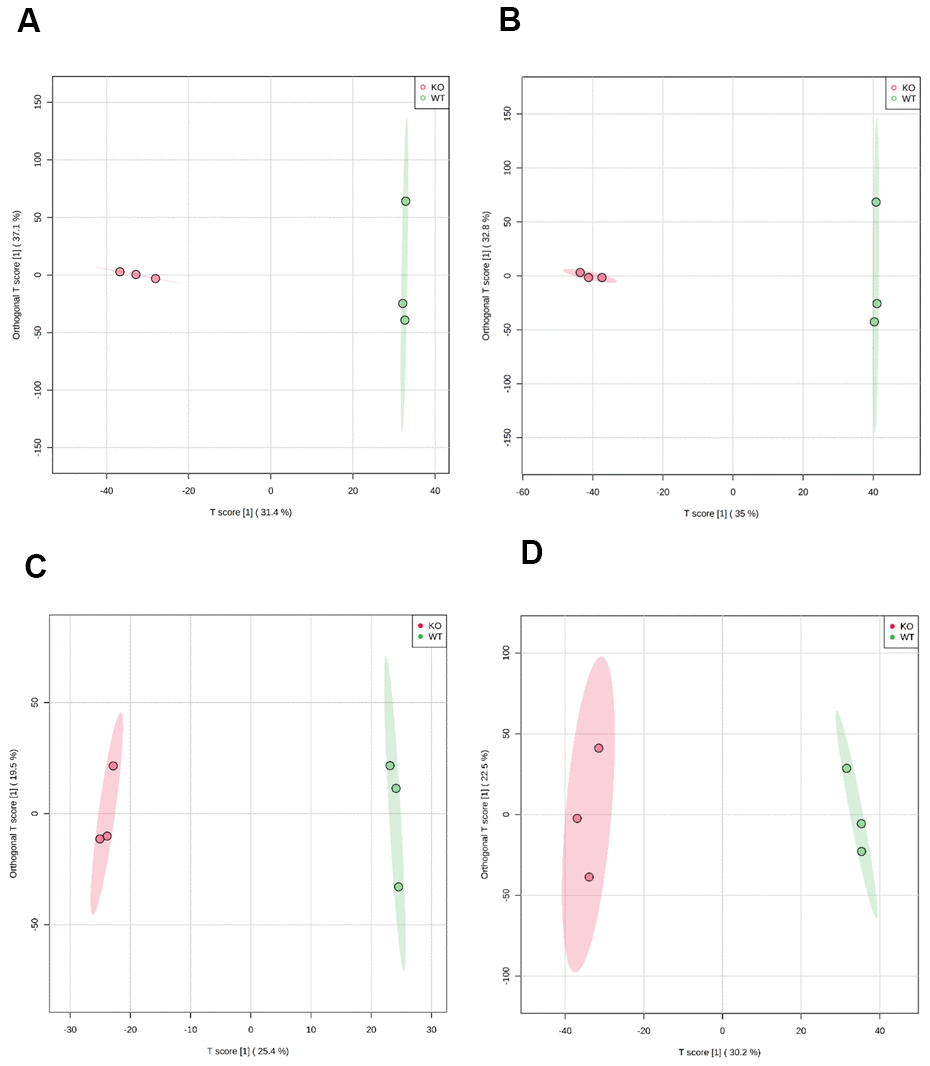
Figure 1. Scatter plot of scores based on the OPLS-DA model. (A) ESI+ scan in 50-week-old mice; (B) ESI- scan in 50-week-old mice; (C) ESI+ scan in 100-week-old mice; (D) ESI- scan in 100-week-old mice. Magenta circles indicate MTKO mice and green circles indicate WT mice.
Quantitative comparison of metabolites in the plasma between 50-week-old MTKO and WT male mice
Identification of metabolites in the plasma
We identified 599 differential metabolites, of which 242 were detected in the positive ion mode and 357 in the negative ion mode in the plasma of 50-week-old mice. The results of the hierarchical clustering analysis (HCA) of compounds with statistically significant differences between the groups of MTKO and WT male mice are summarized in Table 1. The levels of 19 metabolites were higher, whereas those of 27 others were lower, in the plasma of MTKO mice compared to that of WT mice.
Table 1. HCA data; identified metabolites showing a difference between MTKO and WT male group under ESI- and ESI+ scans of 50-week-old mice (n = 3).
| No. | Compound name | Molecular formula | RTa [min] | Monoisotopic mass | Delta (ppm) | FCb | P-value | VIPc | |||||||||||||||||||||||||||||||||||||||||||||||||||||||||||||||||||||||||||||||||||||||||||
| Positive ion (ESI+) | |||||||||||||||||||||||||||||||||||||||||||||||||||||||||||||||||||||||||||||||||||||||||||||||||||
| 1 | L-Lactic acid | C3H6O3 | 1.20 | 90.0317 | 5 | 0.317 | 0.006 | 1.68 | |||||||||||||||||||||||||||||||||||||||||||||||||||||||||||||||||||||||||||||||||||||||||||
| 2 | Oxoglutaric acid | C5H6O5 | 1.22 | 146.0215 | 3 | 0.283 | 0.005 | 1.68 | |||||||||||||||||||||||||||||||||||||||||||||||||||||||||||||||||||||||||||||||||||||||||||
| 3 | Citric acid | C6H8O7 | 1.23 | 192.0270 | 2 | 0.394 | 0.002 | 1.72 | |||||||||||||||||||||||||||||||||||||||||||||||||||||||||||||||||||||||||||||||||||||||||||
| 4 | Glycerol 3-phosphate | C3H9O6P | 1.12 | 172.0137 | 3 | 0.363 | 0.000 | 1.77 | |||||||||||||||||||||||||||||||||||||||||||||||||||||||||||||||||||||||||||||||||||||||||||
| 5 | Taurine | C2H7NO3S | 1.15 | 125.0147 | 3 | 0.349 | 0.038 | 1.50 | |||||||||||||||||||||||||||||||||||||||||||||||||||||||||||||||||||||||||||||||||||||||||||
| 6 | L-Phenylalanine | C9H11NO2 | 0.82 | 165.0790 | 2 | 2.540 | 0.026 | 1.55 | |||||||||||||||||||||||||||||||||||||||||||||||||||||||||||||||||||||||||||||||||||||||||||
| 7 | N-Lactoylphenylalanine | C12H15NO4 | 5.48 | 237.1001 | 2 | 0.270 | 0.016 | 1.61 | |||||||||||||||||||||||||||||||||||||||||||||||||||||||||||||||||||||||||||||||||||||||||||
| 8 | N6,N6,N6-Trimethyl-L-lysine | C9H20N2O2 | 0.85 | 188.1525 | 2 | 3.379 | 0.035 | 1.51 | |||||||||||||||||||||||||||||||||||||||||||||||||||||||||||||||||||||||||||||||||||||||||||
| 9 | Uracil | C4H4N2O2 | 1.22 | 112.0273 | 5 | 0.463 | 0.006 | 1.67 | |||||||||||||||||||||||||||||||||||||||||||||||||||||||||||||||||||||||||||||||||||||||||||
| 10 | Deoxycytidine | C9H13N3O4 | 0.99 | 227.0906 | 1 | 3.036 | 0.000 | 1.78 | |||||||||||||||||||||||||||||||||||||||||||||||||||||||||||||||||||||||||||||||||||||||||||
| 11 | Xanthine | C5H4N4O2 | 1.78 | 152.0334 | 2 | 0.031 | 0.001 | 1.75 | |||||||||||||||||||||||||||||||||||||||||||||||||||||||||||||||||||||||||||||||||||||||||||
| 13 | Xanthosine | C10H12N4O6 | 1.78 | 284.0757 | 2 | 0.033 | 0.002 | 1.73 | |||||||||||||||||||||||||||||||||||||||||||||||||||||||||||||||||||||||||||||||||||||||||||
| 14 | Azelaic acid | C9H16O4 | 6.07 | 188.1049 | 2 | 0.384 | 0.029 | 1.53 | |||||||||||||||||||||||||||||||||||||||||||||||||||||||||||||||||||||||||||||||||||||||||||
| 15 | Eicosapentaenoic acid | C20H30O2 | 13.24 | 302.2246 | 2 | 0.173 | 0.026 | 1.55 | |||||||||||||||||||||||||||||||||||||||||||||||||||||||||||||||||||||||||||||||||||||||||||
| 16 | Arachidonic acid | C20H32O2 | 13.61 | 304.2402 | 1 | 0.207 | 0.025 | 1.56 | |||||||||||||||||||||||||||||||||||||||||||||||||||||||||||||||||||||||||||||||||||||||||||
| 17 | Prostaglandin E2 | C20H32O5 | 8.26 | 352.2250 | 5 | 0.102 | 0.010 | 1.64 | |||||||||||||||||||||||||||||||||||||||||||||||||||||||||||||||||||||||||||||||||||||||||||
| 18 | CPA(16:0/0:0) | C19H37O6P | 15.77 | 392.2328 | 2 | 0.305 | 0.034 | 1.51 | |||||||||||||||||||||||||||||||||||||||||||||||||||||||||||||||||||||||||||||||||||||||||||
| 19 | LysoPC(10:0/0:0) | C19H39O7P | 8.21 | 410.2433 | 2 | 2.396 | 0.025 | 1.55 | |||||||||||||||||||||||||||||||||||||||||||||||||||||||||||||||||||||||||||||||||||||||||||
| 20 | LysoPE(0:0/14:0) | C19H40NO7P | 8.89 | 425.2542 | 2 | 2.657 | 0.013 | 1.62 | |||||||||||||||||||||||||||||||||||||||||||||||||||||||||||||||||||||||||||||||||||||||||||
| 21 | LysoPE(16:0/0:0) | C21H44NO7P | 10.26 | 453.2855 | 1 | 2.383 | 0.026 | 1.55 | |||||||||||||||||||||||||||||||||||||||||||||||||||||||||||||||||||||||||||||||||||||||||||
| 22 | LysoPC(16:0/0:0) | C24H50NO7P | 11.34 | 495.3325 | 1 | 2.178 | 0.003 | 1.72 | |||||||||||||||||||||||||||||||||||||||||||||||||||||||||||||||||||||||||||||||||||||||||||
| 23 | Glycocholic acid | C26H43NO6 | 12.74 | 465.3090 | 2 | 0.223 | 0.000 | 1.77 | |||||||||||||||||||||||||||||||||||||||||||||||||||||||||||||||||||||||||||||||||||||||||||
| 24 | Taurocholic acid | C26H45NO7S | 7.06 | 515.2917 | 15 | 0.230 | 0.014 | 1.62 | |||||||||||||||||||||||||||||||||||||||||||||||||||||||||||||||||||||||||||||||||||||||||||
| 25 | Glycochenodeoxycholate-3-sulfate | C26H43NO8S | 4.56 | 529.2709 | 31 | 0.134 | 0.005 | 1.69 | |||||||||||||||||||||||||||||||||||||||||||||||||||||||||||||||||||||||||||||||||||||||||||
| 12 | Bilirubin | C33H36N4O6 | 8.08 | 584.2635 | 0 | 5.342 | 0.007 | 1.66 | |||||||||||||||||||||||||||||||||||||||||||||||||||||||||||||||||||||||||||||||||||||||||||
| 26 | 4-Hydroxybenzaldehyde | C7H6O2 | 0.61 | 122.0368 | 26 | 0.360 | 0.001 | 1.73 | |||||||||||||||||||||||||||||||||||||||||||||||||||||||||||||||||||||||||||||||||||||||||||
| 27 | Indole-3-carboxaldehyde | C9H7NO | 0.61 | 145.0528 | 2 | 0.271 | 0.001 | 1.74 | |||||||||||||||||||||||||||||||||||||||||||||||||||||||||||||||||||||||||||||||||||||||||||
| 28 | DL-2-Aminooctanoic acid | C8H17NO2 | 1.23 | 159.1259 | 2 | 3.021 | 0.000 | 1.77 | |||||||||||||||||||||||||||||||||||||||||||||||||||||||||||||||||||||||||||||||||||||||||||
| Negative ion (ESI-) | |||||||||||||||||||||||||||||||||||||||||||||||||||||||||||||||||||||||||||||||||||||||||||||||||||
| 29 | L-Lactic acid | C3H6O3 | 0.82 | 90.0317 | 16 | 0.445 | 0.018 | 1.50 | |||||||||||||||||||||||||||||||||||||||||||||||||||||||||||||||||||||||||||||||||||||||||||
| 30 | L-Lysine | C6H14N2O2 | 0.76 | 146.1055 | 9 | 2.086 | 0.019 | 1.50 | |||||||||||||||||||||||||||||||||||||||||||||||||||||||||||||||||||||||||||||||||||||||||||
| 31 | Histidylglutamic acid | C11H16N4O5 | 1.31 | 284.1121 | 6 | 2.328 | 0.013 | 1.54 | |||||||||||||||||||||||||||||||||||||||||||||||||||||||||||||||||||||||||||||||||||||||||||
| 32 | Xanthosine | C10H12N4O6 | 1.76 | 284.0757 | 1 | 0.065 | 0.001 | 1.65 | |||||||||||||||||||||||||||||||||||||||||||||||||||||||||||||||||||||||||||||||||||||||||||
| 33 | Hexadecanedioic acid | C16H30O4 | 8.70 | 286.2144 | 1 | 2.391 | 0.001 | 1.66 | |||||||||||||||||||||||||||||||||||||||||||||||||||||||||||||||||||||||||||||||||||||||||||
| 34 | 12,13-DHOME | C18H34O4 | 14.29 | 314.2457 | 1 | 2.878 | 0.002 | 1.63 | |||||||||||||||||||||||||||||||||||||||||||||||||||||||||||||||||||||||||||||||||||||||||||
| 35 | 12-HETE | C20H32O3 | 13.93 | 320.2351 | 1 | 0.087 | 0.009 | 1.56 | |||||||||||||||||||||||||||||||||||||||||||||||||||||||||||||||||||||||||||||||||||||||||||
| 36 | 15-Keto-13,14-dihydroprostaglandin A2 | C20H30O4 | 11.12 | 334.2144 | 1 | 0.021 | 0.014 | 1.53 | |||||||||||||||||||||||||||||||||||||||||||||||||||||||||||||||||||||||||||||||||||||||||||
| 37 | 12(S)-HPETE | C20H32O4 | 10.59 | 336.2301 | 1 | 0.488 | 0.016 | 1.51 | |||||||||||||||||||||||||||||||||||||||||||||||||||||||||||||||||||||||||||||||||||||||||||
| 38 | Prostaglandin E2 | C20H32O5 | 8.56 | 352.2250 | 8 | 0.020 | 0.014 | 1.53 | |||||||||||||||||||||||||||||||||||||||||||||||||||||||||||||||||||||||||||||||||||||||||||
| 39 | Thromboxane B2 | C20H34O6 | 8.17 | 370.2355 | 1 | 0.179 | 0.001 | 1.65 | |||||||||||||||||||||||||||||||||||||||||||||||||||||||||||||||||||||||||||||||||||||||||||
| 40 | LysoPE(0:0/20:3(5Z,8Z,11Z)) | C25H46NO7P | 11.33 | 503.3012 | 1 | 2.629 | 0.000 | 1.69 | |||||||||||||||||||||||||||||||||||||||||||||||||||||||||||||||||||||||||||||||||||||||||||
| 41 | LysoPE(0:0/24:6(6Z,9Z,12Z,15Z,18Z,21Z)) | C29H48NO7P | 12.17 | 553.3168 | 2 | 2.313 | 0.002 | 1.64 | |||||||||||||||||||||||||||||||||||||||||||||||||||||||||||||||||||||||||||||||||||||||||||
| 42 | PG(16:1(9Z)/16:0) | C38H73O10P | 19.12 | 720.4941 | 1 | 8.253 | 0.008 | 1.57 | |||||||||||||||||||||||||||||||||||||||||||||||||||||||||||||||||||||||||||||||||||||||||||
| 43 | PS(22:0/15:0) | C43H84NO10P | 9.47 | 805.5833 | 4 | 0.332 | 0.003 | 1.62 | |||||||||||||||||||||||||||||||||||||||||||||||||||||||||||||||||||||||||||||||||||||||||||
| 44 | Bilirubin | C33H36N4O6 | 8.07 | 584.2635 | 1 | 7.311 | 0.004 | 1.60 | |||||||||||||||||||||||||||||||||||||||||||||||||||||||||||||||||||||||||||||||||||||||||||
| 45 | Dehydrochorismic acid | C10H8O6 | 13.40 | 224.0321 | 13 | 2.164 | 0.012 | 1.54 | |||||||||||||||||||||||||||||||||||||||||||||||||||||||||||||||||||||||||||||||||||||||||||
| 46 | Hydroxystilbamidine | C16H16N4O | 8.25 | 280.1324 | 6 | 3.681 | 0.002 | 1.63 | |||||||||||||||||||||||||||||||||||||||||||||||||||||||||||||||||||||||||||||||||||||||||||
| RTa, retention time; FCb, fold change in the comparison (average in MTKO mice/WT mice); VIPc, variable importance in the projection scores derived from discriminant analysis. The metabolites were filtered and confirmed by combining the results of the VIP values (VIP > 1.5), FC values (FC > 2.0), and t-test (P < 0.05). | |||||||||||||||||||||||||||||||||||||||||||||||||||||||||||||||||||||||||||||||||||||||||||||||||||
| Abbreviations: 12,13-DHOME, (12,13-dihydroxy-9Z-octadecenoic acid); 12-HETE, (12-hydroxy-eicosatetraenoic-acid); 12(S)-HPETE, (12S-hydroperoxy-5Z, 8Z, 10E, 14Z-eicosatetraenoic acid); PE, (phosphatidylethanolamine); PG, (phosphatidyl glycerol); PS, (phosphatidylserine). | |||||||||||||||||||||||||||||||||||||||||||||||||||||||||||||||||||||||||||||||||||||||||||||||||||
Fatty acids and their metabolites
The contents of C20 fatty acids and their metabolites, eicosanoids (eicosapentaenoic acid (EPA), P = 0.026, t-test, Table 1), arachidonic acid (P = 0.025, t-test, Table 1), 12-hydroxy-eicosatetraenoic-acid (12-HETE, P = 0.009, t-test, Table 1), 12S-hydroperoxy-5Z, 8Z, 10E, 14Z-eicosatetraenoic acid (12(S)-HPETE, P = 0.016, t-test, Table 1), prostaglandin E2 (PGE2, P = 0.010 in ESI+ mode and P = 0.014 in ESI- mode, t-test, Table 1), 15-keto-13,14-dihydro-prostaglandin A2 (15-keto-13,14-dihydro-PGA2, P = 0.014, t-test, Table 1), thromboxane B2 (TXB2, P = 0.001, t-test, Table 1), were smaller, whereas that of C18 fatty acid metabolite,12,13-dihydroxy-9Z-octadecenoic acid (12,13-DHOME) was larger in MTKO mice compared to WT mice (P = 0.002, t-test, Table 1). Reduced PGE2 levels in muscles contributes to muscle atrophy in aged mice [21].
Glycolysis/gluconeogenesis and tricarboxylic acid (TCA) cycle metabolites
Levels of L-lactic acid (P = 0.006 in ESI+ mode and P = 0.018 in ESI- mode, t-test, Table 1), oxoglutaric acid (P = 0.005, t-test, Table 1), glycerol 3-phosphate (P < 0.001, t-test, Table 1), and citric acid (P = 0.002, t-test, Table 1) were significantly lower in MTKO mice than in WT mice. These results may show differences in activity levels of glycolysis/gluconeogenesis and the TCA cycle between MTKO and WT mice at 50 weeks of age.
Amino acids and their metabolites
Among amino acids and their metabolites, the levels of taurine (2-aminoethane-1-sulfonic acid) and N-lactoylphenylalanine (P = 0.038, t-test, Table 1) were lower, whereas those of L-phenylalanine (P = 0.026, t-test, Table 1), L-lysine (P = 0.019, t-test, Table 1), N6,N6,N6-trimethyl-L-lysine (TML) (P = 0.035, t-test, Table 1 and Figure 2A), and histidylglutamic acid (P = 0.013, t-test, Table 1)were significantly higher in the plasma of MTKO mice than in that of WT mice. It has been reported that the plasma level of N-lactoylphenylalanine strongly correlates with plasma levels of lactate and L-phenylalanine [22]. Therefore, the low level of L-lactic acid could lead to L-phenylalanine accumulation in the plasma of MTKO mice. TML is an N-methylated compound of L-lysine. It is a component of histone proteins and an intermediate that is recognized as the precursor of L-carnitine (Figure 2E). The metabolic ability to L-lysine and TML may be weaker in MTKO mice than in WT mice. Hexadecanedioic acid, which is a long-chain dicarboxylic fatty acid, is converted to hexadecanedioylcarnitine by carnitine palmityltransferase (CPT) and is activated by mitochondrial fractions in the human liver for its degradation by β-oxidation [23]. In the plasma of MTKO mice, the concentration of hexadecanedioic acid (FC = 2.391, P = 0.001, t-test, Table 1) may be associated with the accumulation of TML as a carnitine precursor.
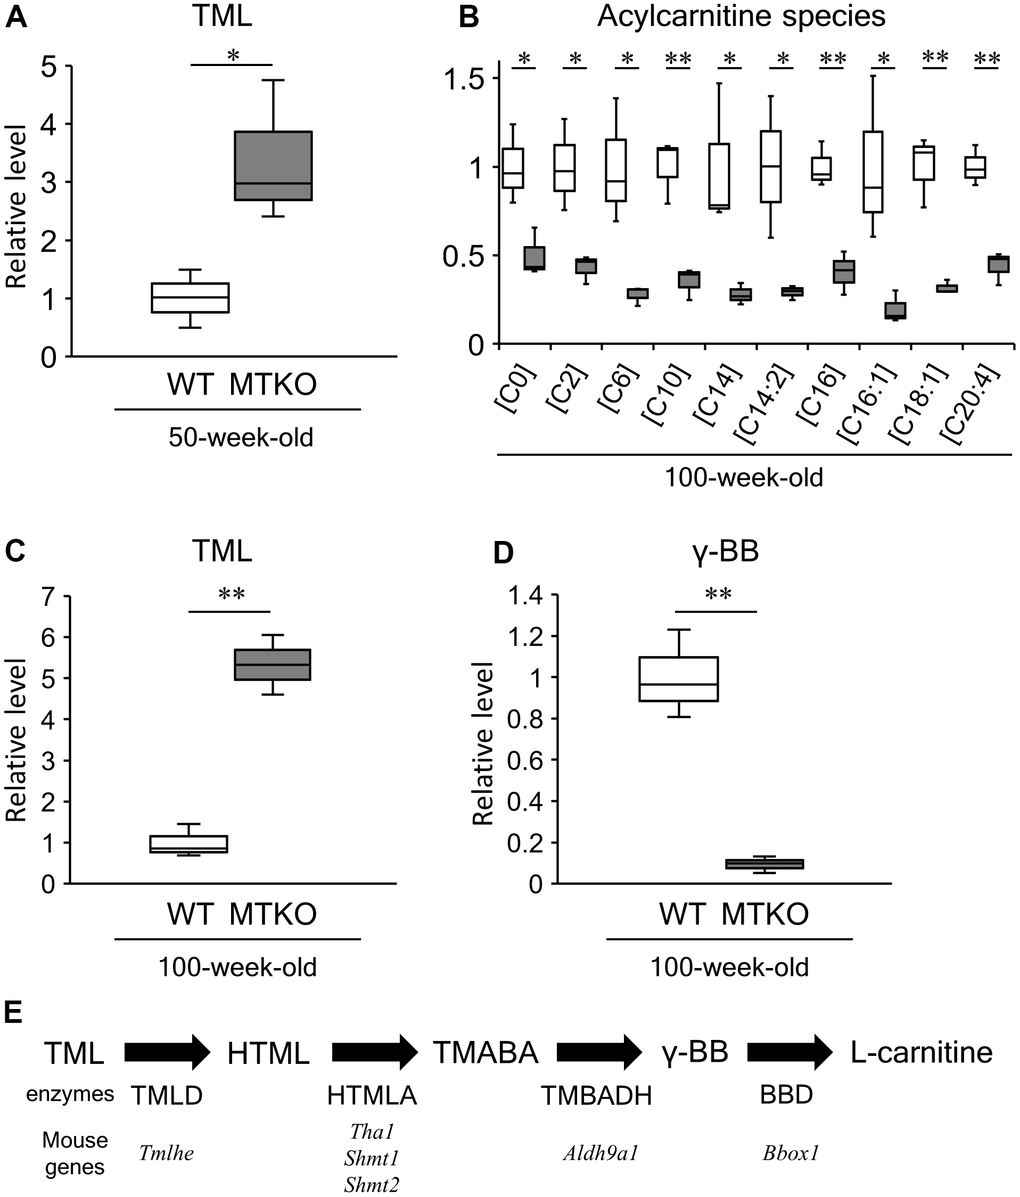
Figure 2. Levels of acylcarnitine species and carnitine biosynthesis intermediates in plasma of wild-type (WT) mice (white boxes) and MTKO mice (gray boxes). (A) N6,N6,N6-trimethyl-L-lysine (TML) level at 50 weeks of age; (B) Levels of L-carnitine [C0] and acylcarnitine species (L-acetylcarnitine [C2], Hexanoylcarnitine [C8], Decanoylcarnitine [C10], Tetradecanoylcarinitne [C14], 3,5-Tetradecadiencarnitine [C14:2], L-Palmitoylcarnitine [C16], 9-Hexadecenoylcarnitine [C16:1], Oleoylcarnitine [C18:1], Arachidonoylcarnitine [C20:4]) at 100 weeks of age; (C) TML level at 100 weeks of age; (D) Level of γ-butryobetaine (γ-BB), also known as 4-trimethylammoniobutanoic acid, at 100 weeks of age. The box denotes 25th and 75th percentiles; the line within the box denotes the 50th percentile; the whisker denotes standard deviation. (n = 3). *P < 0.05 and **P < 0.01. (E) Carnitine biosynthesis pathway. HTML, 3-hydroxyl-N6-trimethyl-L-lysine; TMABA, 4-trimethyl-aminobutyraldehyde; TML dioxygenase, TMLD; HTML aldolase, HTMLA; TMABA dehydrogenase, TMABADH; γ-BB dioxygenase, BBD.
Bile acids and bilirubin
The amounts of conjugated primary bile acids, glycocholic acid (P < 0.001, t-test, Table 1), taurocholic acid (P = 0.014, t-test, Table 1), and glycochenodeoxycholate-3-sulfate (P = 0.005, t-test, Table 1) were lower in MTKO mice than in WT mice. The level of taurocholic acid was correlated with different taurine levels in the plasma of both MTKO and WT mice. In contrast, the bilirubin level in the plasma of MTKO mice was markedly higher than that in the plasma of WT mice (P = 0.007 in ESI+ mode and P = 0.004 in ESI- mode, t-test, Table 1). In the liver, bilirubin is conjugated with glucuronic acid by glucuronyltransferase. Conjugated bilirubin is then excreted from hepatocytes into the bile canaliculus. The capacity of several conjugation reactions may be limited in the liver of MTKO mice.
Nucleobases and nucleosides
Among nucleobases and nucleosides, the contents of xanthine (P = 0.031, t-test, Table 1) and its nucleoside xanthosine (P = 0.033 in ESI+ mode and P = 0.001 in ESI- mode, t-test, Table 1) were remarkably lower in MTKO mice than in WT mice. Xanthine oxidoreductase (XOR) generates ROS, such as superoxide radicals and hydrogen peroxide, when it catalyzes the oxidation of hypoxanthine to xanthine, followed by the oxidation of xanthine to uric acid [24]. However, the ROS, which are synthesized in moderate amounts from xanthine with the catalytic activity of XOR, are essential for the appropriate functioning of many physiological pathways, thereby contributing to successful aging [25]. There is no evidence of high levels of ROS in aged MTKO mice. However, excessive lipid peroxidation, an indicator of oxidative stress, was observed in some tissues, including the heart [26], liver [27], and neurons [28] of MTKO mice treated with various anthropogenic stressors. Alterations in mitochondrial homeostasis, including a progressive decrease in ROS scavengers, cause ineffective ROS control and mediate cell stress responses towards age-dependent damage [29]. Due to the deficiency of MT as a ROS scavenger in mitochondria [30], the low level of xanthine in the plasma from MTKO mice might be the result of high utilization of xanthine to address a progressive generation of ROS during the aging process.
Other compounds
Among phospholipids, levels of lysophospholipid species were lower in the plasma of MTKO mice compared to that of WT mice (all P < 0.05, t-test, Table 1). Regarding metabolites probably derived from foods, the levels of 4-hydroxybenzaldehyde (P = 0.001, t-test, Table 1) and indole-3-carboxaldehyde (P = 0.001, t-test, Table 1) were significantly lower, whereas those of DL-2-aminooctanoic acid (P < 0.001, t-test, Table 1), dehydrochorismic acid (P = 0.012, t-test, Table 1), and hydroxystilbamidine (P = 0.002, t-test, Table 1) were significantly higher in the plasma of MTKO mice than in that of WT mice. These results may show differences in metabolism of the above-mentioned compounds from foods between MTKO and WT mice during a 6 h fast before plasma collection.
Quantitative comparison of metabolites in the plasma between MTKO and WT 100-week-old male mice
Identification of metabolites in the plasma
We identified 616 differential metabolites, of which 290 were detected in the positive ion mode and 326 in the negative ion mode in 100-week-old mouse plasma. HCA results of compounds with statistically significant differences between the MTKO and WT male groups are summarized in Table 2. The levels of 42 metabolites were higher, whereas those of 40 were lower in the plasma of MTKO mice than that in WT mice. Interestingly, many of these metabolites are involved in carnitine metabolism.
Table 2. HCA data; identified metabolites showing a difference between MTKO and WT male group under ESI- and ESI+ scans of 100-week-old mice (n = 3).
| No. | Compound name | Molecular formula | RTa [min] | Monoisotopic mass | Delta (ppm) | FCb | P-value | VIPc | |||||||||||||||||||||||||||||||||||||||||||||||||||||||||||||||||||||||||||||||||||||||||||
| Positive ion (ESI+) | |||||||||||||||||||||||||||||||||||||||||||||||||||||||||||||||||||||||||||||||||||||||||||||||||||
| 1 | Taurine | C2H7NO3S | 19.20 | 125.0147 | 26 | 0.257 | 0.045 | 1.63 | |||||||||||||||||||||||||||||||||||||||||||||||||||||||||||||||||||||||||||||||||||||||||||
| 2 | Creatine | C4H9N3O2 | 0.80 | 131.0695 | 4 | 0.358 | 0.000 | 1.98 | |||||||||||||||||||||||||||||||||||||||||||||||||||||||||||||||||||||||||||||||||||||||||||
| 3 | N-Acetylvaline | C7H13NO3 | 3.82 | 159.0895 | 4 | 2.309 | 0.022 | 1.74 | |||||||||||||||||||||||||||||||||||||||||||||||||||||||||||||||||||||||||||||||||||||||||||
| 4 | L-Phenylalanine | C9H11NO2 | 0.83 | 165.0790 | 4 | 3.391 | 0.002 | 1.91 | |||||||||||||||||||||||||||||||||||||||||||||||||||||||||||||||||||||||||||||||||||||||||||
| 5 | Indole-3-propionic acid | C11H11NO2 | 7.31 | 189.0790 | 4 | 2.632 | 0.018 | 1.77 | |||||||||||||||||||||||||||||||||||||||||||||||||||||||||||||||||||||||||||||||||||||||||||
| 6 | Indolelactic acid | C11H11NO3 | 6.08 | 205.0739 | 4 | 2.406 | 0.044 | 1.64 | |||||||||||||||||||||||||||||||||||||||||||||||||||||||||||||||||||||||||||||||||||||||||||
| 7 | Hippuric acid | C9H9NO3 | 4.39 | 179.0582 | 4 | 3.670 | 0.013 | 1.80 | |||||||||||||||||||||||||||||||||||||||||||||||||||||||||||||||||||||||||||||||||||||||||||
| 8 | N6,N6,N6-Trimethyl-L-lysine | C9H20N2O2 | 0.74 | 188.1525 | 4 | 5.326 | 0.001 | 1.94 | |||||||||||||||||||||||||||||||||||||||||||||||||||||||||||||||||||||||||||||||||||||||||||
| 9 | 4-Trimethylammoniobutanoic acid | C7H15NO2 | 0.80 | 145.1103 | 3 | 0.093 | 0.002 | 1.91 | |||||||||||||||||||||||||||||||||||||||||||||||||||||||||||||||||||||||||||||||||||||||||||
| 10 | L-Carnitine | C7H15NO3 | 0.81 | 161.1052 | 3 | 0.500 | 0.029 | 1.70 | |||||||||||||||||||||||||||||||||||||||||||||||||||||||||||||||||||||||||||||||||||||||||||
| 11 | L-Acetylcarnitine | C9H17NO4 | 0.81 | 203.1158 | 4 | 0.430 | 0.022 | 1.74 | |||||||||||||||||||||||||||||||||||||||||||||||||||||||||||||||||||||||||||||||||||||||||||
| 12 | Hexanoylcarnitine | C13H25NO4 | 5.28 | 259.1784 | 3 | 0.277 | 0.025 | 1.72 | |||||||||||||||||||||||||||||||||||||||||||||||||||||||||||||||||||||||||||||||||||||||||||
| 13 | Decanoylcarnitine | C17H33NO4 | 8.44 | 315.2410 | 4 | 0.351 | 0.005 | 1.87 | |||||||||||||||||||||||||||||||||||||||||||||||||||||||||||||||||||||||||||||||||||||||||||
| 14 | 3, 5-Tetradecadiencarnitine | C21H37NO4 | 9.62 | 367.2723 | 3 | 0.292 | 0.037 | 1.66 | |||||||||||||||||||||||||||||||||||||||||||||||||||||||||||||||||||||||||||||||||||||||||||
| 15 | Tetradecanoylcarnitine | C21H41NO4 | 10.85 | 371.3036 | 3 | 0.279 | 0.039 | 1.66 | |||||||||||||||||||||||||||||||||||||||||||||||||||||||||||||||||||||||||||||||||||||||||||
| 16 | 9-Hexadecenoylcarnitine | C23H43NO4 | 11.22 | 397.3192 | 3 | 0.199 | 0.043 | 1.64 | |||||||||||||||||||||||||||||||||||||||||||||||||||||||||||||||||||||||||||||||||||||||||||
| 17 | L-Palmitoylcarnitine | C23H45NO4 | 11.98 | 399.3349 | 3 | 0.405 | 0.004 | 1.88 | |||||||||||||||||||||||||||||||||||||||||||||||||||||||||||||||||||||||||||||||||||||||||||
| 18 | Oleoylcarnitine | C25H47NO4 | 12.26 | 425.3505 | 3 | 0.319 | 0.004 | 1.88 | |||||||||||||||||||||||||||||||||||||||||||||||||||||||||||||||||||||||||||||||||||||||||||
| 19 | Arachidonoylcarnitine | C27H45NO4 | 11.59 | 447.3349 | 3 | 0.439 | 0.003 | 1.90 | |||||||||||||||||||||||||||||||||||||||||||||||||||||||||||||||||||||||||||||||||||||||||||
| 20 | Eicosapentaenoyl Ethanolamide | C22H35NO2 | 15.86 | 345.2668 | 3 | 0.385 | 0.035 | 1.67 | |||||||||||||||||||||||||||||||||||||||||||||||||||||||||||||||||||||||||||||||||||||||||||
| 21 | N-Oleoyl tyrosine | C27H43NO4 | 11.03 | 445.3192 | 3 | 0.426 | 0.030 | 1.70 | |||||||||||||||||||||||||||||||||||||||||||||||||||||||||||||||||||||||||||||||||||||||||||
| 22 | Succinyladenosine | C14H17N5O8 | 0.89 | 383.1077 | 14 | 0.200 | 0.023 | 1.74 | |||||||||||||||||||||||||||||||||||||||||||||||||||||||||||||||||||||||||||||||||||||||||||
| 23 | LysoPC(16:0/0:0) | C24H50NO7P | 11.79 | 495.3325 | 1 | 0.396 | 0.025 | 1.72 | |||||||||||||||||||||||||||||||||||||||||||||||||||||||||||||||||||||||||||||||||||||||||||
| 24 | LysoPE(0:0/20:3(5Z,8Z,11Z)) | C25H46NO7P | 12.62 | 503.3012 | 2 | 0.459 | 0.048 | 1.62 | |||||||||||||||||||||||||||||||||||||||||||||||||||||||||||||||||||||||||||||||||||||||||||
| 25 | LysoPC(18:3(6Z,9Z,12Z)/0:0) | C26H48NO7P | 11.46 | 517.3168 | 4 | 2.221 | 0.006 | 1.86 | |||||||||||||||||||||||||||||||||||||||||||||||||||||||||||||||||||||||||||||||||||||||||||
| 26 | LysoPC(18:2(9Z,12Z)) | C26H50NO7P | 12.87 | 519.3325 | 2 | 2.205 | 0.034 | 1.68 | |||||||||||||||||||||||||||||||||||||||||||||||||||||||||||||||||||||||||||||||||||||||||||
| 27 | LysoPC(20:0) | C28H58NO7P | 15.07 | 551.3951 | 3 | 0.358 | 0.021 | 1.75 | |||||||||||||||||||||||||||||||||||||||||||||||||||||||||||||||||||||||||||||||||||||||||||
| 28 | LysoPC(22:2(13Z,16Z)/0:0) | C30H58NO7P | 14.98 | 575.3951 | 3 | 0.408 | 0.043 | 1.64 | |||||||||||||||||||||||||||||||||||||||||||||||||||||||||||||||||||||||||||||||||||||||||||
| 29 | PC(18:3(6Z,9Z,12Z)/P-16:0) | C42H78NO7P | 15.87 | 739.5516 | 2 | 2.764 | 0.019 | 1.76 | |||||||||||||||||||||||||||||||||||||||||||||||||||||||||||||||||||||||||||||||||||||||||||
| 30 | PC(16:0/22:6(4Z,7Z,10Z,13Z,16Z,19Z)) | C46H80NO8P | 16.25 | 805.5622 | 0 | 8.493 | 0.015 | 1.78 | |||||||||||||||||||||||||||||||||||||||||||||||||||||||||||||||||||||||||||||||||||||||||||
| 31 | PC(18:0/20:3(5Z,8Z,11Z)) | C46H86NO8P | 19.12 | 811.6091 | 2 | 3.231 | 0.001 | 1.93 | |||||||||||||||||||||||||||||||||||||||||||||||||||||||||||||||||||||||||||||||||||||||||||
| 32 | PC(20:5(5Z,8Z,11Z,14Z,17Z)/ 20:4(5Z,8Z,11Z,14Z)) | C48H78NO8P | 16.25 | 827.5465 | 2 | 10.691 | 0.004 | 1.88 | |||||||||||||||||||||||||||||||||||||||||||||||||||||||||||||||||||||||||||||||||||||||||||
| 33 | SM(d18:1/24:1(15Z)) | C47H93N2O6P | 19.13 | 812.6771 | 0 | 19.326 | 0.026 | 1.72 | |||||||||||||||||||||||||||||||||||||||||||||||||||||||||||||||||||||||||||||||||||||||||||
| 34 | Proline betaine | C7H13NO2 | 0.80 | 143.0946 | 4 | 2.115 | 0.004 | 1.88 | |||||||||||||||||||||||||||||||||||||||||||||||||||||||||||||||||||||||||||||||||||||||||||
| 35 | DL-2-Aminooctanoic acid | C8H17NO2 | 0.82 | 159.1259 | 3 | 3.365 | 0.012 | 1.80 | |||||||||||||||||||||||||||||||||||||||||||||||||||||||||||||||||||||||||||||||||||||||||||
| Negative ion (ESI-) | |||||||||||||||||||||||||||||||||||||||||||||||||||||||||||||||||||||||||||||||||||||||||||||||||||
| 36 | 3-Dehydrocarnitine | C7H13NO3 | 3.83 | 159.0895 | 9 | 2.499 | 0.004 | 1.73 | |||||||||||||||||||||||||||||||||||||||||||||||||||||||||||||||||||||||||||||||||||||||||||
| 37 | Ketoleucine | C6H10O3 | 3.76 | 130.0630 | 12 | 2.144 | 0.010 | 1.68 | |||||||||||||||||||||||||||||||||||||||||||||||||||||||||||||||||||||||||||||||||||||||||||
| 38 | 3-Hydroxymethylglutaric acid | C6H10O5 | 0.88 | 162.0528 | 9 | 0.444 | 0.007 | 1.70 | |||||||||||||||||||||||||||||||||||||||||||||||||||||||||||||||||||||||||||||||||||||||||||
| 39 | 3-Phenyllactic acid | C9H10O3 | 5.12 | 166.0630 | 9 | 2.694 | 0.039 | 1.52 | |||||||||||||||||||||||||||||||||||||||||||||||||||||||||||||||||||||||||||||||||||||||||||
| 40 | Kynurenic acid | C10H7NO3 | 3.70 | 189.0426 | 7 | 2.612 | 0.018 | 1.62 | |||||||||||||||||||||||||||||||||||||||||||||||||||||||||||||||||||||||||||||||||||||||||||
| 41 | cyclic 6-Hydroxymelatonin | C13H14N2O3 | 6.04 | 246.1004 | 4 | 4.580 | 0.008 | 1.69 | |||||||||||||||||||||||||||||||||||||||||||||||||||||||||||||||||||||||||||||||||||||||||||
| 42 | gamma-Glutamylvaline | C10H18N2O5 | 3.42 | 246.1216 | 3 | 3.216 | 0.000 | 1.80 | |||||||||||||||||||||||||||||||||||||||||||||||||||||||||||||||||||||||||||||||||||||||||||
| 43 | Hippuric acid | C9H9NO3 | 4.40 | 179.0582 | 7 | 3.729 | 0.011 | 1.67 | |||||||||||||||||||||||||||||||||||||||||||||||||||||||||||||||||||||||||||||||||||||||||||
| 44 | 2-Methylhippuric acid | C10H11NO3 | 4.87 | 193.0739 | 7 | 2.430 | 0.012 | 1.66 | |||||||||||||||||||||||||||||||||||||||||||||||||||||||||||||||||||||||||||||||||||||||||||
| 45 | Suberylglycine | C10H17NO5 | 4.21 | 231.1107 | 4 | 3.816 | 0.003 | 1.74 | |||||||||||||||||||||||||||||||||||||||||||||||||||||||||||||||||||||||||||||||||||||||||||
| 46 | Palmitoylglycine | C18H35NO3 | 15.17 | 313.2617 | 2 | 0.457 | 0.015 | 1.64 | |||||||||||||||||||||||||||||||||||||||||||||||||||||||||||||||||||||||||||||||||||||||||||
| 47 | Oleoyl glycine | C20H37NO3 | 15.55 | 339.2773 | 3 | 0.440 | 0.029 | 1.56 | |||||||||||||||||||||||||||||||||||||||||||||||||||||||||||||||||||||||||||||||||||||||||||
| 48 | Palmitic acid | C16H32O2 | 16.94 | 256.2402 | 4 | 0.350 | 0.005 | 1.72 | |||||||||||||||||||||||||||||||||||||||||||||||||||||||||||||||||||||||||||||||||||||||||||
| 49 | Oleic acid | C18H34O2 | 17.14 | 282.2559 | 3 | 0.491 | 0.012 | 1.66 | |||||||||||||||||||||||||||||||||||||||||||||||||||||||||||||||||||||||||||||||||||||||||||
| 50 | Sebacic acid | C10H18O4 | 4.98 | 202.1205 | 6 | 2.010 | 0.032 | 1.55 | |||||||||||||||||||||||||||||||||||||||||||||||||||||||||||||||||||||||||||||||||||||||||||
| 51 | Dodecanedioic acid | C12H22O4 | 8.34 | 230.1518 | 5 | 2.378 | 0.004 | 1.73 | |||||||||||||||||||||||||||||||||||||||||||||||||||||||||||||||||||||||||||||||||||||||||||
| 52 | Tetradecanedioic acid | C14H26O4 | 8.42 | 258.1831 | 3 | 4.188 | 0.003 | 1.74 | |||||||||||||||||||||||||||||||||||||||||||||||||||||||||||||||||||||||||||||||||||||||||||
| 53 | 3-Hydroxytetradecanedioic acid | C14H26O5 | 6.35 | 274.1780 | 3 | 8.523 | 0.005 | 1.72 | |||||||||||||||||||||||||||||||||||||||||||||||||||||||||||||||||||||||||||||||||||||||||||
| 54 | 3-Oxododecanoic acid | C12H22O3 | 10.37 | 214.1569 | 5 | 0.483 | 0.032 | 1.55 | |||||||||||||||||||||||||||||||||||||||||||||||||||||||||||||||||||||||||||||||||||||||||||
| 55 | 3-Hydroxydodecanoic acid | C12H24O3 | 10.43 | 216.1725 | 5 | 3.573 | 0.008 | 1.69 | |||||||||||||||||||||||||||||||||||||||||||||||||||||||||||||||||||||||||||||||||||||||||||
| 56 | Myristic acid | C14H28O2 | 15.57 | 228.2089 | 5 | 0.472 | 0.043 | 1.51 | |||||||||||||||||||||||||||||||||||||||||||||||||||||||||||||||||||||||||||||||||||||||||||
| 57 | 2-Hydroxymyristic acid | C14H28O3 | 11.55 | 244.2038 | 4 | 5.260 | 0.011 | 1.66 | |||||||||||||||||||||||||||||||||||||||||||||||||||||||||||||||||||||||||||||||||||||||||||
| 58 | Ricinoleic acid | C18H34O3 | 15.26 | 298.2508 | 3 | 0.261 | 0.033 | 1.55 | |||||||||||||||||||||||||||||||||||||||||||||||||||||||||||||||||||||||||||||||||||||||||||
| 59 | Mead acid | C20H34O2 | 16.63 | 306.2559 | 3 | 0.410 | 0.020 | 1.61 | |||||||||||||||||||||||||||||||||||||||||||||||||||||||||||||||||||||||||||||||||||||||||||
| 60 | 13-L-Hydroperoxylinoleic acid | C18H32O4 | 12.66 | 312.2301 | 2 | 2.571 | 0.024 | 1.59 | |||||||||||||||||||||||||||||||||||||||||||||||||||||||||||||||||||||||||||||||||||||||||||
| 61 | Docosapentaenoic acid (22n-3) | C22H34O2 | 16.27 | 330.2559 | 3 | 0.463 | 0.032 | 1.55 | |||||||||||||||||||||||||||||||||||||||||||||||||||||||||||||||||||||||||||||||||||||||||||
| 62 | Docosatetraenoic acid (22n-6) | C22H36O2 | 16.97 | 332.2715 | 3 | 0.362 | 0.016 | 1.64 | |||||||||||||||||||||||||||||||||||||||||||||||||||||||||||||||||||||||||||||||||||||||||||
| 63 | 12(S)-HPETE | C20H32O4 | 10.76 | 336.2301 | 3 | 2.631 | 0.037 | 1.53 | |||||||||||||||||||||||||||||||||||||||||||||||||||||||||||||||||||||||||||||||||||||||||||
| 64 | N-Stearoyltaurine | C20H41NO4S | 17.02 | 391.2756 | 3 | 6.329 | 0.020 | 1.61 | |||||||||||||||||||||||||||||||||||||||||||||||||||||||||||||||||||||||||||||||||||||||||||
| 65 | ADP | C10H15N5O10P2 | 14.02 | 427.0294 | 18 | 0.494 | 0.030 | 1.56 | |||||||||||||||||||||||||||||||||||||||||||||||||||||||||||||||||||||||||||||||||||||||||||
| 66 | 5alpha-Tetrahydrocortisol | C21H34O5 | 16.30 | 366.2406 | 25 | 0.409 | 0.026 | 1.58 | |||||||||||||||||||||||||||||||||||||||||||||||||||||||||||||||||||||||||||||||||||||||||||
| 67 | Androsterone glucuronide | C25H38O8 | 17.16 | 466.2567 | 14 | 0.402 | 0.000 | 1.81 | |||||||||||||||||||||||||||||||||||||||||||||||||||||||||||||||||||||||||||||||||||||||||||
| 68 | LysoPE(20:4(5Z,8Z,11Z,14Z)/0:0) | C25H44NO7P | 19.22 | 501.2855 | 3 | 2.287 | 0.027 | 1.58 | |||||||||||||||||||||||||||||||||||||||||||||||||||||||||||||||||||||||||||||||||||||||||||
| 69 | LysoPE(0:0/20:2(11Z,14Z)) | C25H48NO7P | 13.43 | 505.3168 | 4 | 0.499 | 0.027 | 1.57 | |||||||||||||||||||||||||||||||||||||||||||||||||||||||||||||||||||||||||||||||||||||||||||
| 70 | LysoPE(0:0/20:0) | C25H52NO7P | 15.85 | 509.3481 | 4 | 0.386 | 0.002 | 1.76 | |||||||||||||||||||||||||||||||||||||||||||||||||||||||||||||||||||||||||||||||||||||||||||
| 71 | LysoPE(0:0/22:6(4Z,7Z,10Z,13Z,16Z,19Z)) | C27H44NO7P | 11.88 | 525.2855 | 3 | 0.471 | 0.034 | 1.54 | |||||||||||||||||||||||||||||||||||||||||||||||||||||||||||||||||||||||||||||||||||||||||||
| 72 | LysoPS(18:0(9Z)/0:0) | C24H48NO9P | 19.35 | 525.3067 | 3 | 0.485 | 0.021 | 1.61 | |||||||||||||||||||||||||||||||||||||||||||||||||||||||||||||||||||||||||||||||||||||||||||
| 73 | LysoPE(22:2(13Z,16Z)/0:0) | C27H52NO7P | 14.90 | 533.3481 | 3 | 0.129 | 0.009 | 1.68 | |||||||||||||||||||||||||||||||||||||||||||||||||||||||||||||||||||||||||||||||||||||||||||
| 74 | LysoPI(0:0/18:0) | C27H53O12P | 11.34 | 600.3275 | 3 | 28.370 | 0.011 | 1.66 | |||||||||||||||||||||||||||||||||||||||||||||||||||||||||||||||||||||||||||||||||||||||||||
| 75 | LysoPI(20:4(5Z,8Z,11Z,14Z)/0:0) | C29H49O12P | 15.22 | 620.2962 | 3 | 26.399 | 0.021 | 1.60 | |||||||||||||||||||||||||||||||||||||||||||||||||||||||||||||||||||||||||||||||||||||||||||
| 76 | PG(16:1(9Z)/18:0) | C40H77O10P | 19.28 | 748.5254 | 2 | 5.073 | 0.003 | 1.74 | |||||||||||||||||||||||||||||||||||||||||||||||||||||||||||||||||||||||||||||||||||||||||||
| 77 | PS(20:2(11Z,14Z)/15:0) | C41H76NO10P | 19.32 | 773.5207 | 0 | 0.421 | 0.003 | 1.75 | |||||||||||||||||||||||||||||||||||||||||||||||||||||||||||||||||||||||||||||||||||||||||||
| 78 | Protocatechuic acid | C7H6O4 | 4.00 | 154.0266 | 9 | 15.130 | 0.005 | 1.72 | |||||||||||||||||||||||||||||||||||||||||||||||||||||||||||||||||||||||||||||||||||||||||||
| 79 | (S)-Oleuropeic acid | C10H16O3 | 8.16 | 184.1099 | 7 | 3.758 | 0.030 | 1.56 | |||||||||||||||||||||||||||||||||||||||||||||||||||||||||||||||||||||||||||||||||||||||||||
| 80 | Caffeic acid 3-O-sulfate | C9H8O7S | 4.27 | 259.9991 | 3 | 4.317 | 0.004 | 1.73 | |||||||||||||||||||||||||||||||||||||||||||||||||||||||||||||||||||||||||||||||||||||||||||
| 81 | Ferulic acid 4-O-sulfate | C10H10O7S | 4.30 | 274.0147 | 2 | 9.682 | 0.000 | 1.80 | |||||||||||||||||||||||||||||||||||||||||||||||||||||||||||||||||||||||||||||||||||||||||||
| 82 | 2-Phenylethyl beta-D-glucopyranoside | C14H20O6 | 5.18 | 284.1260 | 3 | 9.735 | 0.034 | 1.54 | |||||||||||||||||||||||||||||||||||||||||||||||||||||||||||||||||||||||||||||||||||||||||||
| RTa, retention time; FCb, fold change in the comparison (average in MTKO mice/WT mice); VIPc, variable importance in the projection scores derived from discriminant analysis. The metabolites were filtered and confirmed by combining the results of the VIP values (VIP > 1.5), FC values (FC > 2.0), and t-test (P < 0.05). | |||||||||||||||||||||||||||||||||||||||||||||||||||||||||||||||||||||||||||||||||||||||||||||||||||
| Abbreviations: PC, (phosphatidylcholine); SM, (sphingomyelin); 12(S)-HPETE, (12S-hydroperoxy-5Z, 8Z, 10E, 14Z-eicosatetraenoic acid); ADP, (adenosine diphosphate); PE, (phosphatidylethanolamine); PS, (phosphatidylserine); PI, (phosphatidylinositol); PG, (phosphatidyl glycerol). | |||||||||||||||||||||||||||||||||||||||||||||||||||||||||||||||||||||||||||||||||||||||||||||||||||
Carnitine metabolites
Levels of L-carnitine ((R)-3-hydroxy-4-(trimethylammonio) butyrate) and acylcarnitine species with different acyl chains were significantly lower in MTKO mice than in WT mice (all P < 0.05, t-test, Table 2 and Figure 2B). In contrast, TML levels in the plasma of MTKO mice were 5.33-fold greater than that in the plasma of WT mice (P = 0.001, t-test, Table 2) (Figure 2C). 4-trimethylammoniobutanoic acid, also known as γ-butryobetaine (γ-BB), is a metabolic intermediate in L-carnitine biosynthesis (Figure 2E), and its quantity in MTKO mice was less than one-tenth that in WT mice (P = 0.002, t-test, Table 2) (Figure 2D). Network analysis indicated that metabolites related to carnitine synthesis differed significantly between MTKO and WT mice (P = 0.0388, obtained from analysis of MBRole, Table 3 and Supplementary Figure 5). The level of 3-dehydrocarnitine, which is an intermediate in carnitine degradation, was 2.5-fold higher in MTKO mice than in WT mice (P = 0.004, t-test, Table 2).
Table 3. Pathway enrichment analysis of identified metabolites showing a difference between MTKO and WT male group under ESI+ scan of 100-week-old mice.
| Pathway name | Total | Hits | Expect | P value | Holm P | FDR | |||||||||||||||||||||||||||||||||||||||||||||||||||||||||||||||||||||||||||||||||||||||||||||
| Carnitine Synthesis | 22 | 3 | 0.773 | 0.0388 | 1.0 | 1.0 | |||||||||||||||||||||||||||||||||||||||||||||||||||||||||||||||||||||||||||||||||||||||||||||
| Beta Oxidation of Very Long Chain Fatty Acids | 17 | 2 | 0.598 | 0.117 | 1.0 | 1.0 | |||||||||||||||||||||||||||||||||||||||||||||||||||||||||||||||||||||||||||||||||||||||||||||
| Oxidation of Branched Chain Fatty Acids | 26 | 2 | 0.914 | 0.231 | 1.0 | 1.0 | |||||||||||||||||||||||||||||||||||||||||||||||||||||||||||||||||||||||||||||||||||||||||||||
| Taurine and Hypotaurine Metabolism | 12 | 1 | 0.422 | 0.351 | 1.0 | 1.0 | |||||||||||||||||||||||||||||||||||||||||||||||||||||||||||||||||||||||||||||||||||||||||||||
| Fatty acid Metabolism | 43 | 2 | 1.51 | 0.453 | 1.0 | 1.0 | |||||||||||||||||||||||||||||||||||||||||||||||||||||||||||||||||||||||||||||||||||||||||||||
| Mitochondrial Beta-Oxidation of Short Chain Saturated Fatty Acids | 27 | 1 | 0.949 | 0.624 | 1.0 | 1.0 | |||||||||||||||||||||||||||||||||||||||||||||||||||||||||||||||||||||||||||||||||||||||||||||
| Phenylalanine and Tyrosine Metabolism | 28 | 1 | 0.984 | 0.638 | 1.0 | 1.0 | |||||||||||||||||||||||||||||||||||||||||||||||||||||||||||||||||||||||||||||||||||||||||||||
| Mitochondrial Beta-Oxidation of Long Chain Saturated Fatty Acids | 28 | 1 | 0.984 | 0.638 | 1.0 | 1.0 | |||||||||||||||||||||||||||||||||||||||||||||||||||||||||||||||||||||||||||||||||||||||||||||
| Phospholipid Biosynthesis | 29 | 1 | 1.02 | 0.651 | 1.0 | 1.0 | |||||||||||||||||||||||||||||||||||||||||||||||||||||||||||||||||||||||||||||||||||||||||||||
| Arginine and Proline Metabolism | 53 | 1 | 1.86 | 0.857 | 1.0 | 1.0 | |||||||||||||||||||||||||||||||||||||||||||||||||||||||||||||||||||||||||||||||||||||||||||||
| Glycine and Serine Metabolism | 59 | 1 | 2.07 | 0.886 | 1.0 | 1.0 | |||||||||||||||||||||||||||||||||||||||||||||||||||||||||||||||||||||||||||||||||||||||||||||
| Bile Acid Biosynthesis | 65 | 1 | 2.29 | 0.91 | 1.0 | 1.0 | |||||||||||||||||||||||||||||||||||||||||||||||||||||||||||||||||||||||||||||||||||||||||||||
| A P-value was obtained from analysis of MBRole. Total, the total number of metabolite in the pathway dataset; Expect, the expectation value; Hits, the number of metabolites in the experimental dataset matching the pathway dataset; Holm P, the P value adjusted by Holm-Bonferroni method; FDR, the P value adjusted using False Discovery Rate. | |||||||||||||||||||||||||||||||||||||||||||||||||||||||||||||||||||||||||||||||||||||||||||||||||||
Aliphatic dicarboxylic acids and fatty acid metabolites
The levels of sebacic acid, dodecanedioic acid, tetradecanedioic acid, and 3-hydroxytetradecanedioic acid, which are aliphatic dicarboxylic acids, were higher in the plasma of MTKO mice than in the plasma of WT mice (P = 0.032, 0.004, 0.003, and 0.005, respectively, t-test, Table 2). In humans, levels of sebacic acid are increased in the urine of patients with carnitine-acylcarnitine translocase deficiency, which is an inborn error of metabolism [31]. Dodecanedioic acid is a marker of hepatic CPT Iα-deficiency [32]. 3-hydroxytetradecanedioic acid is detected in the urine of patients with thanatophoric dysplasia type I with fibroblast growth factor receptor 3 gene mutation (S249C) due to incomplete fatty acid metabolism [33].
Hippuric acid, 2-methylhippuric acid, and suberylglycine are acyl glycines, which are minor fatty acid metabolites. The levels of these acyl glycines are increased in disorders associated with mitochondrial fatty acid β-oxidation. Thus, in the plasma of MTKO mice, higher levels of these minor fatty acid metabolites (all P < 0.05, t-test, Table 2) and the markers of fatty acid metabolism disorder can be ascribed to the lower levels of carnitine compounds. Levels of acyl glycines, palmitoylglycine, and oleoyl glycine were lower in the plasma of MTKO mice compared to that of WT mice (P = 0.015 and 0.029, respectively, t-test, Table 2). This may be because the plasma levels of palmitic acid and oleic acid were also lower in MTKO mice than in WT mice (P = 0.005 and 0.012, respectively, t-test, Table 2). The capacity of fatty acid catabolism and fatty acid biosynthesis in MTKO mice may be weaker than that in WT mice.
Other minor fatty acid metabolites were also identified. The level of 3-oxododecanoic acid in MTKO mice was lower (P = 0.032, t-test, Table 2), but that of its hydroxide, 3-hydroxydodecanoic acid, was higher in MTKO mice than in WT mice (P = 0.008, t-test, Table 2). This tendency was similar to that of myristic acid (P = 0.043, t-test, Table 2) and its hydroxide, 2-hydroxymyristic acid (P = 0.011, t-test, Table 2). In humans, 3-oxododecanoic acid is involved in fatty acid biosynthesis, and 3-oxododecanoic acid can be converted into 3-hydroxydodecanoic acid. 3-hydroxydodecanoic acid is a fatty acid associated with fatty acid metabolic disorders, such as medium-chain acyl CoA dehydrogenase deficiency, which shows low plasma and tissue carnitine levels [34, 35]. Levels of ricinoleic acid and mead acid, which are unsaturated n-9 fatty acid metabolites, were lower in MTKO mice (P = 0.033 and 0.020, respectively, t-test, Table 2). Levels of 13-L-hydroperoxylinoleic acid (13(S)-HPODE) and 12(S)-HPETE were greater in MTKO mice than those in WT mice (P = 0.024 and 0.037, respectively, t-test, Table 2). Further, levels of very long chain fatty acids, docosapentaenoic acid (22n-3), and docosatetraenoic acid (22n-6) were lower in MTKO mice than in WT mice (P = 0.032 and 0.016, respectively, t-test, Table 2). The levels of N-oleoyl-tyrosine and eicosapentaenoyl ethanolamide (EPEA) were lower in MTKO mice than in WT mice (P = 0.030 and 0.035, respectively, t-test, Table 2), although N-stearoyltaurine levels in MTKO mice were 6.3-fold higher than that in WT mice (P = 0.020, t-test, Table 2).
Phospholipids
Phospholipid species levels were higher, whereas lysophospholipid species were lower in the plasma of MTKO mice compared to that in the plasma of WT mice. As an exception, the levels of lysophosphatidylinositols, lysoPI (0:0/18:0), and lysoPI (20:4 (5Z, 8Z, 11Z, 14Z)/0:0) were significantly higher (FC > 26) in MTKO mice than in WT mice (P = 0.011 and 0.021, respectively, t-test, Table 2).
Metabolites of amino acids and other compounds
Other than carnitine species, various amino acid metabolites were also identified. The levels of taurine and creatine (2-(N-methylcarbamimidamido) acetic acid) in the plasma of MTKO mice were lower than those in the plasma of WT mice (P = 0.045 and P < 0.001, respectively, t-test, Table 2). Both are mainly biosynthesized in the liver and are widely distributed in various tissues, especially in the skeletal muscle, heart, brain, liver, kidney, and retina. Levels of valine metabolites (N-acetylvaline and γ-glutamylvaline (P = 0.022 and P < 0.001, respectively, t-test, Table 2)), L-phenylalanine (P = 0.002, t-test, Table 2) and its metabolite (3-phenyllactic acid, P = 0.039, t-test, Table 2), tryptophan metabolites (indole-3-propionic acid, indolelactic acid, kynurenic acid, and cyclic 6-hydroxymelatonin (P = 0.018, 0.044, 0.018, and 0.008, respectively, t-test, Table 2)), and ketoleucine (P = 0.010, t-test, Table 2) were higher in MTKO mice than in WT mice. Among ribonucleotide metabolites, levels of succinyladenosine, a precursor of AMP and ADP, were lower in MTKO mice than in WT mice (P = 0.023, t-test, Table 2). Among steroid metabolites, levels of 5α-tetrahydrocortisol and androsterone glucuronide in MTKO mice were lower than that in WT mice (P = 0.026 and P < 0.001, respectively, t-test, Table 2). Levels of some metabolites, probably derived from plant foods, such as proline betaine (P = 0.004, t-test, Table 2), protocatechuic acid (P = 0.005, t-test, Table 2), (S)-oleuropeic acid (P = 0.030, t-test, Table 2), caffeic acid 3-O-sulfate (P = 0.004, t-test, Table 2), ferulic acid 4-O-sulfate (P < 0.001, t-test, Table 2), and 2-phenylethyl β-D-glucopyranoside (P = 0.034, t-test, Table 2), and those probably derived from animal foods, such as DL-2-Aminooctanoic acid (P = 0.012, t-test, Table 2), were significantly higher in the plasma of MTKO mice compared to that in WT mice. The results may show differences in metabolism of these compounds between MTKO and WT mice during a 6 h fast before plasma collection.
Common features and properties of metabolites in plasma among 50-week- and 100-week-old mice
Compounds found in smaller quantities in the plasma of male MTKO mice compared to that of male WT mice
Levels of the common compound taurine were lower in the plasma of male MTKO mice compared to that of male WT mice at both 50 and 100 weeks of age (Tables 1, 2). Taurine has several functions, such as conjugation with bile acids, antioxidants, osmolytes, membrane stabilizers, and as a modulator of calcium signaling [36–38]. It protects the cardiovascular system [39], skeletal muscle [40, 41], retina [42], and central nervous system [43] against pathology and disease [44]. Taurine depletion shortens the lifespan of mice [45, 46]. Since rodents, unlike cats and humans, exhibit considerable biosynthetic capacity for taurine [47], MT gene deficiency would have a significant influence on the biosynthesis pathway and plasma levels of taurine in mice. Taurine levels in the plasma of MTKO mice were approximately one-third of that in WT mice at 50 weeks of age, and this level decreased in 100-week-old WT mice to approximately one-fourth of the previously observed level. This decrease in relative values with age may lead to muscular depression, and disorders of the cardiovascular system, the eye, and central nervous system in MTKO mice, and may finally reduce lifespan. Unlike taurine, creatine levels were lower in 100-week-old MTKO mice compared to WT mice. Creatine is mainly synthesized in the liver and has potential beneficial roles that are nearly as effective as taurine in cardiovascular function, muscle mass, cognitive function, and lifespan [38, 48]. The low levels may be a result of accelerated aging of the liver caused by MT deficiency.
Compounds found in larger quantities in the plasma of male MTKO mice versus that of WT mice
The common metabolites that were found to be consistently higher in the plasma of MTKO mice compared to that of WT mice at 50 and 100 weeks of age were L-phenylalanine, TML, and DL-2-aminooctanoic acid (Tables 1, 2). Phenylketonuria (PKU) is an inborn error of metabolism that results from a deficiency in phenylalanine hydroxylase (PAH), the enzyme catalyzing the conversion of phenylalanine to tyrosine. PKU results in severe hyperphenylalaninemia. The enzyme activity of PAH may decrease with age in the MTKO mice. However, similar to that of a mouse model of mild hyperphenylalaninemia (Pahenu1 variant) [49], the level of phenylalanine in the plasma of MTKO mice may have little effect on its lifespan. DL-2-aminooctanoic acid is an α-amino fatty acid derived from food. The higher level of DL-2-aminoctanoic acid in the plasma of MTKO mice compared to WT mice may be caused by the low metabolic activity of fatty acids.
Influences of MT deficiency on the carnitine biosynthesis pathway
In animals, L-carnitine is biosynthesized from TML in four enzyme-catalyzed steps, as summarized in Figure 2E [50, 51]. The first enzyme, TML dioxygenase (TMLD), catalyzes the hydroxylation of TML to produce 3-hydroxy-TML (HTML). TMLD is encoded by the TML hydroxylase, epsilon (Tmlhe) gene in mice. In the second step, HTML aldolase (HTMLA) catalyzes the aldolytic cleavage of HTML into 4-N-trimethylaminobutyraldehyde (TMABA) and glycine. In mice, it is currently thought that threonine aldolase 1 (THA1, encoded by Tha1), and serine hydroxymethyltransferase (SHMT, encoded by Shmt) possess HTMLA activity. The third enzyme, TMABA dehydrogenase (TMABADH), catalyzes the dehydrogenation of TMABA into γ-BB. TMABADH is encoded by the aldehyde dehydrogenase 9 subfamily A1 (Aldh9a1) gene in mice. In the final step, γ-BB dioxygenase (BBD) catalyzes the hydroxylation of γ-BB into L-carnitine. BBD is encoded by the γ-BB, 2-oxoglutarate dioxygenase 1 (Bbox1) gene in mice. The highest TMLD activity is found in the kidney but is also present in the liver, skeletal muscle, heart, and brain in rats and humans [52–54]. The highest enzyme activities for subsequent processes converting HTML to L-carnitine are seen in the liver of rodents. OCTN2, which is encoded by the Slc22a5 gene, is an organic cation/carnitine transporter that controls the storage of L-carnitine [55].
The relative level of TML in the plasma of MTKO mice was 3.38-fold of that recorded in WT mice at 50 weeks of age (Table 1 and Figure 2A), and then increased to 5.33-fold of that in WT mice at 100 weeks of age (Table 2 and Figure 2C). Levels of γ-BB, L-carnitine, and acylcarnitines recorded in MTKO mice were lower than those observed in 100-week-old WT mice, unlike 50-week-old mice. These results show that the TML level in the plasma of MTKO mice was consistently higher than that observed in the plasma of WT mice, and that the lower levels of γ-BB and L-carnitine in MTKO mice compared to WT mice are dependent on aging.
In order to investigate why levels of carnitine-related metabolites in plasma differed between MTKO and WT mice and if there was a time-dependent change in their levels, we measured the mRNA expression levels of enzymes associated with the carnitine biosynthesis pathway and carnitine transporter in the liver and kidney of 50-week- and 100-week-old male mice. Quantitative reverse transcription PCR (RT-PCR) analysis showed that the mRNA level of Tmlhe in MTKO mice was about one-tenth of that in WT mice at both middle and advanced age in the kidney (Figures 3A, 4A) and liver (Figures 3B, 4B). There were statistically non-significant differences in the mRNA levels of other enzymes (Tha1 (Figures 3C, 4C), Shmt1 (Figures 3D, 4D), Shmt2 (Figures 3E, 4E), Aldh9a1 (Figures 3F, 4F), Bbox1 (Figures 3G, 4G)), and transporter (Slc22a5 (Figures 3H, 4H)) in the liver of MTKO and WT mice. Therefore, the higher level of TML in the plasma of MTKO mice at 50 weeks and 100 weeks of age would be caused by the constant lower expression level of Tmlhe in the kidney and liver of MTKO mice compared to WT mice. The low TMLD activity of the kidney and liver in MTKO mice may decrease the metabolism from TML to HTML at middle age, suggesting accumulation of TML in plasma, and eventually decrease the biosynthesis of γ-BB and L-carnitine at advanced ages.
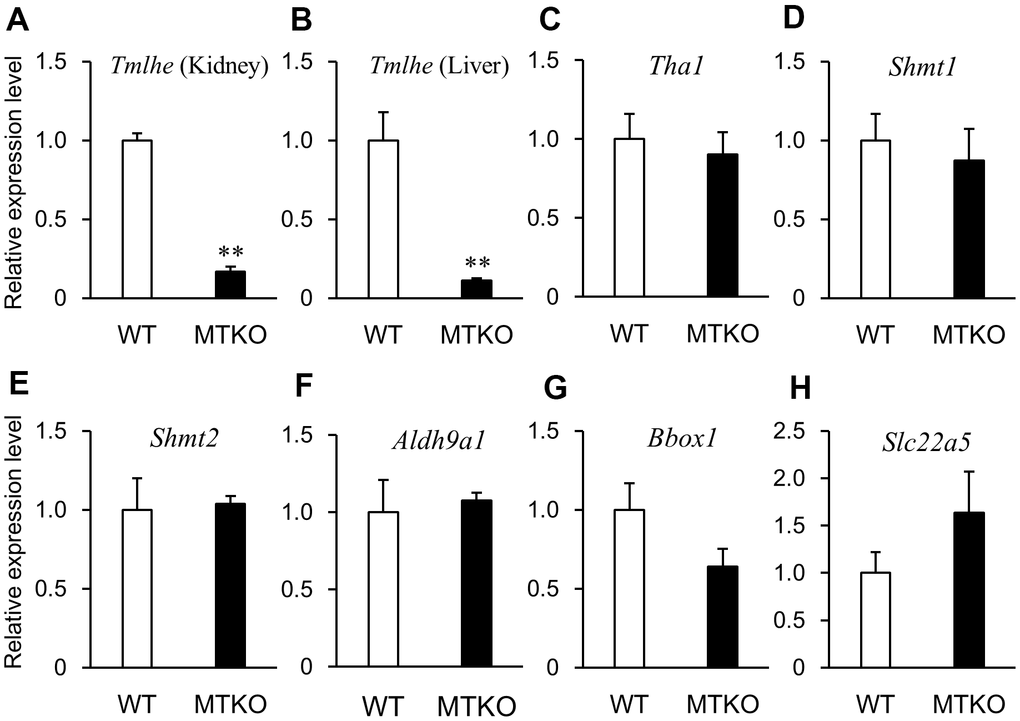
Figure 3. mRNA expression levels of enzymes associated with carnitine biosynthesis and carnitine transporter in wild-type (WT) mice (white columns) and MTKO mice (black columns) at 50 weeks of age. (A) Tmlhe gene in kidney; (B) Tmlhe gene, (C) Tha1 gene, (D) Shmt1 gene, (E) Shmt2 gene, (F) Aldh9a1 gene, (G) Bbox1 gene, and (H) Slc22a5 gene in liver. The data are expressed as ratios to the mean values in the WT group. Values are presented as the mean ± SE (n = 3). *P < 0.05 and **P < 0.01.
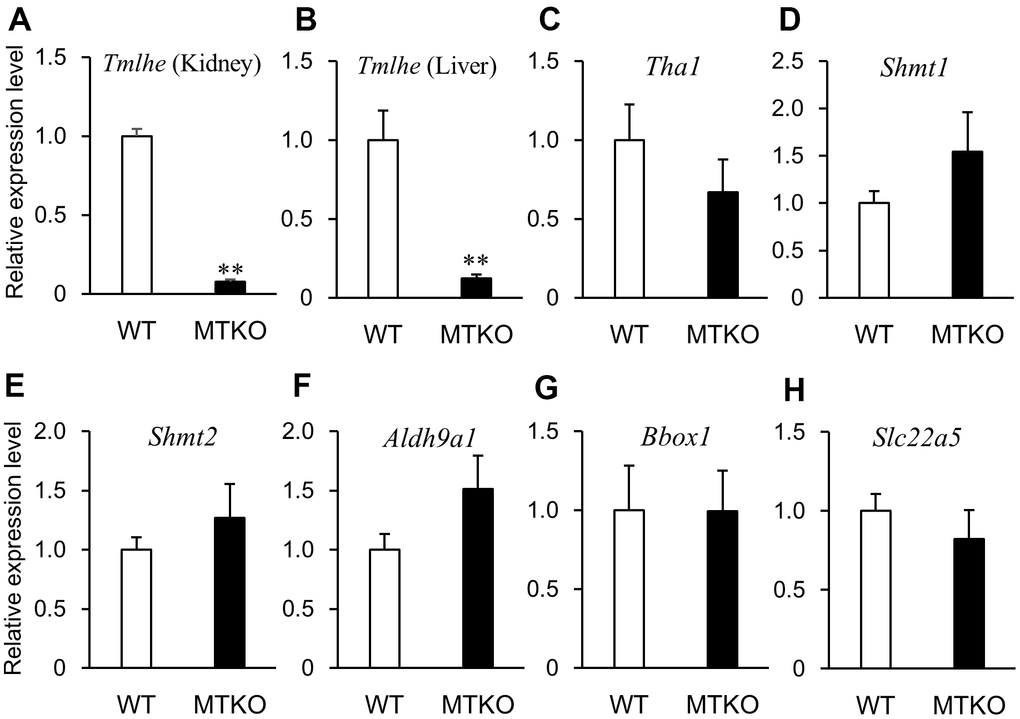
Figure 4. mRNA expression levels of enzymes associated with carnitine biosynthesis and carnitine transporter in wild-type (WT) mice (white columns) and MTKO mice (black columns) at 100 weeks of age. (A) Tmlhe gene in kidney; (B) Tmlhe gene, (C) Tha1 gene, (D) Shmt1 gene, (E) Shmt2 gene, (F) Aldh9a1 gene, (G) Bbox1 gene, and (H) Slc22a5 gene in liver. The data are expressed as ratios to the mean values in the WT group. Values are presented as the mean ± SE (n = 3). *P < 0.05 and **P < 0.01.
Discussions
In humans, MT levels show an age-dependent increase in the liver and kidney [56] and increase in the mild old age, and decline in very old age in lymphocytes [57]. However, there are individual differences in the expression levels of MTs [56] and polymorphisms in MT loci [17]. Since high MT expression could protect organs and cultured cells from oxidative stress-induced senescence in mice and humans [58–61], the amount of MT protein in tissues is critical for the maintenance of organ function and longevity. However, MTs are inducible genes with lower basal expression under mild stressful conditions. Hence, the comparison of aging patterns between MTKO mice and WT mice in daily life would provide a basis for understanding longevity at the basal level of MT. In order to investigate how MT genes deficiency accelerates the aging of mice, we performed a metabolomic analysis of plasma in middle-aged 50-week-old mice and aged 100-week-old mice using LC-TOF-MS.
In this study, we found that various metabolites associated with L-carnitine and fatty acid metabolism were extracted by comparative metabolomic analyses of the plasma in MTKO and WT mice. L-carnitine is essential for the transfer of long-chain fatty acids across the inner mitochondrial membrane for the subsequent β-oxidation of fatty acids [62]. Mitochondrial dysfunction is closely associated with aging [63]. There is an age-related decrease in L-carnitine levels in the brain and plasma of rats, and age-associated mitochondrial decay can be reversed in older rats by feeding them acetylcarnitine [64]. The carnitine shuttle in mitochondria is associated with the lifespan of a Drosophila model of amyotrophic lateral sclerosis based on neuronal or glial expression of human TDP-43, which exhibits dyslipidemia [65]. Based on our results, higher TML levels in the plasma of MTKO mice compared to that of WT mice at 50 weeks of age evoked potential hypometabolism of TML in MTKO mice, thereby leading to lower L-carnitine levels in MTKO mice at 100 weeks of age; this was suggested as the cause of higher levels of minor fatty acid metabolites in the plasma of aged MTKO mice than in the plasma of aged WT mice. The fatty acid metabolic disorder in MTKO mice may have led to high-fat diet-induced fatty liver and obesity [66] and a shortened lifespan [20]. Carnitine protects from oxidative stress and extends the lifespan of C. elegans [67]. Older MTKO mice with low L-carnitine plasma levels may be vulnerable to oxidative stress enhanced by the deficiency of MT, as MT is an antioxidant. A previous study found that hepatic L-carnitine levels in MTKO mice were significantly lower than those in WT mice, and the L-carnitine level in MTKO mice fed a high-fat diet decreased with an increase in restraint stress intensity; however, the stress had no effect on L-carnitine levels in WT mice [68]. MT proteins may prevent decreasing L-carnitine levels induced by exposure to constant stress and aging. Cancer patients may present with carnitine deficiency [69], and L-carnitine prevents diethylnitrosamine (DENA)-induced hepatic carcinogenesis in rats [70]. In addition, MTKO mice showed a relatively high incidence of macroscopic tumor masses in the liver [71], suggesting that MT proteins prevent liver carcinogenesis by ensuring carnitine synthesis. The levels of L-carnitine and carnitine biosynthesis intermediates are very similar in rats and mice, although large differences in enzyme activities and kinetics of the enzymes involved in carnitine biosynthesis were found between rats and mice [72]. TML administered to rats was almost completely converted to L-carnitine [73]. We demonstrated that plasma TML levels in MTKO mice were significantly higher than levels observed in WT mice, and Tmlhe mRNA levels in the kidney and liver in MTKO mice was approximately 10-fold lower than those in WT mice liver and kidney, even at 50 weeks of age, suggesting that the lower TMLD activity in MTKO mice compared to WT mice has an enormous influence on the conversion from TML to HTML, followed by carnitine biosynthesis.
L-carnitine levels in the body often decrease with age [74, 75]. However, mice can also obtain L-carnitine from a daily diet, suggesting that the lower level of L-carnitine and acylcarnitine species in the plasma of MTKO mice compared to plasma of WT mice at 100 weeks of age depends on the low expression level of Tmlhe in MTKO mice. Therefore, the effect of MT gene deficiency on decreased L-carnitine storage becomes apparent during aging. In fact, the levels of γ-BB, the last intermediate of carnitine biosynthesis, and those of L-carnitine in the plasma of MTKO mice were considerably lower than those in the plasma of WT mice at 100 weeks of age.
The human ortholog of mouse threonine aldolase gene Tha1, also known as Gly1, which catalyzes the conversion of HTML to TMABA, is a pseudogene [76]. In addition, administration of TML leads to increased excretion of TML in humans [52]. For these reasons, TML metabolism is thought to be weaker in humans than in rodents [50]. Therefore, the role of MT proteins may be more important for carnitine biosynthesis in humans than in rodents, and high levels of TML in plasma may be a biomarker of accelerated aging caused by MT protein dysfunction.
The enzyme activity of rat TMLHE is inhibited by soft metal ions, including cadmium, zinc, and sulfhydryl reagents [53]. MT proteins act as chelators for cadmium and zinc and react with sulfhydryl reagents [77], suggesting that MT proteins protect not only the expression of Tmlhe mRNA but also THLHE enzyme activity. This study revealed the metabolic abnormalities of carnitine biosynthesis in MTKO mice, which could trigger lifespan shortening in mice. However, further studies are required to determine why Tmlhe mRNA expression was suppressed in the liver and kidney of MTKO mice.
Although we performed sufficient statistical analyses on metabolomics results, it is important for us to note the small sample sizes of MTKO and WT mice at middle age and advanced age in this study. Our sample sizes were smaller due to the cost of animal studies, as well as the humane use of animals in scientific experiments. Therefore, our findings should be interpreted with caution and viewed as results in hypothesis-generating research. Nevertheless, metabolomics analysis of plasma revealed the metabolic abnormalities of carnitine biosynthesis in aged MTKO mice. These abnormalities were attributed to the lower expression of Tmlhe mRNA in the kidney and liver of MTKO mice compared to WT mice. This finding may have a profound impact on aging research, as there are few studies depicting the downregulation of the Tmlhe gene. Further research is required to elucidate the mechanism underlying downregulation of the Tmlhe gene by MT gene deficiency. Moreover, metabolites other than carnitine-related compounds deserve further investigation.
Materials and Methods
Animals and treatment
MTKO mice (129S7/SvEvBrd-Mt1tm1Bri Mt2tm1Bri/J) and WT mice (129S1/SvImJ) were purchased from The Jackson Laboratory (Bar Harbor, ME, USA). These mice were maintained under specific pathogen-free conditions and mated only with the 129/Sv mouse strain to maintain the genetic background. The mice were housed in a temperature-controlled room at 22° C with 55 ± 5% humidity under a 12 h light/dark cycle, fed a chow diet (Oriental Yeast, Tokyo, Japan), and provided with drinking water ad libitum. The study was conducted according to the guidelines of the Japanese Ministry of Education, Culture, Sports, Science, and Technology, and approved by the Ethics Committee of Tokushima Bunri University (protocol code #16-1 and date of approval; 20th April, 2018).
Sample preparation
Before blood sampling, the mice were fasted for 6 h to reduce the immediate effects of dietary intake on the plasma constituents. The animals were sacrificed using isoflurane (FUJIFILM Wako Pure Chemical, Osaka, Japan), and each organ was removed. Whole blood was collected in a 1.5 mL tube with 60 IU sodium heparin (Nacalai Tesque, Kyoto, Japan) in 25 μL saline, and was centrifuged at 800 ×g for 10 min at 20° C. Collected organs and plasma supernatants were stored at -80° C until use. Plasma specimens were thawed and 100 μL plasma aliquots were transferred into 1.5 mL tubes, 300 μL methanol was added, and the mixture was vortexed for 30 s. All samples were stored at -40° C for 1 h. Samples were then vortexed for 30 s and centrifuged at 13,000 ×g at 4° C for 15 min. The supernatant (200 μL) and 5 μL of 140 μg/mL DL-o-chlorophenylalanine (Merck, Darmstadt, Germany) were transferred to a vial as an internal standard for LC-MS analysis.
LC-TOF-MS
Separation was performed using an Ultimate 3000 LC combined with Q Exactive MS (Thermo Fisher Scientific, Waltham, MA, USA) and screened with ESI-MS. The LC system comprised an ACQUITY UPLC HSS T3 (100 × 2.1 mm; 1.8 μm) with an Ultimate 3000 LC. The mobile phase was composed of solvent A (0.05% formic acid-water) and solvent B (acetonitrile) with a gradient elution (1-16 min, 95–5% A; 16-18 min, 5% A; 18-19 min, 5–95% A; 19-20 min, 95–95% A). The flow rate of the mobile phase was 0.3 mL/min. The column temperature was maintained at 40° C, and the sample manager temperature was set at 4° C. Mass spectrometry parameters in ESI+ and ESI- mode are listed as follows: ESI+: Heater Temp 300° C; Sheath Gas Flow rate, 45 arb; Aux Gas Flow Rate, 15 arb; Sweep Gas Flow Rate, 1 arb; spray voltage, 3.0 kV; capillary temperature, 350° C; S-Lens RF level, 30%. ESI-: Heater Temp 300° C, Sheath Gas Flow rate, 45 arb; Aux Gas Flow Rate, 15 arb; Sweep Gas Flow Rate, 1 arb; spray voltage, 3.2 kV; capillary temperature, 350° C; S-Lens RF level, 60%. Each sample was analyzed in triplicate.
Statistical analysis
In the metabolomic analysis, the raw data were acquired and aligned using the Compound Discover 3.0 (Thermo Fisher Scientific) based on the m/z value and retention time of the ion signals. Ions from both ESI- and ESI+ were merged and imported into the SIMCA-P (version 14.1, Umetrics, Umea, Sweden) for multivariate analysis. PCA was first used as an unsupervised method for data visualization and outlier identification. Supervised regression modeling was then performed on the data set using PLS-DA or OPLS-DA to identify potential biomarkers. The significantly different metabolites (ions) between the two groups were filtered out based on VIP values (VIP > 1.5). Univariate analysis, including FC analysis and t-tests, were performed on a volcano plot. The biomarkers were filtered and confirmed by combining the results of the VIP values (VIP > 1.5), FC values (FC > 2.0), and t-test (P < 0.05).
The data are presented as means ± S.D. values for gene expression analysis. The significance of differences in the mean was determined using a t-test. The threshold of statistical significance was set at P < 0.05.
Compound identification
The chemical structures of important metabolites were identified using online databases, such as the Human Metabolome Database (http://hmdb.ca), Metlin (http://metlin.scripps.edu), and the Mass Bank (http://www.massbank.jp), using the data of accurate masses and MS/MS fragments. When necessary, further confirmation was acquired through comparisons with authentic standards, including retention times and MS/MS fragmentation patterns.
Cluster analysis
Mean values of metabolite contents from biological replicates of the MTKO and WT groups were used to calculate the metabolite ratio. After log transformation of the data, the median centered ratios were normalized. Hierarchical clustering analysis (HCA) was performed using the complete linkage algorithm of the program Cluster 3.0 (Stanford University). Metabolite ratios from two independent experiments for every significant metabolite were used for HCA.
Correlation-based network analysis of metabolites
To investigate the latent relationships of the metabolites, we constructed a correlation network diagram based on KEGG database and MBRole. All significant metabolites were imported to obtain categorical annotations, including pathways, enzyme interactions, and other biological annotations.
RNA isolation and mRNA expression analysis
Frozen organ lysates were prepared using RNAiso Plus reagent (Takara Bio, Ohtsu, Japan). After the organs were lysed, chloroform (1/5 of the volume of RNAiso Plus reagent) was added to the samples. The samples were centrifuged (11,000 × g) at 4° C for 15 min, and the supernatants were collected, to which one volume of RNA-free water and 0.7 volume of ethanol were added. The lysates were then added to the Nucleospin RNA Kit (Takara Bio) columns, and total RNA was purified according to the manufacturer’s instructions. For reverse transcription, 2 μg of RNA from each sample was reverse-transcribed using a High-Capacity cDNA RT Kit (Life Technologies, Carlsbad, CA, USA) according to the manufacturer’s instructions. The cDNA samples were then subjected to real-time PCR using TB Green Premix Ex Taq II (Takara Bio) in a StepOnePlus Real-Time PCR system (Thermo Fisher Scientific). The selected primer sequences are listed in Supplementary Table 1. The PCR program was performed as follows: holding stage at 95° C for 20 s, followed by 40 cycles at 95° C for 3 s and 60° C for 30 s. Each sample was analyzed in triplicate. To verify specificity, melting curve analysis and agarose gel electrophoresis were performed on the real-time RT-PCR products. The standard curve method was used to calculate the PCR product level by plotting the quantification cycle values of a serial dilution of all cDNA sample mixtures on the y-axis against the logarithm of the standard sample concentrations on the x-axis. The relative amount of β-actin (Actb) mRNA as an internal control housekeeping gene was determined to compensate for variations in RT-PCR efficiency.
Author Contributions
Conceptualization, Y.K.; Validation, Y.K. and A.Y.; Formal Analysis, Y.K. and A.Y.; Investigation, Y.K., A.Y., and T.K.; Resources, Y.K., T.K., and S.S.; Data Curation, Y.K. and A.Y.; Writing – Original Draft Preparation, Y.K.; Writing – Review and Editing, T.K., M.S., and S.S.; Visualization, Y.K. and A.Y.; Supervision, M.S.; Project Administration, Y.K. and S.S.; Funding Acquisition, Y.K. and S.S.
Acknowledgments
We would like to thank Editage (http://www.editage.com) for English language editing.
Conflicts of Interest
The authors declare that they have no conflicts of interest.
Funding
This work was supported by JSPS KAKENHI (Grant Number JP19K11732).
References
- 1. Mahishale V. Ageing world: Health care challenges. J Sci Soc. 2015; 42:138. https://doi.org/10.4103/0974-5009.165540
- 2. Weinert BT, Timiras PS. Invited review: Theories of aging. J Appl Physiol (1985). 2003; 95:1706–16. https://doi.org/10.1152/japplphysiol.00288.2003 [PubMed]
- 3. López-Otín C, Blasco MA, Partridge L, Serrano M, Kroemer G. The hallmarks of aging. Cell. 2013; 153:1194–217. https://doi.org/10.1016/j.cell.2013.05.039 [PubMed]
- 4. Srivastava S. Emerging Insights into the Metabolic Alterations in Aging Using Metabolomics. Metabolites. 2019; 9:301. https://doi.org/10.3390/metabo9120301 [PubMed]
- 5. Kondoh H, Kameda M, Yanagida M. Whole Blood Metabolomics in Aging Research. Int J Mol Sci. 2020; 22:175. https://doi.org/10.3390/ijms22010175 [PubMed]
- 6. Sato M, Bremner I. Oxygen free radicals and metallothionein. Free Radic Biol Med. 1993; 14:325–37. https://doi.org/10.1016/0891-5849(93)90029-t [PubMed]
- 7. Babula P, Masarik M, Adam V, Eckschlager T, Stiborova M, Trnkova L, Skutkova H, Provaznik I, Hubalek J, Kizek R. Mammalian metallothioneins: properties and functions. Metallomics. 2012; 4:739–50. https://doi.org/10.1039/c2mt20081c [PubMed]
- 8. Swindell WR. Metallothionein and the biology of aging. Ageing Res Rev. 2011; 10:132–45. https://doi.org/10.1016/j.arr.2010.09.007 [PubMed]
- 9. Sato M, Ishibashi S, Higashimoto M, Kadota Y, Kawakami T, Suzuki S. Early changes induced by environmental stresses in insulin sensitivity-related genes. Eur J Pharmacol. 2011; 668:472–76. https://doi.org/10.1016/j.ejphar.2011.07.034 [PubMed]
- 10. Kawakami T, Nishiyama K, Kadota Y, Sato M, Inoue M, Suzuki S. Cadmium modulates adipocyte functions in metallothionein-null mice. Toxicol Appl Pharmacol. 2013; 272:625–36. https://doi.org/10.1016/j.taap.2013.07.015 [PubMed]
- 11. Mocchegiani E, Costarelli L, Basso A, Giacconi R, Piacenza F, Malavolta M. Metallothioneins, ageing and cellular senescence: a future therapeutic target. Curr Pharm Des. 2013; 19:1753–64. https://doi.org/10.2174/138161213805219595 [PubMed]
- 12. Yang X, Doser TA, Fang CX, Nunn JM, Janardhanan R, Zhu M, Sreejayan N, Quinn MT, Ren J. Metallothionein prolongs survival and antagonizes senescence-associated cardiomyocyte diastolic dysfunction: role of oxidative stress. FASEB J. 2006; 20:1024–26. https://doi.org/10.1096/fj.05-5288fje [PubMed]
- 13. Malavolta M, Basso A, Piacenza F, Giacconi R, Costarelli L, Pierpaoli S, Mocchegiani E. Survival study of metallothionein-1 transgenic mice and respective controls (C57BL/6J): influence of a zinc-enriched environment. Rejuvenation Res. 2012; 15:140–43. https://doi.org/10.1089/rej.2011.1261 [PubMed]
- 14. Giacconi R, Cipriano C, Muti E, Costarelli L, Maurizio C, Saba V, Gasparini N, Malavolta M, Mocchegiani E. Novel -209A/G MT2A polymorphism in old patients with type 2 diabetes and atherosclerosis: relationship with inflammation (IL-6) and zinc. Biogerontology. 2005; 6:407–13. https://doi.org/10.1007/s10522-005-4907-y [PubMed]
- 15. Cipriano C, Malavolta M, Costarelli L, Giacconi R, Muti E, Gasparini N, Cardelli M, Monti D, Mariani E, Mocchegiani E. Polymorphisms in MT1a gene coding region are associated with longevity in Italian Central female population. Biogerontology. 2006; 7:357–65. https://doi.org/10.1007/s10522-006-9050-x [PubMed]
- 16. Kayaaltı Z, Sahiner L, Durakoğlugil ME, Söylemezoğlu T. Distributions of interleukin-6 (IL-6) promoter and metallothionein 2A (MT2A) core promoter region gene polymorphisms and their associations with aging in Turkish population. Arch Gerontol Geriatr. 2011; 53:354–58. https://doi.org/10.1016/j.archger.2011.01.001 [PubMed]
- 17. Raudenska M, Gumulec J, Podlaha O, Sztalmachova M, Babula P, Eckschlager T, Adam V, Kizek R, Masarik M. Metallothionein polymorphisms in pathological processes. Metallomics. 2014; 6:55–68. https://doi.org/10.1039/c3mt00132f [PubMed]
- 18. Masters BA, Kelly EJ, Quaife CJ, Brinster RL, Palmiter RD. Targeted disruption of metallothionein I and II genes increases sensitivity to cadmium. Proc Natl Acad Sci USA. 1994; 91:584–88. https://doi.org/10.1073/pnas.91.2.584 [PubMed]
- 19. Liu J, Liu Y, Habeebu SS, Klaassen CD. Metallothionein (MT)-null mice are sensitive to cisplatin-induced hepatotoxicity. Toxicol Appl Pharmacol. 1998; 149:24–31. https://doi.org/10.1006/taap.1997.8325 [PubMed]
- 20. Kadota Y, Aki Y, Toriuchi Y, Mizuno Y, Kawakami T, Sato M, Suzuki S. Deficiency of metallothionein-1 and -2 genes shortens the lifespan of the 129/Sv mouse strain. Exp Gerontol. 2015; 66:21–24. https://doi.org/10.1016/j.exger.2015.04.007 [PubMed]
- 21. Palla AR, Ravichandran M, Wang YX, Alexandrova L, Yang AV, Kraft P, Holbrook CA, Schürch CM, Ho AT, Blau HM. Inhibition of prostaglandin-degrading enzyme 15-PGDH rejuvenates aged muscle mass and strength. Science. 2021; 371:eabc8059. https://doi.org/10.1126/science.abc8059 [PubMed]
- 22. Jansen RS, Addie R, Merkx R, Fish A, Mahakena S, Bleijerveld OB, Altelaar M, IJlst L, Wanders RJ, Borst P, van de Wetering K. N-lactoyl-amino acids are ubiquitous metabolites that originate from CNDP2-mediated reverse proteolysis of lactate and amino acids. Proc Natl Acad Sci USA. 2015; 112:6601–606. https://doi.org/10.1073/pnas.1424638112 [PubMed]
- 23. Pettersen JE, Aas M. Subcellular localization of hexadecanedioic acid activation in human liver. J Lipid Res. 1974; 15:551–56. https://doi.org/10.1016/S0022-2275(20)36755-9 [PubMed]
- 24. Bortolotti M, Polito L, Battelli MG, Bolognesi A. Xanthine oxidoreductase: One enzyme for multiple physiological tasks. Redox Biol. 2021; 41:101882. https://doi.org/10.1016/j.redox.2021.101882 [PubMed]
- 25. Battelli MG, Bortolotti M, Bolognesi A, Polito L. Pro-Aging Effects of Xanthine Oxidoreductase Products. Antioxidants (Basel). 2020; 9:839. https://doi.org/10.3390/antiox9090839 [PubMed]
- 26. Gu J, Cheng Y, Wu H, Kong L, Wang S, Xu Z, Zhang Z, Tan Y, Keller BB, Zhou H, Wang Y, Xu Z, Cai L. Metallothionein Is Downstream of Nrf2 and Partially Mediates Sulforaphane Prevention of Diabetic Cardiomyopathy. Diabetes. 2017; 66:529–42. https://doi.org/10.2337/db15-1274 [PubMed]
- 27. Liu J, Liu Y, Hartley D, Klaassen CD, Shehin-Johnson SE, Lucas A, Cohen SD. Metallothionein-I/II knockout mice are sensitive to acetaminophen-induced hepatotoxicity. J Pharmacol Exp Ther. 1999; 289:580–86. https://doi.org/10.1007/978-3-0348-8847-9_81 [PubMed]
- 28. Ebadi M, Sharma S. Metallothioneins 1 and 2 attenuate peroxynitrite-induced oxidative stress in Parkinson disease. Exp Biol Med (Maywood). 2006; 231:1576–83. https://doi.org/10.1177/153537020623100919 [PubMed]
- 29. Davalli P, Mitic T, Caporali A, Lauriola A, D’Arca D. ROS, Cell Senescence, and Novel Molecular Mechanisms in Aging and Age-Related Diseases. Oxid Med Cell Longev. 2016; 2016:3565127. https://doi.org/10.1155/2016/3565127 [PubMed]
- 30. Lindeque JZ, Levanets O, Louw R, van der Westhuizen FH. The involvement of metallothioneins in mitochondrial function and disease. Curr Protein Pept Sci. 2010; 11:292–309. https://doi.org/10.2174/138920310791233378 [PubMed]
- 31. Stanley CA, Hale DE, Berry GT, Deleeuw S, Boxer J, Bonnefont JP. Brief report: a deficiency of carnitine-acylcarnitine translocase in the inner mitochondrial membrane. N Engl J Med. 1992; 327:19–23. https://doi.org/10.1056/NEJM199207023270104 [PubMed]
- 32. Korman SH, Waterham HR, Gutman A, Jakobs C, Wanders RJ. Novel metabolic and molecular findings in hepatic carnitine palmitoyltransferase I deficiency. Mol Genet Metab. 2005; 86:337–43. https://doi.org/10.1016/j.ymgme.2005.07.022 [PubMed]
- 33. Okajima K, Asai K, Niwa T, Ohki S, Sobajima H, Tyson J, Malcolm S, Wada Y. Clinical and biochemical findings of a patient with thanatophoric dysplasia type I: additional finding of dicarboxylic aciduria. Cleft Palate Craniofac J. 2002; 39:246–48. https://doi.org/10.1597/1545-1569_2002_039_0246_cabfoa_2.0.co_2 [PubMed]
- 34. Stanley CA, Hale DE, Coates PM, Hall CL, Corkey BE, Yang W, Kelley RI, Gonzales EL, Williamson JR, Baker L. Medium-chain acyl-CoA dehydrogenase deficiency in children with non-ketotic hypoglycemia and low carnitine levels. Pediatr Res. 1983; 17:877–84. https://doi.org/10.1203/00006450-198311000-00008 [PubMed]
- 35. Chickos JS, Way BA, Wilson J, Shaharuzzaman M, Laird J, Landt M. Analysis of 3-hydroxydodecanedioic acid for studies of fatty acid metabolic disorders: preparation of stable isotope standards. J Clin Lab Anal. 2002; 16:115–20. https://doi.org/10.1002/jcla.10033 [PubMed]
- 36. Ripps H, Shen W. Review: taurine: a “very essential” amino acid. Mol Vis. 2012; 18:2673–86. [PubMed]
- 37. Lambert IH, Kristensen DM, Holm JB, Mortensen OH. Physiological role of taurine--from organism to organelle. Acta Physiol (Oxf). 2015; 213:191–212. https://doi.org/10.1111/apha.12365 [PubMed]
- 38. Wu G. Important roles of dietary taurine, creatine, carnosine, anserine and 4-hydroxyproline in human nutrition and health. Amino Acids. 2020; 52:329–60. https://doi.org/10.1007/s00726-020-02823-6 [PubMed]
- 39. Bkaily G, Jazzar A, Normand A, Simon Y, Al-Khoury J, Jacques D. Taurine and cardiac disease: state of the art and perspectives. Can J Physiol Pharmacol. 2020; 98:67–73. https://doi.org/10.1139/cjpp-2019-0313 [PubMed]
- 40. Wen C, Li F, Zhang L, Duan Y, Guo Q, Wang W, He S, Li J, Yin Y. Taurine is Involved in Energy Metabolism in Muscles, Adipose Tissue, and the Liver. Mol Nutr Food Res. 2019; 63:e1800536. https://doi.org/10.1002/mnfr.201800536 [PubMed]
- 41. Thirupathi A, Pinho RA, Baker JS, István B, Gu Y. Taurine Reverses Oxidative Damages and Restores the Muscle Function in Overuse of Exercised Muscle. Front Physiol. 2020; 11:582449. https://doi.org/10.3389/fphys.2020.582449 [PubMed]
- 42. Castelli V, Paladini A, d’Angelo M, Allegretti M, Mantelli F, Brandolini L, Cocchiaro P, Cimini A, Varrassi G. Taurine and oxidative stress in retinal health and disease. CNS Neurosci Ther. 2021; 27:403–12. https://doi.org/10.1111/cns.13610 [PubMed]
- 43. El Idrissi A. Taurine Regulation of Neuroendocrine Function. Adv Exp Med Biol. 2019; 1155:977–85. https://doi.org/10.1007/978-981-13-8023-5_81 [PubMed]
- 44. Schaffer S, Kim HW. Effects and Mechanisms of Taurine as a Therapeutic Agent. Biomol Ther (Seoul). 2018; 26:225–41. https://doi.org/10.4062/biomolther.2017.251 [PubMed]
- 45. Ito T, Yoshikawa N, Inui T, Miyazaki N, Schaffer SW, Azuma J. Tissue depletion of taurine accelerates skeletal muscle senescence and leads to early death in mice. PLoS One. 2014; 9:e107409. https://doi.org/10.1371/journal.pone.0107409 [PubMed]
- 46. Park E, Park SY, Dobkin C, Schuller-Levis G. Development of a novel cysteine sulfinic Acid decarboxylase knockout mouse: dietary taurine reduces neonatal mortality. J Amino Acids. 2014; 2014:346809. https://doi.org/10.1155/2014/346809 [PubMed]
- 47. Huxtable RJ, Lippincott SE. Diet and biosynthesis as sources of taurine in the mouse. J Nutr. 1982; 112:1003–10. https://doi.org/10.1093/jn/112.5.1003 [PubMed]
- 48. Kreider RB, Stout JR. Creatine in Health and Disease. Nutrients. 2021; 13:447. https://doi.org/10.3390/nu13020447 [PubMed]
- 49. Shedlovsky A, McDonald JD, Symula D, Dove WF. Mouse models of human phenylketonuria. Genetics. 1993; 134:1205–10. https://doi.org/10.1093/genetics/134.4.1205 [PubMed]
- 50. Strijbis K, Vaz FM, Distel B. Enzymology of the carnitine biosynthesis pathway. IUBMB Life. 2010; 62:357–62. https://doi.org/10.1002/iub.323 [PubMed]
- 51. Adeva-Andany MM, Calvo-Castro I, Fernández-Fernández C, Donapetry-García C, Pedre-Piñeiro AM. Significance of l-carnitine for human health. IUBMB Life. 2017; 69:578–94. https://doi.org/10.1002/iub.1646 [PubMed]
- 52. Rebouche CJ, Engel AG. Tissue distribution of carnitine biosynthetic enzymes in man. Biochim Biophys Acta. 1980; 630:22–29. https://doi.org/10.1016/0304-4165(80)90133-6 [PubMed]
- 53. Stein R, Englard S. Properties of rat 6-N-trimethyl-L-lysine hydroxylases: similarities among the kidney, liver, heart, and skeletal muscle activities. Arch Biochem Biophys. 1982; 217:324–31. https://doi.org/10.1016/0003-9861(82)90508-2 [PubMed]
- 54. Bjørndal B, Brattelid T, Strand E, Vigerust NF, Svingen GF, Svardal A, Nygård O, Berge RK. Fish oil and the pan-PPAR agonist tetradecylthioacetic acid affect the amino acid and carnitine metabolism in rats. PLoS One. 2013; 8:e66926. https://doi.org/10.1371/journal.pone.0066926 [PubMed]
- 55. Koepsell H. Organic Cation Transporters in Health and Disease. Pharmacol Rev. 2020; 72:253–319. https://doi.org/10.1124/pr.118.015578 [PubMed]
- 56. Yoshida M, Ohta H, Yamauchi Y, Seki Y, Sagi M, Yamazaki K, Sumi Y. Age-dependent changes in metallothionein levels in liver and kidney of the Japanese. Biol Trace Elem Res. 1998; 63:167–75. https://doi.org/10.1007/BF02778875 [PubMed]
- 57. Malavolta M, Cipriano C, Costarelli L, Giacconi R, Tesei S, Muti E, Piacenza F, Pierpaoli S, Larbi A, Pawelec G, Dedoussis G, Herbein G, Monti D, et al. Metallothionein downregulation in very old age: a phenomenon associated with cellular senescence? Rejuvenation Res. 2008; 11:455–59. https://doi.org/10.1089/rej.2008.0679 [PubMed]
- 58. Cong W, Niu C, Lv L, Ni M, Ruan D, Chi L, Wang Y, Yu Q, Zhan K, Xuan Y, Wang Y, Tan Y, Wei T, et al. Metallothionein Prevents Age-Associated Cardiomyopathy via Inhibiting NF-κB Pathway Activation and Associated Nitrative Damage to 2-OGD. Antioxid Redox Signal. 2016; 25:936–52. https://doi.org/10.1089/ars.2016.6648 [PubMed]
- 59. Leierer J, Rudnicki M, Braniff SJ, Perco P, Koppelstaetter C, Mühlberger I, Eder S, Kerschbaum J, Schwarzer C, Schroll A, Weiss G, Schneeberger S, Wagner S, et al. Metallothioneins and renal ageing. Nephrol Dial Transplant. 2016; 31:1444–52. https://doi.org/10.1093/ndt/gfv451 [PubMed]
- 60. Malavolta M, Costarelli L, Giacconi R, Basso A, Piacenza F, Pierpaoli E, Provinciali M, Ogo OA, Ford D. Changes in Zn homeostasis during long term culture of primary endothelial cells and effects of Zn on endothelial cell senescence. Exp Gerontol. 2017; 99:35–45. https://doi.org/10.1016/j.exger.2017.09.006 [PubMed]
- 61. Giacconi R, Costarelli L, Piacenza F, Basso A, Bürkle A, Moreno-Villanueva M, Grune T, Weber D, Stuetz W, Gonos ES, Schön C, Grubeck-Loebenstein B, Sikora E, et al. Zinc-Induced Metallothionein in Centenarian Offspring From a Large European Population: The MARK-AGE Project. J Gerontol A Biol Sci Med Sci. 2018; 73:745–53. https://doi.org/10.1093/gerona/glx192 [PubMed]
- 62. Longo N, Frigeni M, Pasquali M. Carnitine transport and fatty acid oxidation. Biochim Biophys Acta. 2016; 1863:2422–35. https://doi.org/10.1016/j.bbamcr.2016.01.023 [PubMed]
- 63. Webb M, Sideris DP. Intimate Relations-Mitochondria and Ageing. Int J Mol Sci. 2020; 21:7580. https://doi.org/10.3390/ijms21207580 [PubMed]
- 64. Ames BN, Liu J. Delaying the mitochondrial decay of aging with acetylcarnitine. Ann N Y Acad Sci. 2004; 1033:108–16. https://doi.org/10.1196/annals.1320.010 [PubMed]
- 65. Manzo E, O’Conner AG, Barrows JM, Shreiner DD, Birchak GJ, Zarnescu DC. Medium-Chain Fatty Acids, Beta-Hydroxybutyric Acid and Genetic Modulation of the Carnitine Shuttle Are Protective in a Drosophila Model of ALS Based on TDP-43. Front Mol Neurosci. 2018; 11:182. https://doi.org/10.3389/fnmol.2018.00182 [PubMed]
- 66. Sato M, Kawakami T, Kondoh M, Takiguchi M, Kadota Y, Himeno S, Suzuki S. Development of high-fat-diet-induced obesity in female metallothionein-null mice. FASEB J. 2010; 24:2375–84. https://doi.org/10.1096/fj.09-145466 [PubMed]
- 67. Liu D, Zeng X, Li L, Ou ZL. Carnitine promotes recovery from oxidative stress and extends lifespan in C. elegans. Aging (Albany NY). 2020; 13:813–30. https://doi.org/10.18632/aging.202187 [PubMed]
- 68. Higashimoto M, Isoyama N, Ishibashi S, Ogawa N, Takiguchi M, Suzuki S, Ohnishi Y, Sato M. Preventive effects of metallothionein against DNA and lipid metabolic damages in dyslipidemic mice under repeated mild stress. J Med Invest. 2013; 60:240–48. https://doi.org/10.2152/jmi.60.240 [PubMed]
- 69. Cruciani RA, Dvorkin E, Homel P, Culliney B, Malamud S, Shaiova L, Fleishman S, Lapin J, Klein E, Lesage P, Portenoy R, Esteban-Cruciani N. L-carnitine supplementation for the treatment of fatigue and depressed mood in cancer patients with carnitine deficiency: a preliminary analysis. Ann N Y Acad Sci. 2004; 1033:168–76. https://doi.org/10.1196/annals.1320.016 [PubMed]
- 70. Al-Rejaie SS, Aleisa AM, Al-Yahya AA, Bakheet SA, Alsheikh A, Fatani AG, Al-Shabanah OA, Sayed-Ahmed MM. Progression of diethylnitrosamine-induced hepatic carcinogenesis in carnitine-depleted rats. World J Gastroenterol. 2009; 15:1373–80. https://doi.org/10.3748/wjg.15.1373 [PubMed]
- 71. Malavolta M, Orlando F, Piacenza F, Giacconi R, Costarelli L, Basso A, Lucarini G, Pierpaoli E, Provinciali M. Metallothioneins, longevity and cancer: Comment on “Deficiency of metallothionein-1 and -2 genes shortens the lifespan of the 129/Sv mouse strain”. Exp Gerontol. 2016; 73:28–30. https://doi.org/10.1016/j.exger.2015.11.014 [PubMed]
- 72. van Vlies N, Wanders RJ, Vaz FM. Measurement of carnitine biosynthesis enzyme activities by tandem mass spectrometry: differences between the mouse and the rat. Anal Biochem. 2006; 354:132–39. https://doi.org/10.1016/j.ab.2006.04.007 [PubMed]
- 73. Rebouche CJ, Lehman LJ, Olson L. epsilon-N-trimethyllysine availability regulates the rate of carnitine biosynthesis in the growing rat. J Nutr. 1986; 116:751–59. https://doi.org/10.1093/jn/116.5.751 [PubMed]
- 74. Costell M, O’Connor JE, Grisolía S. Age-dependent decrease of carnitine content in muscle of mice and humans. Biochem Biophys Res Commun. 1989; 161:1135–43. https://doi.org/10.1016/0006-291x(89)91360-0 [PubMed]
- 75. Cheema UB, Most E, Eder K, Ringseis R. Effect of lifelong carnitine supplementation on plasma and tissue carnitine status, hepatic lipid metabolism and stress signalling pathways and skeletal muscle transcriptome in mice at advanced age. Br J Nutr. 2019; 121:1323–33. https://doi.org/10.1017/S0007114519000709 [PubMed]
- 76. Edgar AJ. Mice have a transcribed L-threonine aldolase/GLY1 gene, but the human GLY1 gene is a non-processed pseudogene. BMC Genomics. 2005; 6:32. https://doi.org/10.1186/1471-2164-6-32 [PubMed]
- 77. Shaw CF 3rd, Savas MM, Petering DH. Ligand substitution and sulfhydryl reactivity of metallothionein. Methods Enzymol. 1991; 205:401–14. https://doi.org/10.1016/0076-6879(91)05122-c [PubMed]