


Introduction
Parkinson’s disease (PD) is the second most frequent neurodegenerative disease, characterized by the progressive loss of dopaminergic neurons in the substantia nigra par compacta (SNpc) of the midbrain, and increased glial activation and neuroinflammation [1–3]. MicroRNAs are short noncoding RNA molecules that regulate gene expression at the post-transcriptional level [4, 5]. MicroRNAs are involved in the regulation of nervous system development, neuronal plasticity, and neurodegenerative diseases. MicroRNA29 family (miR-29s) are composed of two gene clusters: miR-29a/b1 and miR-29b2/c, which are located on chromosome 6 and chromosome1, respectively, of the mouse genome. miR-29a and miR-29c only have one nucleotide difference, whereas miR-29b1 and miR-29b2 are identical in sequence [6]. miR-29s are involved in multiple biological processes. Many miR-29s target genes have been experimentally verified, including pro-cell survival genes Bcl-2, Mcl-1, Cdc42 and p85-α; pro-apoptotic genes Puma, Bim, Bak and Bmf; and pro-inflammatory cytokines IFN-γ and IL-12β. In the peripheral system, studies have shown that miR-29s are involved in tissue fibrosis [7–9], metabolism and immune regulation [10–13].
miR-29s express widely in the central nervous system, and their transcripts exist both in neurons and glial cells [14, 15]. The association between miR-29s and neurological diseases has been increasingly illustrated. miR-29s are involved in the regulation of β-amyloid production, and they are down-regulated in the brain of AD patients [16, 17]; miR-29s levels also decrease in Huntington’s disease (HD) patients and HD model mice [18, 19], whereas they increase in patients with amyotrophic lateral sclerosis (ALS) and ALS mouse models [16, 20]. Both miR-29a/b-1-deficient mice and miR-29s down-regulated mice display an Ataxia-like phenotype [6, 21]. Regarding the effects of miR-29s expression on neuroprotection and the promotion of neuronal death in ischemic rodent models opposing results were reported [22, 23]. In previous studies, we observed that miR-29s levels were markedly decreased in the serum of PD patients with a decreasing trend related to more severe Parkinsonism [24]. Further, the miR-29s levels correlated with memory performance in PD patients [25]. We concluded that miR-29b2/c is linked closely to PD, but its physiological functions and pathological mechanisms involved in PD are largely unknown.
In this study, mouse serum levels of miR-29s in response to MPTP administration were measured up to 120 days post-injection. The effects of miR-29b2/c deficiencies on the peripheral tissues were studied utilizing miR-29b2/c KO mice. The dopaminergic neurotoxin MPTP was further used to induce mouse model of PD. Injuries of the nigrostriatal dopaminergic system, behavioral performance and potential mechanisms were then investigated. We observed that the miR-29s levels in the mouse serum displayed dynamic changes after MPTP administration. miR-29b2/c KO mice displayed accelerated aging, indicated by the lighter body weight, adipose tissue reduction, kyphosis, skin thickening, muscle weakness, and the gait abnormality. However, deficiency of miR-29b2/c led to the alleviated dopaminergic damage and glial activation, and consequently to the improved behavioral performance in a PD-like animal model.
Results
The progeria-like phenotype in miR-29b2/c KO mice
miR-29b2/c knockout mice (miR-29b2/c KO) were generated using the CRISPR-Cas9 technique. The strategy of gene targeting and mutant mouse genotyping were presented in Supplementary Figure 1. Four- and 16-month-old miR-29b2/c KO mice had decreased body weights (Figure 1A). At three months of age, the features of miR-29b2/c KO mice remained unaltered, as proven by X-ray micro-computed tomography (microCT) scan (Supplementary Figure 2A). There were no differences in bone mineral density (BMD), trabeculae mean BMD, trabecular separation, trabecular thickness and structural model index (SMI) between miR-29b2/c KO mice and their WT counterpart at 13 months old (Supplementary Figure 2B). By hematoxylin and eosin (H&E) staining, we found 13-month-old miR-29b2/c KO mice displayed thickened dermis with increased and deepened wrinkles (Figure 1B, 1C). And kyphosis was apparent in 16-month-old miR-29b2/c KO mice (Figure 1C). miR-29b2/c KO mice at a young age (3 months old) had normal adipose tissues (Supplementary Figure 2C, 2D). However, abdominal adipose tissue (subcutaneous fat and visceral fat combined) and brown adipose tissue were dramatically reduced in miR-29b2/c KO mice compared to WT mice at the age of 16 months (Figure 1D). Further, the transcriptional levels of senescence markers p21 and p53 in the brain were analyzed. They increased markedly in the hippocampus, but not in the cortex of miR-29b2/c KO mice at the age of six months. p53 and p16 protein levels in the miR-29b2/c-deficient hippocampus did not differ from the WT controls (Supplementary Figure 3). In addition, β-galactosidase activity, a known characteristic of cellular senescence, did not differ between the brains of three-month-old WT and miR-29b2/c KO mice (Supplementary Figure 4).
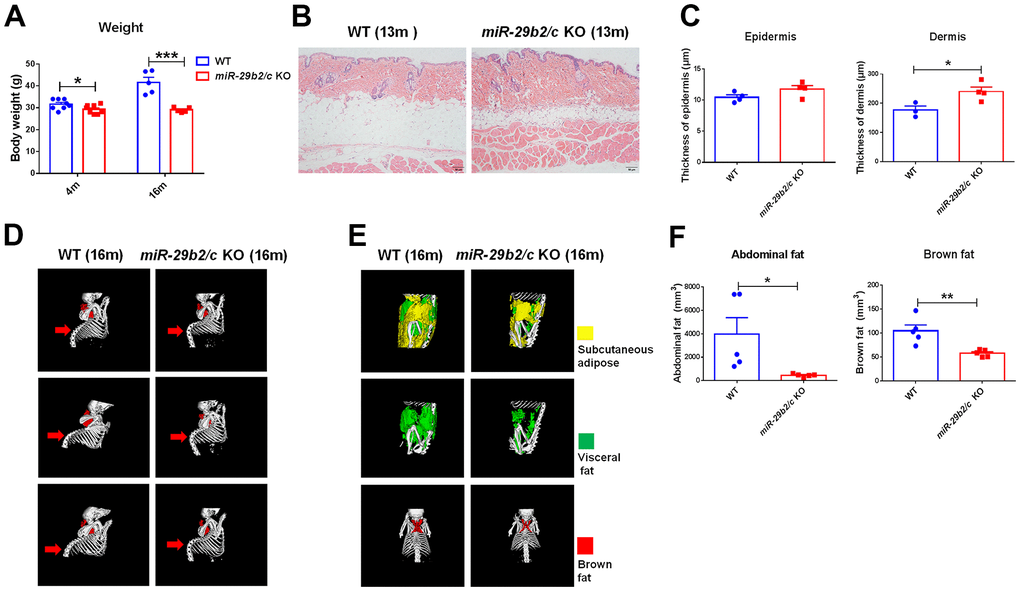
Figure 1. The body weights and the peripheral characteristics of miR-29b2/c KO mice. (A) The body weights of WT and miR-29b2/c KO mice at 4 and 16 months old. n=5-8. Differences were analyzed by Student-T-test. *p < 0.05 and ***p < 0.001. (B) H&E staining of the back skin of WT and miR-29b2/c KO mice at 13 months old. (C) The epidermis and dermis thickness of WT and miR-29b2/c KO mice at 13 months old. n=3-4. (D) microCT scan of bone of WT and miR-29b2/c KO mice at 16 months old. (E) microCT scan of abdominal fat (subcutaneous fat and visceral fat together) and brown fat of WT and miR-29b2/c KO mice at 16 months old. (F) The content and ratio analysis of abdominal and brown fat of WT and miR-29b2/c KO mice at 16 months old are shown. n=5. The differences were analyzed by Student-T-test. *p < 0.05, **p < 0.01.
Muscle weakness and gait abnormality in miR-29b2/c KO mice
The behaviors of miR-29b2/c-deficient mice were assessed. Muscle strength were measured by the Wire hanging and the Grid hanging tests. The miR-29b2/c KO mice scored lower than the control mice in the Wire hanging test (Figure 2A). And the latency to fall was dramatically shorter in miR-29b2/c KO mice when compared with wild-type counterparts in the Grid hanging test (Figure 2B), but the Rotarod test performance of WT and miR-29b2/c KO mice did not differ significantly (Figure 2C). Animal gait was detected by Catwalk XT analysis system. Surprisingly, both speed and stride length of miR-29b2/c KO mice were higher than those of their counterparts, whereas the step cycle, stand and swing time were shorter, and the duty cycle reduced, in miR-29 b2/c-deficient mice (Figure 2D).
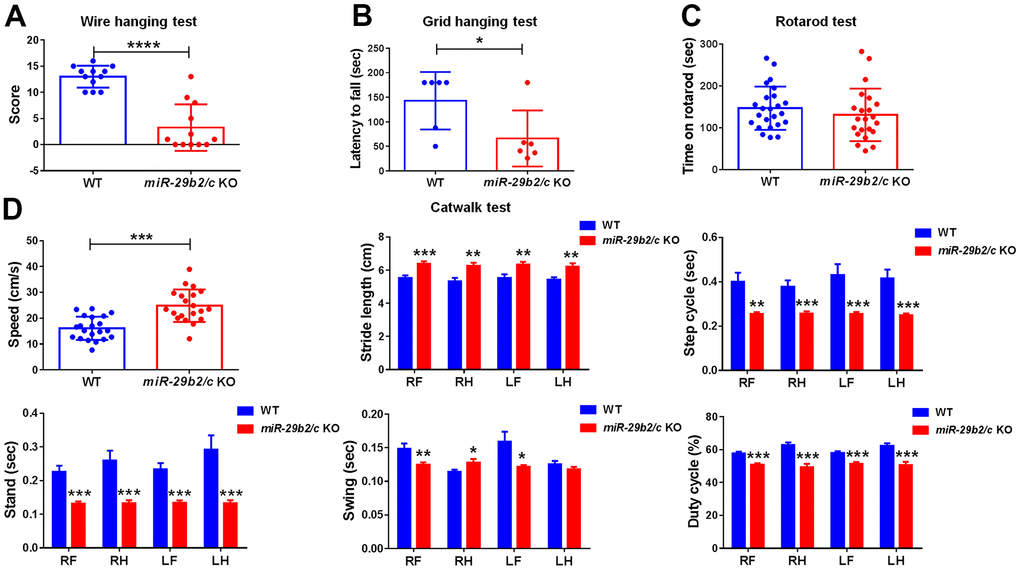
Figure 2. The muscle weakness and gait abnormality in miR-29b2/c KO mice. (A) The results of the Wire hanging test in WT and miR-29b2/c KO mice. n=12-14. (B) The results of Grid hanging test in WT and miR-29b2/c KO mice. n=6-13. (C) The results of Rotarod test in WT and miR-29b2/c KO mice. n=12-24. (D) The results of Catwalk test in WT and miR-29b2/c KO mice. n=12-21. The differences were analyzed by Student-T-test. *P < 0.05, **P < 0.01, ***P < 0.001 and ****P < 0.0001.
Changes of miR-29s in the MPTP-induced PD mouse serum
miR-29s levels decreased in the serum of patients with PD compared to healthy controls [24]. In this study, miR-29s levels in the serum of PD mice were quantified at 3, 30 and 120 days after administration of a subacute regimen of MPTP. miR-29a and miR-29b levels decreased at 3 days after injection and recovered to baseline values at 30 days, and decreased again at 120 days. However, miR-29c level did not change significantly (Supplementary Figure 5).
miR-29b2/c deficiency mitigates MPTP-induced nigrostriatal injuries and motor deficits in mice
miR-29b2/c knockout mice and the WT littermates were injected with MPTP to induce PD model. The expression levels of p21, p53 and Pai1 in the striatum of both miR-29b2/c KO mice and WT controls did not change after MPTP administration (Supplementary Figure 6). MPTP exposure caused significant reductions of the TH-positive dopaminergic neurons in the SNpc [F(1, 20) = 5.441, P=0.0302], and the TH-positive nerve terminals, TH proteins [F(1, 20) = 10.5, P=0.0041] and the levels of dopamine, DOPAC and HVA in the striatum (Figure 3A–3D). However, the nigrostriatal injuries in MPTP-treated miR-29b2/c KO mice were dramatically alleviated when compared with MPTP-treated WT controls as the numbers of dopaminergic neurons, the densities of dopaminergic nerve terminals, and the striatal TH protein levels and dopamine concentration were significantly higher; In addition, changes in the ratios of DOPAC to DA and HVA to DA [F(1, 19) = 12.64, P=0.0021] were markedly mitigated (Figure 3A–3D). In normal saline-injected miR-29b2/c KO mice, the striatal concentrations of 5-HT and its metabolite 5-HIAA increased compared to their WT counterparts, and NE concentrations were close between the wild-type and miR-29b2/c KO mice (Figure 3D). The Rearing and the Pole tests were used to evaluate spontaneous vertical activity [26, 27] and locomotor activity of mice [28], respectively. Two days after the last MPTP injection, rearing frequency decreased in WT mice during the last 2 min when compared with normal saline-treated WT controls. Similar experiments did not reveal an effect of miR-29b2/c deficiency on MPTP-induced changes of rearing frequency (Figure 3E). Similarly, the total time spent on turning and climbing down increased in WT mice after MPTP administration in the Pole test, whereas the total time was close between normal saline- and MPTP-treated miR-29b2/c KO mice (Figure 3F).
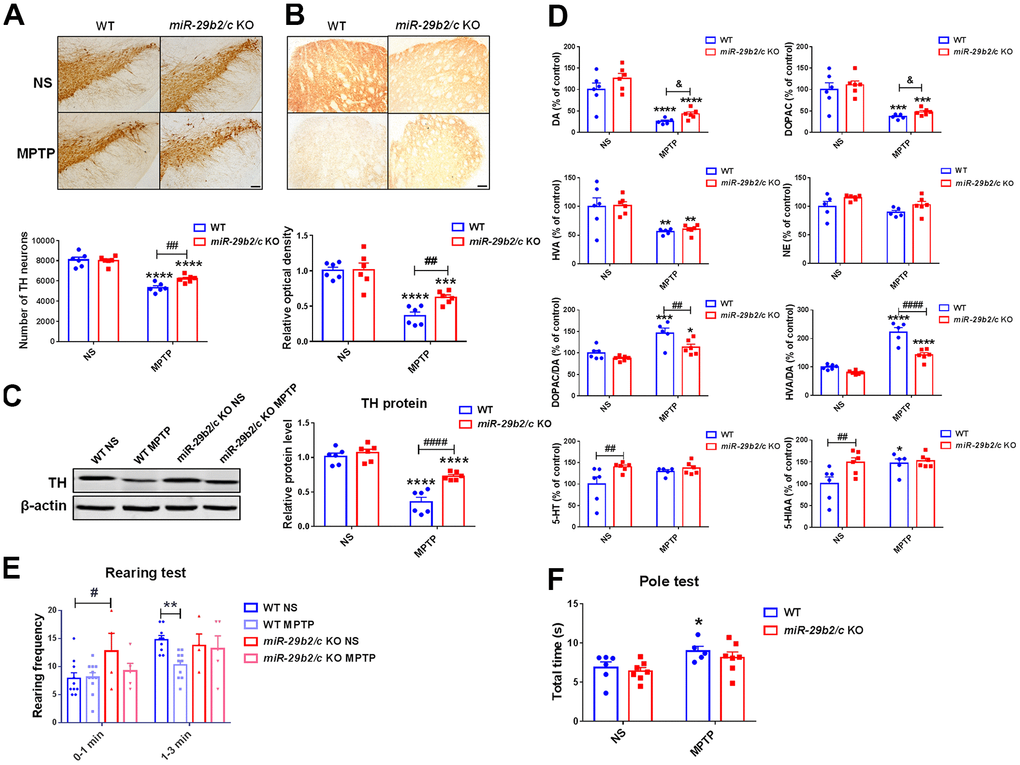
Figure 3. The analysis of the nigrostriatal pathway and behavioral performance of WT and miR-29b2/c KO mice at 3 days after MPTP administration. (A) Immunohistochemical staining of TH in the SNpc of WT and miR-29b2/c KO mice. Scale bar: 0.1mm. Stereological counting of TH positive dopaminergic neurons is shown in the lower panel. n=5-6. (B) Immunohistochemical staining showing striatal TH positive nerve fibers of WT and miR-29b2/c KO mice. Scale bar: 0.05mm. Densitometric analysis of the relative optical density of the staining is shown in the lower panel. n=6. (C) Western blot showing TH protein levels in the striatum of WT and miR-29b2/c KO mice. β-actin served as a loading control. The quantification of the relative TH protein levels is shown in the right panel. n=6. (D) Levels of striatal dopamine (DA), 5-HT, their metabolites, and norepinephrine (NE) in WT and miR-29b2/c KO mice. n=5-6. (E) The rearing frequency of WT and miR-29b2/c KO mice between 0-1min and 1-3min in the Rearing test. n=4-11. (F) The total time of WT and miR-29b2/c KO mice in the Pole test. n=5-7. The differences were analyzed by two-way ANOVA followed by LSD multiple comparison tests. *p<0.05, **p < 0.01, ***p<0.001 and ****p<0.0001, vs normal saline control. # p < 0.05, ## p < 0.01 and ####p<0.0001, vs WT group. & p < 0.05, by Student-T-test.
miR-29b2/c deficiency attenuates MPTP-induced glial activation in mice
Glial cell activation and glial cell-mediated neuroinflammation are involved in PD pathology [29]. Astrocytes increased markedly in the nigrostriatal pathway of WT mice, whereas GFAP+ astrocytes increased in the striatum but not in the SNpc [F(1, 8) = 5.412, P=0.0484] of miR-29b2/c KO mice three days after MPTP injection. Notably, astrocytic densities did not differ in the two regions of WT and miR-29b2/c KO mice treated with MPTP (Figure 4A, 4B). Iba 1+ microglia increased in the substantia nigra of WT mice, and in the striatum [F(1, 8) = 12.74, P=0.0073] of both WT and miR-29b2/c KO mice after MPTP administration. Moreover, in miR-29b2/c KO mice MPTP-injection reduced microglial densities significantly (Figure 4C, 4D).
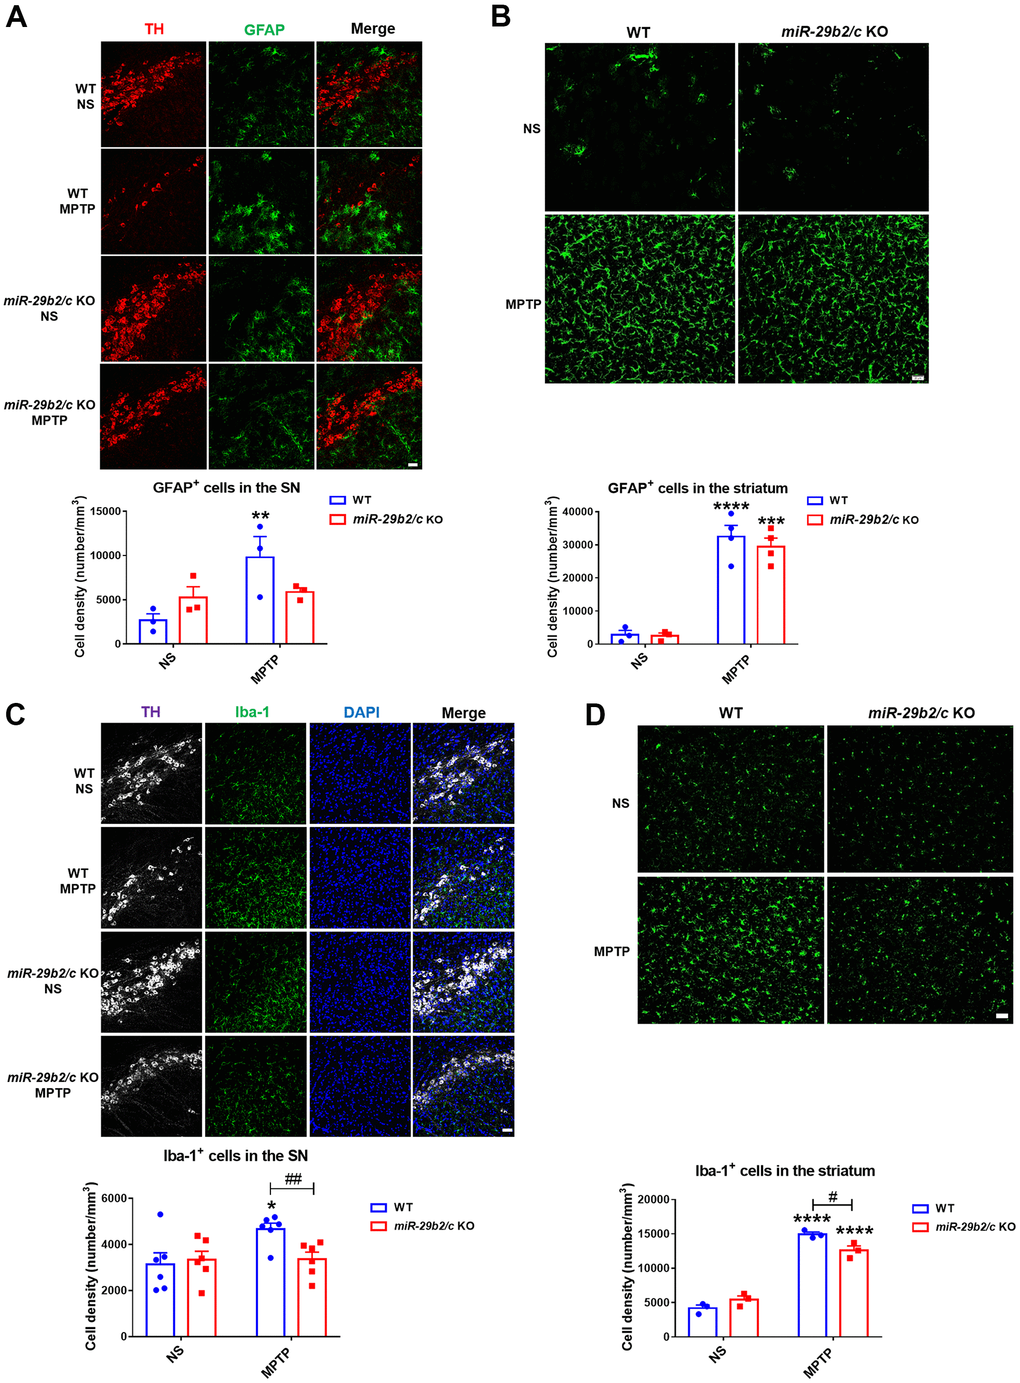
Figure 4. The analysis of glial activation in the nigrostriatal pathway at 3 days after MPTP administration. (A) Immunofluorescence staining for TH (red) and GFAP (green) in the SNpc of WT and miR-29b2/c KO mice. Scale bar: 0.1 mm. n =3-6. (B) Immunofluorescence staining for GFAP (green) in the striatum of WT and miR-29b2/c KO mice. Scale bar: 0.02mm. n =3-4. (C) Immunofluorescence staining for TH (white) and Iba-1 (green) in the SNpc of WT and miR-29b2/c KO mice. Nuclei were counterstained with DAPI (blue). Scale bar: 0.1 mm. n=6. (D) Immunofluorescence staining for Iba-1(green) in the striatum of WT and miR-29b2/c KO mice. Scale bar: 0.02mm. n=3-4. The counting of GFAP positive cells and Iba-1 positive cells in the SNpc and the striatum is shown in the lower panels. The differences were analyzed by two-way ANOVA followed by LSD multiple comparison tests. *p<0.05, **p<0.01, ***p<0.001 and ****p<0.0001, vs normal saline control. #p<0.05, vs WT group.
The effects of miR-29b2/c deficiency in primary cultured mixed glial cells
To gain insight into the mechanisms responsible for the different outcomes of the WT and miR-29b2/c KO mice after MPTP injection. The effects of miR-29b2/c deficiency on the characteristics of glial cells were studied using a primary culture system both at baseline and after toxin exposure. The transcripts of BDNF, GDNF and TGF-β1 increased in MPP+-treated WT and miR-29b2/c KO mixed glia (Supplementary Figure 7A, 7B). 36 h after MPP+ exposure, the GDNF expression level in miR-29b2/c KO mixed glia culture was significantly higher compared to WT mixed glia (Supplementary Figure 7A). MPP+ treatment upregulated the expression of IL-1β, IL-6 and COX-2 in mixed glia of WT mice. The treatment also increased IL-6 expression but did not affect the transcripts of IL-1β and COX-2 in miR-29b2/c KO mixed glia. The level of IL-1β in miR-29b2/c KO mixed glia was also lower compared to WT mixed glia 36 h after the treatment (Supplementary Figure 7C). Moreover, phosphorylated-AMPK (p-AMPK) proteins were indistinguishable between WT and miR-29b2/c KO mixed glia at baseline; whereas, p-AMPK levels were downregulated only in WT glia after 24 h- and 36 h-treatment of MPP+ (p=0.057 and p=0.09, respectively) (Supplementary Figure 7D).
The effects of miR-29b2/c deficiency in primary cultured astrocytes
A scratch assay was utilized to test if deficiency of miR-29b2/c affected astrocytic proliferation and migration. Primary miR-29b2/c KO astrocytes showed no difference in the ability of proliferation and migration (Supplementary Figure 8A). The cell viability of primary WT and miR-29b2/c KO astrocytes manifested no difference at baseline. After MPP+ intoxication, the cell viability of WT astrocytes was higher compared to the controls, whereas the viability of mutant astrocytes did not change [F(1, 18) = 5.727, P=0.0278] (Supplementary Figure 8B). Enhanced ROS product and glucose uptake were observed in MPP+-treated WT and miR-29b2/c KO astrocytes (Supplementary Figure 8C, 8D).
The expression levels of neurotrophic factors, inflammation-related molecules, astrocytic A1 type and A2 type marker genes in MPP+-treated astrocytes were measured. At 12 h after the challenge, the expression of BDNF was elevated in the WT and miR-29b2/c KO astrocytes (Figure 5A). TGF-β1 expression level was significantly upregulated in WT astrocytes after the exposure to MPP+, while it was downregulated in miR-29b2/c KO astrocytes when compared with wild-type astrocytes both at baseline and after the intoxication (Figure 5B). The base level of TNF transcript was lower in miR-29b2/c KO astrocytes when compared with WT astrocytes. After 12 h-treatment, the expression levels of IL-1β, IL-6 and COX-2 increased significantly in WT and miR-29b2/c astrocytes, whereas TNF transcript was elevated only in WT astrocytes, and IL-1β, TNF, and COX-2 transcripts decreased in miR-29b2/c KO astrocytic cells when compared with wild-type counterparts (Figure 5C). A1 marker H2-T23 and A2 marker CD14 were markedly lower in PBS-treated miR-29b2/c KO astrocytes when compared with WT controls. After 12 h-treatment, A1 markers H2-D1, Ggta1 and C3, and A2 markers Clcf1 and S100α10 were upregulated both in WT and miR-29b2/c KO astrocytes; H2-T23 increased only in WT astrocytes; Gbp2 and CD14 did not change in the two genotypes of astrocytes. Moreover, transcripts of H2-T23, H2-D1 and CD14 were downregulated in miR-29b2/c KO astrocytes when compared with WT controls (Figure 5D, 5E). 12 h and 24 h after the treatment, the levels of AMPK proteins and phosphorylated-AMPK proteins did not alter in WT astrocytes, whereas, at 24 h after MPP+ challenge, the AMPK protein level decreased in miR-29b2/c KO astrocytes, and the ratio of p-AMPK to AMPK in mutant astrocytes increased in comparison with WT astrocytes and PBS-treated mutant astrocytes as well (Figure 5F). Additionally, the conditioned medium from BV2 cells treated with PBS or LPS (shortly named as CM and LCM) was used to stimulate primary astrocytes of WT and miR-29b2/c KO mice. Though the expression of p-AMPK protein was not changed after 12 h-treatment of LCM, it was significantly higher in miR-29b2/c KO astrocytes compared with WT astrocytes. We observed that the p-AMPK proteins increased in both genotypes of astrocytes after 24 h-treatment of LCM. LCM stimulation markedly increased the expression of COX-2 proteins [F(2, 18) = 10.29, P=0.0010], however, the COX-2 protein level in miR-29b2/c KO astrocytes decreased compared with WT astrocytes (Figure 5G). Nitrite concentration in LCM-treated miR-29b2/c KO astrocytes was also significantly lower compared with LCM-treated WT astrocytes [F(2, 30) = 17, P<0.0001] (Figure 5H). Further, the expression of senescence marker genes was evaluated. 12 h-treatment of MPP+ increased p53 transcript levels in both WT and miR-29b2/c KO astrocytes. p19 and Pai1 transcripts were elevated only in WT astrocytes, and Pai1 expression levels in miR-29b2/c KO astrocytes were decreased compared to WT astrocytes after the treatment (Supplementary Figure 9A). Moreover, Bcl-2, Bax protein levels and the ratio of Bcl-2 to Bax did not change in WT and miR-29b2/c KO astrocytes (Supplementary Figure 9B).
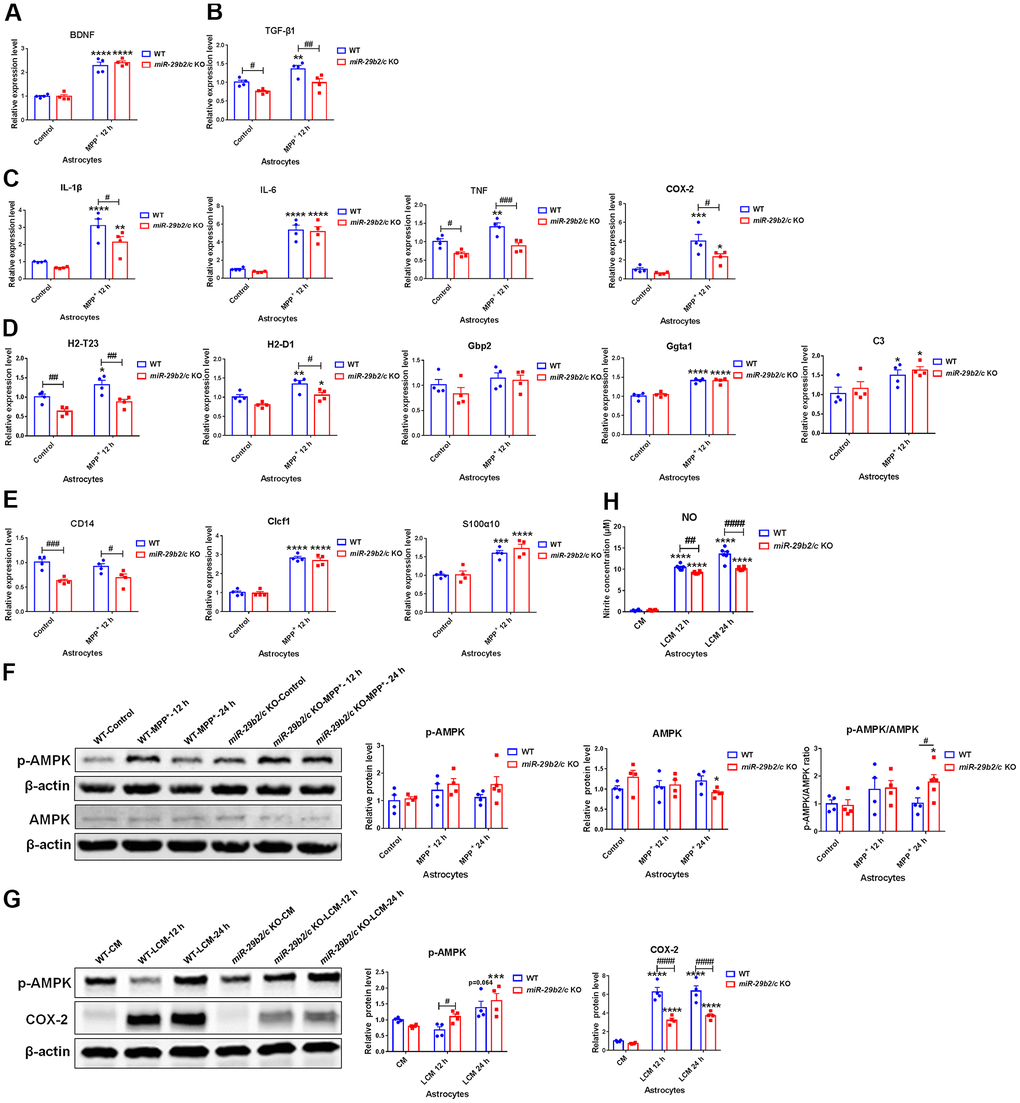
Figure 5. The effects of miR-29b2/c deficiency in MPP+- and conditioned medium-treated primary astrocytes. (A–E) qPCR analysis of BDNF (A), TGF-β1 (B), IL-1β, IL-6, TNF and COX2 (C), H2-T23, H2-D1, Gbp2, Gpta1 and C3 (D), CD14, Clcf1 and S100α10 (E) transcripts in WT and miR-29b2/c KO primary astrocytes treated with PBS or MPP+ for 12 h. n=4. (F) Western blot analysis of p-AMPK and AMPK protein expression in WT and miR-29b2/c KO primary astrocytes treated with PBS or MPP+ for 12 h and 24 h. β-actin served as a loading control. Quantifications of relative p-AMPK and AMPK protein levels and their ratio are shown in the right panel. n=4-5. (G) Western blot analysis of p-AMPK and COX-2 protein expression in WT and miR-29b2/c KO primary astrocytes exposed to conditioned medium (CM) or LPS-treated conditioned medium (LCM) of BV2 cells for 12 h and 24 h. β-actin served as a loading control. Quantifications of relative p-AMPK and COX-2 protein levels are shown in the right panel. n=3-4. (H) Nitrite concentration in the culture medium of WT and miR-29b2/c KO primary astrocytes treated with CM or LCM of BV2 cells for 12 h and 24 h. The differences were analyzed by two-way ANOVA followed by LSD multiple comparison tests. *p<0.05, **p < 0.01, ***p<0.001 and ****p<0.0001, vs PBS control. # p < 0.05, ## p < 0.01, ### p<0.001 and #### p<0.0001, vs WT group.
The effects of miR-29b2/c deficiency in primary cultured microglia
To measure the response of miR-29b2/c-deficient microglia to inflammatory stimuli, LPS was used. BDNF expression level was lower in miR-29b2/c KO microglia at baseline. Four and eight hours after LPS treatment, the amount of IL-1β, IL-6, TNF, and COX-2 transcripts were upregulated, while IGF-1 expression was downregulated in WT and miR-29b2/c KO microglial cells, the expression of BDNF only decreased in WT microglia [F(2, 27) = 41.5, P<0.0001]. IL-10 transcript increased in WT and miR-29b2/c KO microglia [F(2, 27) = 3.753, P=0.0365], and TGF-β1 transcript decreased in WT microglia at eight hours after the LPS challenge. BDNF and TGF-β1 transcripts were not changed in miR-29b2/c KO microglia. In addition, IL-6 transcripts were significantly reduced in miR-29b2/c KO microglia after the challenge compared to WT controls, IGF-1 and IL-10 transcripts were markedly higher in miR-29b2/c KO microglia after four and eight hours of intoxication, respectively (Figure 6A–6C). At baseline, the p-AMPK protein level and p-AMPK to AMPK ratio were dramatically elevated in miR-29b2/c KO microglia when compared with WT microglia. 24 h after the treatment of LPS, p-AMPK level [F(1, 17) = 5.066, P=0.0379] and the ratio [F(1, 17) = 5.537, P=0.0309] were elevated only in WT microglia (Figure 6D). At one hour after the treatment, the phosphorylated-NF-κB p65 (p-p65) proteins and p-p65 to p65 ratio, but not p65 proteins, increased in wild-type and miR-29b2/c KO microglial cells, yet the ratio decreased modestly in miR-29b2/c KO microglial cells when compared with WT microglia (p=0.071) (Figure 6E). The expression of COX-2 was enhanced in the two genotypes of microglial cells; whereas, the level of COX-2 in mutant microglia decreased when compared with WT controls after 24 h-treatment of LPS [F(1, 17) = 5.33, P=0.0338] (Figure 6D). Nitrite product was induced by the treatment of LPS in both genotypes of microglia, however, it was dramatically lower in miR-29b2/c KO microglia at baseline and after the treatment of LPS [F(1, 20) = 14.03, P=0.0013] (Figure 6F).
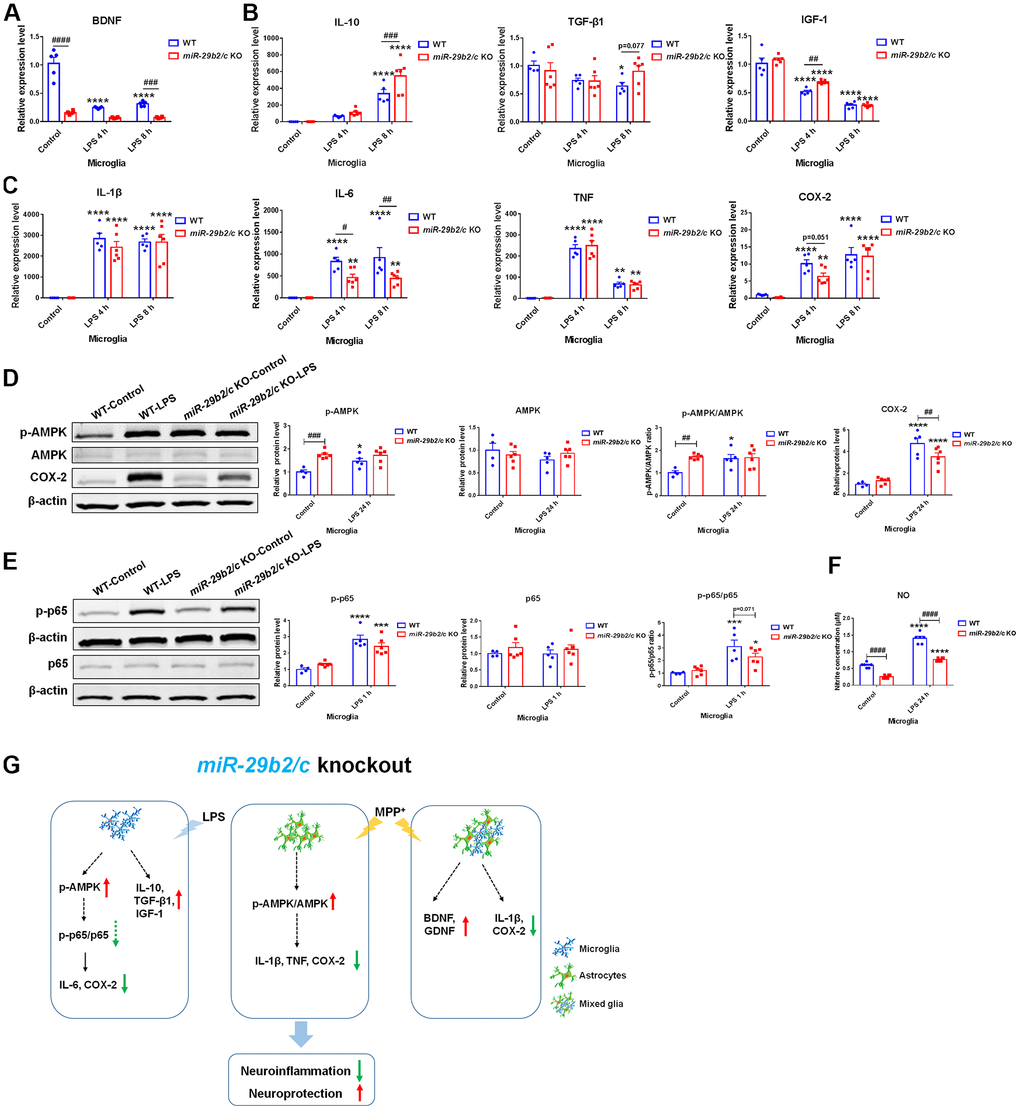
Figure 6. The effects of miR-29b2/c deficiency in LPS-treated primary microglia. (A) qPCR analysis of BDNF (A), IL-10 TGF-β1 and IGF-1 (B), and pro-inflammatory factors IL-1β, IL-6, TNF and COX2 (C) in WT and miR-29b2/c KO primary microglia treated with PBS or LPS for four and eight hours. n=4-6. (D) Western blot analysis of p-AMPK, AMPK and COX-2 protein expression in WT and miR-29b2/c KO primary microglia treated with PBS or LPS for 24 h. β-actin served as a loading control. Quantifications of relative p-AMPK, AMPK and COX-2 protein level and the ratio of p-AMPK to AMPK are shown in the right panel. n=4-6. (E) Western blot analysis of p-p65 and p65 protein expression in WT and miR-29b2/c KO primary microglia treated with PBS or LPS for one hour. Quantifications of relative p-p65 and p65 protein level and their ratio are shown in the right panel. n=4-6. (F) Nitrite concentration in the culture medium of WT and miR-29b2/c KO microglia treated with PBS or LPS for 24 h. n=6. The differences were analyzed by two-way ANOVA followed by LSD multiple comparison tests. *p<0.05, **p < 0.01, ***p<0.001 and ****p<0.0001, vs PBS control. # p < 0.05, ## p < 0.01, ### p<0.001 and ####p<0.0001, vs WT group. (G) Diagram of effects of miR-29b2/c deficiency in Parkinson’s disease.
Discussion
The expression of miR-29 family members is upregulated in multiple tissues when individuals are getting older [30–32]. Works from our lab and others have shown a linkage between miR-29s and Parkinson’s disease [33]. In the present study, the roles of miR-29b2/c in aging and Parkinson’s disease were studied. miR-29s exert pro- and anti-aging effects depended on tissues, species and stages of development. We found that 3-month-old miR-29b2/c KO mice had a normal skeleton and adipose tissue, and 4-month-old miR-29b2/c KO mice displayed lighter body weight compared with their WT counterpart, which is in agreement with other studies [11, 34]. Muscle weakness and unstable gait were detected in 3-month-old miR-29b2/c KO mice. Thirteen-month-old miR-29b2/c KO mice showed dermis thickening. However, they had the normal fine structure of femur bone. The reduction of body weight existed in 16-month-old miR-29b2/c KO mice. At this age, miR-29b2/c KO mice had less abdominal fat and brown fat, and exhibited apparent kyphosis. miR-29s are involved in p53-mediated cell cycle arrest [35, 36] and p16/Rb-driven cellular senescence [37]. However, cellular senescence was not evident in the miR-29b2/c KO mouse brain. Therefore, though miR-29b2/c contributes to the regulation of aging, its roles in the peripheral tissues and the brain might be different.
The serum levels of miR-29s were downregulated in patients with PD compared to healthy controls [24]. Here, we found that miR-29s expression in PD mouse serum fluctuated from 3 to 120 days after MPTP administration. miR-29s are abundant in the brain [6, 30]. Via going through GEO profile, miR-29c expression is found to be upregulated in the substantia nigra of PD patients (p=0.0059, by Mann-Whitney test), moreover, miR-29c expression in the superior frontal gyrus did not differ (p=0.47, by Student-T-test), when compared with the control subjects (Supplementary Figure 10). Here, miR-29b2/c KO mice were challenged with MPTP to induce PD-like injuries. The mutant mice showed less severe injuries to the nigrostriatal dopaminergic system and milder glial activation, and subsequently behavioral resistance to some extent. Thus, miR-29b2/c has a detrimental role in the pathology of PD. We observed that in the MPTP-induced mouse PD model, the striatal levels of p21, p53 and Pai1 transcripts did not change, suggesting cellular senescence might not occur. Aging is regarded as a high risk factor for the development of PD [38], however, aging-related changes in the brain, especially the dopaminergic system might be a more relevant factor.
Primary glia from WT and miR-29b2/c KO mice were cultured to investigate the underlying mechanisms. MPP+ treatment increased GDNF expression, and decreased IL-1β expression in the miR-29b2/c-deficient mixed glia. MPP+ also increased the expression of pro-inflammatory genes in WT astrocytes but not in miR-29b2/c-deficient astrocytes. Likewise, mutant astrocytes produced less NO compared with WT astrocytes after being exposed to the conditioned medium of BV2 cells treated with LPS. In primary microglia culture, compared to LPS-treated WT controls, the transcripts of anti-inflammation cytokine IL-10 and neurotrophic factor IGF-1 were markedly higher, and the transcripts of pro-inflammation cytokine IL-6 decreased in LPS-treated miR-29b2/c KO microglia. NO levels were decreased in miR-29b2/c KO microglia at baseline and after the intoxication of LPS. Studies have shown that miR-29s and many predicted target genes are involved in metabolic processes [34, 39–41]. As an essential regulator, AMPK has been proven to be protective in PD when activated [42]. Activation of AMPK stimulates Sirtuin 1, and inhibits NF-κB activation and downstream inflammatory target genes indirectly [43]. We observed that the phosphorylated-AMPK protein level and the ratio of p-AMPK to AMPK were upregulated in LCM-treated and MPP+-treated miR-29b2/c KO astrocytes respectively. The COX-2 protein level was decreased in LCM-treated mutant astrocytes compared to WT astrocytes. At baseline, AMPK activity was elevated in miR-29b2/c KO microglia. The amount of COX-2 protein was significantly reduced in miR-29b2/c KO microglia when compared with WT controls after the treatment of LPS. Under LPS treatment, the p-p65 and p65 ratio was slightly downregulated in the mutant microglia, implied a mitigated NF-κB signaling pathway. Our results indicate that enhanced AMPK activity and reduced inflammatory response in glia protect the nigrostriatal pathway in miR-29b2/c KO mice (Figure 6G). Conclusively, miR-29b2/c plays important roles in aging and damage in the nigrostriatal dopaminergic system.
Materials and Methods
Mice
miR-29b2/c KO mice and WT littermates were obtained from Shanghai Research Center for Model Organisms, China. Experimental protocols were approved by the Institutional Animal Care and Use Committee of Fudan University. Surgeries were conducted under general anesthesia. All efforts were taken to reduce adverse effects.
Mice were administered intraperitoneally with MPTP-HCl (Sigma, USA) at 20 mg/kg or normal saline (NS) for 5 consecutive days as described [44].
RNA and miRNA extraction, and quantitative PCR (qPCR)
The methods of RNA and miRNA extraction, reverse transcription, and qPCR were referred to our previous work [24, 45]. The primers for qPCR were listed in Table 1.
Table 1. Primers for qPCR analysis.
| Name | Sequence (5’ 3’) |
| Mouse actin F | CAGGATGCAGAAGGAGATTAC |
| Mouse actin R | AACGCAGCTCAGTAACAGTC |
| Mouse BDNF F | TCATACTTCGGTTGCATGAAGG |
| Mouse BDNF R | AGACCTCTCGAACCTGCCC |
| Mouse CD14 F | GGACTGATCTCAGCCCTCTG |
| Mouse CD14 R | GCTTCAGCCCAGTGAAAGAC |
| Mouse Clcf1 F | CTTCAATCCTCCTCGACTGG |
| Mouse Clcf1 R | TACGTCGGAGTTCAGCTGTG |
| Mouse COX2 F | GTTCATCCCTGACCCCCAAG |
| Mouse COX2 R | ACTCTGTTGTGCTCCCGAAG |
| Mouse GDNF F | GACGTCATGGATTTTATTCAAGCCACC |
| Mouse GDNF R | CTGGCCTACTTTGTCACTTGTTAGCCT |
| Mouse Gbp2 F | GGGGTCACTGTCTGACCACT |
| Mouse Gbp2 R | GGGAAACCTGGGATGAGATT |
| Mouse Ggta1 F | GTGAACAGCATGAGGGGTTT |
| Mouse Ggta1 R | GTTTTGTTGCCTCTGGGTGT |
| Mouse H2-D1 F | TCCGAGATTGTAAAGCGTGAAGA |
| Mouse H2-D1 R | ACAGGGCAGTGCAGGGATAG |
| Mouse H2-T23 F | GGACCGCGAATGACATAGC |
| Mouse H2-T23 R | GCACCTCAGGGTGACTTCAT |
| Mouse IGF-1 F | AGAGCCTGCGCAATGGAATAAAGT |
| Mouse IGF-1 R | TTGGTGGGCAGGGATAATGAGG |
| Mouse IL-1β F | GCAACTGTTCCTGAACTC |
| Mouse IL-1β R | CTCGGAGCCTGTAGTGCA |
| Mouse IL-6 F | CATAGCTACCTGGAGTACATGA |
| Mouse IL-6 R | CATTCATATTGTCAGTTCTTCG |
| Mouse IL-10 F | AGCCGGGAAGACAATAACTG |
| Mouse IL-10 R | GGAGTCGGTTAGCAGTATGTTG |
| Mouse iNOS F | CCCTTCCGAAGTTTCTGGCAGCAGC |
| Mouse iNOS R | GGCTGTCAGAGCCTCGTGGCTTTGG |
| Mouse p21 F | GTGGGTCTGACTCCAGCCC |
| Mouse p21 R | CCTTCTCGTGAGACGCTTAC |
| Mouse p19Arf F | GCCGCACCGGAATCCT |
| Mouse p19Arf R | TTGAGCAGAAGAGCTGCTACGT |
| Mouse Pai1 F | TCAGAGCAACAAGTTCAACTACACTGAG |
| Mouse Pai1 R | CCCACTGTCAAGGCTCCATCACTTGCCCA |
| Mouse p53 F | GAGTATACCACCATCCACTACAAG |
| Mouse p53 R | GCACAAACACGAACCTCAAAG |
| Mouse S100α10 F | CCTCTGGCTGTGGACAAAAT |
| Mouse Slc10α6 R | CCACAGGCTTTTCTGGTGAT |
| Mouse TGF-β1 F | CCTGAGTGGCTGTCTTTTGA |
| Mouse TGF-β1 R | CGTGGAGTTTGTTATCTTTGCTG |
| Mouse TNF F | CACGCTCTTCTGTCTACTGAACTTC |
| Mouse TNF R | GCAGCCTTGTCCCTTGAAGAGAACC |
| Mouse YM1 F | GTCACAGGTCTGGCAATTC |
| Mouse YM1 R | GTAGAGACCATGGCACTG |
Western blot
Protein samples were separated by SDS-PAGE and transferred onto PVDF membranes (Millipore, USA). Primary antibodies were: rabbit phospho-AMPKα (Thr172) (1:1000; Cell Signaling Technology, USA), mouse anti-AMPK (1:1000; Proteintech, USA), rabbit anti-Bax (1:1000; Cell Signaling Technology, USA), rabbit anti-Bcl-2 (1:500; Cell Signal Technology, USA), rabbit anti-Sirtin1(1:1000, Millipore, USA), rabbit anti-COX2 (1:1000; Abcam, USA), rabbit anti-GFAP (1:1000; Dako, Japan), mouse anti-β-actin (1:1000; Santa Cruz Biotechnology, USA), mouse anti-NF-κB p65 (1:1000; Santa Cruz Biotechnology, USA), and rabbit anti-phospho-NFκB p65 (1:1000; Cell Signaling Technology, USA). Protein bands were detected with an Odyssey infrared imaging system (Li-Cor, USA).
Stereological cell counting, and quantification of Iba1+and GFAP+ cells
TH+ neurons in the SNpc were quantified as previously described [46]. Stereological counting was performed by two operators blinded to mouse groups.
To quantify Iba1+and GFAP+ cells, cell counting with Image-Pro Plus 6.0 (Media Cybernetics, USA) was performed as described [47].
HPLC
The striatal concentrations of monoamines (DA, 5-HT and NE) and their metabolites (DOPAC, HVA and 5-HIAA) were determined by HPLC as described [48].
Behavioral tests
Pole test
The Pole test was conducted as previously described [48]. A mouse was put head-up near the top of a pole (1 cm in diameter and 80 cm in height). Both the time to turn and time to climb down were recorded.
Wire hanging test
A mouse was suspended by its forelimbs from a 50 cm wide 2-mm thick metallic wire and subjected to a 180-sec hanging test as described [50].
Grid hanging test
Grid hanging test was carried out as described [51]. A mouse was put on a grid. The grid was then turned upside down. Latency to fall was recorded. The trial ended after 3 min.
Catwalk test
After habituating to the CatWalk XT gait analysis system (Noldus, Netherlands), a mouse was allowed to cross the recording field of the runway (40 cm in length) in both directions with three independent attempts. Runs for analysis were chosen based on a minimum of five-step cycles. CatWalk software was used to classify the footprints.
Rearing test
A mouse was placed in a 400 mL glass beaker, and the rearing events were counted for a 3 min time course.
Cultures of primary astrocyte and microglial cells
Primary astrocyte and microglia were isolated from neonatal mice at P1-P3 as described [52]. After a culture of two weeks, astrocytic cells were purified by shaking at 200 rpm for 12 h. The purification of microglia was done as described [53]. On day 21, cultures were trypsinized (0.0625% trypsin) at 37° C for 40 min. Microglia were cultured with the mixed glial supernatants.
NO assay
The nitrite in the supernatant was detected by using Griess reagent (Beyotime, China) according to manufacturer instructions. Nitrite concentrations were calculated with reference to the standard curve generated with NaNO2.
Reactive oxygen species (ROS) assay
Dihydroethidium (DHE) (Sigma, USA) was used to probe superoxide radicals. Astrocytes were plated in 96-well plates at 5x10⁴ per well, and treated with 1mM MPP+ for different hours. Cells were then washed with PBS and incubated with 5 μM DHE at 37° C for 25 min. After washing, the fluorescence intensity was measured at an excitation wavelength of 485 nm and an emission wavelength of 512 nm as described [54].
Senescence-associated β-galactosidase (SA-β-gal) assay
The SA-β-gal assay was conducted using Senescence β -Galactosidase Staining Kit (Cell Signaling Technology, USA) according to manufacturer instructions.
X-ray micro-computed tomography (microCT) scan
Three-dimensional structures of a mouse were obtained by high-resolution X-ray microCT scanning (PerkinElmer, USA). Volumes were quantified using the region of interest module (AnalyzeDirect, USA).
Statistical analysis
Data were shown as the means ± SEM. All data were assessed for normal distribution by the Shapiro-Wilk test. When equal variances assumed, statistical significance was assessed by two-tailed Student’s T-test for two groups, or Two-way ANOVA followed by LSD multiple comparisons for three or more groups using Prism 7 software (GraphPad Software Inc., San Diego, USA). P < 0.05 was considered statistically significant. Corresponding values of significant interaction were presented for Figure 3–6 and Supplementary Figure 8 in the text.
Supplementary Materials
Author Contributions
F.H., J.F. and R.S. proposed and supervised the study. F.H., J.F., X.B., X.Z. and JH.W. wrote the manuscript. X.B., X.Z., R.F., JH.W., M.Y., Z.L., H.D., Q.L., J.G. and Y.M. performed the experiments. All authors contributed to the interpretation of data and the revision of the manuscript.
Acknowledgments
The authors are grateful to Professor Thomas Behnisch for kindly editing the paper.
Conflicts of Interest
The authors declare that they have no conflicts of interest.
Funding
This work was supported by grants from the National Natural Science Foundation of China (31970908, 31671043, 81571232 and 8126120568), Shanghai Municipal Science and Technology Major Project (No.2018SHZDZX01), ZJLab, Shanghai Center for Brain Science and Brain-Inspired Technology, Science and Technology Commission of Shanghai Municipality (19DZ2280500, 18DZ2293500), and the Open Project of State Key Laboratory of Medical Neurobiology (SKLMN2003).
References
- 1. Braak H, Del Tredici K. Invited Article: Nervous system pathology in sporadic Parkinson disease. Neurology. 2008; 70:1916–25. https://doi.org/10.1212/01.wnl.0000312279.49272.9f [PubMed]
- 2. Wang Q, Liu Y, Zhou J. Neuroinflammation in Parkinson’s disease and its potential as therapeutic target. Transl Neurodegener. 2015; 4:19. https://doi.org/10.1186/s40035-015-0042-0 [PubMed]
- 3. Wang Z, Dong H, Wang J, Huang Y, Zhang X, Tang Y, Li Q, Liu Z, Ma Y, Tong J, Huang L, Fei J, Yu M, et al. Pro-survival and anti-inflammatory roles of NF-κB c-Rel in the Parkinson’s disease models. Redox Biol. 2020; 30:101427. https://doi.org/10.1016/j.redox.2020.101427 [PubMed]
- 4. Zhu S, Wu H, Wu F, Nie D, Sheng S, Mo YY. MicroRNA-21 targets tumor suppressor genes in invasion and metastasis. Cell Res. 2008; 18:350–59. https://doi.org/10.1038/cr.2008.24 [PubMed]
- 5. Qiu L, Zhang W, Tan EK, Zeng L. Deciphering the function and regulation of microRNAs in Alzheimer’s disease and Parkinson’s disease. ACS Chem Neurosci. 2014; 5:884–94. https://doi.org/10.1021/cn500149w [PubMed]
- 6. Papadopoulou AS, Serneels L, Achsel T, Mandemakers W, Callaerts-Vegh Z, Dooley J, Lau P, Ayoubi T, Radaelli E, Spinazzi M, Neumann M, Hébert SS, Silahtaroglu A, et al. Deficiency of the miR-29a/b-1 cluster leads to ataxic features and cerebellar alterations in mice. Neurobiol Dis. 2015; 73:275–88. https://doi.org/10.1016/j.nbd.2014.10.006 [PubMed]
- 7. Hyun J, Choi SS, Diehl AM, Jung Y. Potential role of Hedgehog signaling and microRNA-29 in liver fibrosis of IKKβ-deficient mouse. J Mol Histol. 2014; 45:103–12. https://doi.org/10.1007/s10735-013-9532-5 [PubMed]
- 8. Qin W, Chung AC, Huang XR, Meng XM, Hui DS, Yu CM, Sung JJ, Lan HY. TGF-β/Smad3 signaling promotes renal fibrosis by inhibiting miR-29. J Am Soc Nephrol. 2011; 22:1462–74. https://doi.org/10.1681/ASN.2010121308 [PubMed]
- 9. Xiao J, Meng XM, Huang XR, Chung AC, Feng YL, Hui DS, Yu CM, Sung JJ, Lan HY. miR-29 inhibits bleomycin-induced pulmonary fibrosis in mice. Mol Ther. 2012; 20:1251–60. https://doi.org/10.1038/mt.2012.36 [PubMed]
- 10. Steiner DF, Thomas MF, Hu JK, Yang Z, Babiarz JE, Allen CD, Matloubian M, Blelloch R, Ansel KM. MicroRNA-29 regulates T-box transcription factors and interferon-γ production in helper T cells. Immunity. 2011; 35:169–81. https://doi.org/10.1016/j.immuni.2011.07.009 [PubMed]
- 11. Dooley J, Garcia-Perez JE, Sreenivasan J, Schlenner SM, Vangoitsenhoven R, Papadopoulou AS, Tian L, Schonefeldt S, Serneels L, Deroose C, Staats KA, Van der Schueren B, De Strooper B, et al. The microRNA-29 Family Dictates the Balance Between Homeostatic and Pathological Glucose Handling in Diabetes and Obesity. Diabetes. 2016; 65:53–61. https://doi.org/10.2337/db15-0770 [PubMed]
- 12. Adoro S, Cubillos-Ruiz JR, Chen X, Deruaz M, Vrbanac VD, Song M, Park S, Murooka TT, Dudek TE, Luster AD, Tager AM, Streeck H, Bowman B, et al. IL-21 induces antiviral microRNA-29 in CD4 T cells to limit HIV-1 infection. Nat Commun. 2015; 6:7562. https://doi.org/10.1038/ncomms8562 [PubMed]
- 13. Ma F, Xu S, Liu X, Zhang Q, Xu X, Liu M, Hua M, Li N, Yao H, Cao X. The microRNA miR-29 controls innate and adaptive immune responses to intracellular bacterial infection by targeting interferon-γ. Nat Immunol. 2011; 12:861–69. https://doi.org/10.1038/ni.2073 [PubMed]
- 14. Jovičić A, Roshan R, Moisoi N, Pradervand S, Moser R, Pillai B, Luthi-Carter R. Comprehensive expression analyses of neural cell-type-specific miRNAs identify new determinants of the specification and maintenance of neuronal phenotypes. J Neurosci. 2013; 33:5127–37. https://doi.org/10.1523/JNEUROSCI.0600-12.2013 [PubMed]
- 15. Ouyang YB, Xu L, Lu Y, Sun X, Yue S, Xiong XX, Giffard RG. Astrocyte-enriched miR-29a targets PUMA and reduces neuronal vulnerability to forebrain ischemia. Glia. 2013; 61:1784–94. https://doi.org/10.1002/glia.22556 [PubMed]
- 16. Shioya M, Obayashi S, Tabunoki H, Arima K, Saito Y, Ishida T, Satoh J. Aberrant microRNA expression in the brains of neurodegenerative diseases: miR-29a decreased in Alzheimer disease brains targets neurone navigator 3. Neuropathol Appl Neurobiol. 2010; 36:320–30. https://doi.org/10.1111/j.1365-2990.2010.01076.x [PubMed]
- 17. Hébert SS, Horré K, Nicolaï L, Papadopoulou AS, Mandemakers W, Silahtaroglu AN, Kauppinen S, Delacourte A, De Strooper B. Loss of microRNA cluster miR-29a/b-1 in sporadic Alzheimer’s disease correlates with increased BACE1/beta-secretase expression. Proc Natl Acad Sci USA. 2008; 105:6415–20. https://doi.org/10.1073/pnas.0710263105 [PubMed]
- 18. Johnson R, Zuccato C, Belyaev ND, Guest DJ, Cattaneo E, Buckley NJ. A microRNA-based gene dysregulation pathway in Huntington’s disease. Neurobiol Dis. 2008; 29:438–45. https://doi.org/10.1016/j.nbd.2007.11.001 [PubMed]
- 19. Packer AN, Xing Y, Harper SQ, Jones L, Davidson BL. The bifunctional microRNA miR-9/miR-9* regulates REST and CoREST and is downregulated in Huntington’s disease. J Neurosci. 2008; 28:14341–46. https://doi.org/10.1523/JNEUROSCI.2390-08.2008 [PubMed]
- 20. Nolan K, Mitchem MR, Jimenez-Mateos EM, Henshall DC, Concannon CG, Prehn JH. Increased expression of microRNA-29a in ALS mice: functional analysis of its inhibition. J Mol Neurosci. 2014; 53:231–41. https://doi.org/10.1007/s12031-014-0290-y [PubMed]
- 21. Roshan R, Shridhar S, Sarangdhar MA, Banik A, Chawla M, Garg M, Singh VP, Pillai B. Brain-specific knockdown of miR-29 results in neuronal cell death and ataxia in mice. RNA. 2014; 20:1287–97. https://doi.org/10.1261/rna.044008.113 [PubMed]
- 22. Khanna S, Rink C, Ghoorkhanian R, Gnyawali S, Heigel M, Wijesinghe DS, Chalfant CE, Chan YC, Banerjee J, Huang Y, Roy S, Sen CK. Loss of miR-29b following acute ischemic stroke contributes to neural cell death and infarct size. J Cereb Blood Flow Metab. 2013; 33:1197–206. https://doi.org/10.1038/jcbfm.2013.68 [PubMed]
- 23. Shi G, Liu Y, Liu T, Yan W, Liu X, Wang Y, Shi J, Jia L. Upregulated miR-29b promotes neuronal cell death by inhibiting Bcl2L2 after ischemic brain injury. Exp Brain Res. 2012; 216:225–30. https://doi.org/10.1007/s00221-011-2925-3 [PubMed]
- 24. Bai X, Tang Y, Yu M, Wu L, Liu F, Ni J, Wang Z, Wang J, Fei J, Wang W, Huang F, Wang J. Downregulation of blood serum microRNA 29 family in patients with Parkinson’s disease. Sci Rep. 2017; 7:5411. https://doi.org/10.1038/s41598-017-03887-3 [PubMed]
- 25. Han L, Tang Y, Bai X, Liang X, Fan Y, Shen Y, Huang F, Wang J. Association of the serum microRNA-29 family with cognitive impairment in Parkinson’s disease. Aging (Albany NY). 2020; 12:13518–28. https://doi.org/10.18632/aging.103458 [PubMed]
- 26. Chinta SJ, Woods G, Demaria M, Rane A, Zou Y, McQuade A, Rajagopalan S, Limbad C, Madden DT, Campisi J, Andersen JK. Cellular Senescence Is Induced by the Environmental Neurotoxin Paraquat and Contributes to Neuropathology Linked to Parkinson’s Disease. Cell Rep. 2018; 22:930–40. https://doi.org/10.1016/j.celrep.2017.12.092 [PubMed]
- 27. Willard AM, Bouchard RS, Gittis AH. Differential degradation of motor deficits during gradual dopamine depletion with 6-hydroxydopamine in mice. Neuroscience. 2015; 301:254–67. https://doi.org/10.1016/j.neuroscience.2015.05.068 [PubMed]
- 28. Kam TI, Mao X, Park H, Chou SC, Karuppagounder SS, Umanah GE, Yun SP, Brahmachari S, Panicker N, Chen R, Andrabi SA, Qi C, Poirier GG, et al. Poly(ADP-ribose) drives pathologic α-synuclein neurodegeneration in Parkinson’s disease. Science. 2018; 362:eaat8407. https://doi.org/10.1126/science.aat8407 [PubMed]
- 29. Huang D, Xu J, Wang J, Tong J, Bai X, Li H, Wang Z, Huang Y, Wu Y, Yu M, Huang F. Dynamic Changes in the Nigrostriatal Pathway in the MPTP Mouse Model of Parkinson’s Disease. Parkinsons Dis. 2017; 2017:9349487. https://doi.org/10.1155/2017/9349487 [PubMed]
- 30. Ugalde AP, Ramsay AJ, de la Rosa J, Varela I, Mariño G, Cadiñanos J, Lu J, Freije JM, López-Otín C. Aging and chronic DNA damage response activate a regulatory pathway involving miR-29 and p53. EMBO J. 2011; 30:2219–32. https://doi.org/10.1038/emboj.2011.124 [PubMed]
- 31. Hu Z, Klein JD, Mitch WE, Zhang L, Martinez I, Wang XH. MicroRNA-29 induces cellular senescence in aging muscle through multiple signaling pathways. Aging (Albany NY). 2014; 6:160–75. https://doi.org/10.18632/aging.100643 [PubMed]
- 32. Fenn AM, Smith KM, Lovett-Racke AE, Guerau-de-Arellano M, Whitacre CC, Godbout JP. Increased micro-RNA 29b in the aged brain correlates with the reduction of insulin-like growth factor-1 and fractalkine ligand. Neurobiol Aging. 2013; 34:2748–58. https://doi.org/10.1016/j.neurobiolaging.2013.06.007 [PubMed]
- 33. Wang R, Yang Y, Wang H, He Y, Li C. MiR-29c protects against inflammation and apoptosis in Parkinson’s disease model in vivo and in vitro by targeting SP1. Clin Exp Pharmacol Physiol. 2020; 47:372–82. https://doi.org/10.1111/1440-1681.13212 [PubMed]
- 34. Caravia XM, Fanjul V, Oliver E, Roiz-Valle D, Morán-Álvarez A, Desdín-Micó G, Mittelbrunn M, Cabo R, Vega JA, Rodríguez F, Fueyo A, Gómez M, Lobo-González M, et al. The microRNA-29/PGC1α regulatory axis is critical for metabolic control of cardiac function. PLoS Biol. 2018; 16:e2006247. https://doi.org/10.1371/journal.pbio.2006247 [PubMed]
- 35. Varela I, Cadiñanos J, Pendás AM, Gutiérrez-Fernández A, Folgueras AR, Sánchez LM, Zhou Z, Rodríguez FJ, Stewart CL, Vega JA, Tryggvason K, Freije JM, López-Otín C. Accelerated ageing in mice deficient in Zmpste24 protease is linked to p53 signalling activation. Nature. 2005; 437:564–68. https://doi.org/10.1038/nature04019 [PubMed]
- 36. Park SY, Lee JH, Ha M, Nam JW, Kim VN. miR-29 miRNAs activate p53 by targeting p85 alpha and CDC42. Nat Struct Mol Biol. 2009; 16:23–29. https://doi.org/10.1038/nsmb.1533 [PubMed]
- 37. Martinez I, Cazalla D, Almstead LL, Steitz JA, DiMaio D. miR-29 and miR-30 regulate B-Myb expression during cellular senescence. Proc Natl Acad Sci USA. 2011; 108:522–27. https://doi.org/10.1073/pnas.1017346108 [PubMed]
- 38. Collier TJ, Kanaan NM, Kordower JH. Aging and Parkinson’s disease: Different sides of the same coin? Mov Disord. 2017; 32:983–90. https://doi.org/10.1002/mds.27037 [PubMed]
- 39. Massart J, Sjögren RJ, Lundell LS, Mudry JM, Franck N, O’Gorman DJ, Egan B, Zierath JR, Krook A. Altered miR-29 Expression in Type 2 Diabetes Influences Glucose and Lipid Metabolism in Skeletal Muscle. Diabetes. 2017; 66:1807–18. https://doi.org/10.2337/db17-0141 [PubMed]
- 40. Dooley J, Lagou V, Garcia-Perez JE, Himmelreich U, Liston A. miR-29a-deficiency does not modify the course of murine pancreatic acinar carcinoma. Oncotarget. 2017; 8:26911–17. https://doi.org/10.18632/oncotarget.15850 [PubMed]
- 41. Kwon JJ, Factora TD, Dey S, Kota J. A Systematic Review of miR-29 in Cancer. Mol Ther Oncolytics. 2018; 12:173–94. https://doi.org/10.1016/j.omto.2018.12.011 [PubMed]
- 42. Lu M, Su C, Qiao C, Bian Y, Ding J, Hu G. Metformin Prevents Dopaminergic Neuron Death in MPTP/P-Induced Mouse Model of Parkinson’s Disease via Autophagy and Mitochondrial ROS Clearance. Int J Neuropsychopharmacol. 2016; 19:pyw047. https://doi.org/10.1093/ijnp/pyw047 [PubMed]
- 43. Salminen A, Hyttinen JM, Kaarniranta K. AMP-activated protein kinase inhibits NF-κB signaling and inflammation: impact on healthspan and lifespan. J Mol Med (Berl). 2011; 89:667–76. https://doi.org/10.1007/s00109-011-0748-0 [PubMed]
- 44. Selvaraj S, Sun Y, Watt JA, Wang S, Lei S, Birnbaumer L, Singh BB. Neurotoxin-induced ER stress in mouse dopaminergic neurons involves downregulation of TRPC1 and inhibition of AKT/mTOR signaling. J Clin Invest. 2012; 122:1354–67. https://doi.org/10.1172/JCI61332 [PubMed]
- 45. Li Q, Shen C, Liu Z, Ma Y, Wang J, Dong H, Zhang X, Wang Z, Yu M, Ci L, Sun R, Shen R, Fei J, Huang F. Partial depletion and repopulation of microglia have different effects in the acute MPTP mouse model of Parkinson’s disease. Cell Prolif. 2021; 54:e13094. https://doi.org/10.1111/cpr.13094 [PubMed]
- 46. Liberatore GT, Jackson-Lewis V, Vukosavic S, Mandir AS, Vila M, McAuliffe WG, Dawson VL, Dawson TM, Przedborski S. Inducible nitric oxide synthase stimulates dopaminergic neurodegeneration in the MPTP model of Parkinson disease. Nat Med. 1999; 5:1403–09. https://doi.org/10.1038/70978 [PubMed]
- 47. Baiguera C, Alghisi M, Pinna A, Bellucci A, De Luca MA, Frau L, Morelli M, Ingrassia R, Benarese M, Porrini V, Pellitteri M, Bertini G, Fabene PF, et al. Late-onset Parkinsonism in NFκB/c-Rel-deficient mice. Brain. 2012; 135:2750–65. https://doi.org/10.1093/brain/aws193 [PubMed]
- 48. Huang D, Wang Z, Tong J, Wang M, Wang J, Xu J, Bai X, Li H, Huang Y, Wu Y, Ma Y, Yu M, Huang F. Long-term Changes in the Nigrostriatal Pathway in the MPTP Mouse Model of Parkinson’s Disease. Neuroscience. 2018; 369:303–13. https://doi.org/10.1016/j.neuroscience.2017.11.041 [PubMed]
- 49. Su J, Wang H, Yang Y, Wang J, Li H, Huang D, Huang L, Bai X, Yu M, Fei J, Huang F. RESP18 deficiency has protective effects in dopaminergic neurons in an MPTP mouse model of Parkinson’s disease. Neurochem Int. 2018; 118:195–204. https://doi.org/10.1016/j.neuint.2018.06.010 [PubMed]
- 50. van Putten M, Aartsma-Rus A, Raymackers JM, Dorchies O, Nagaraju K, Carlson G. The use of hanging wire tests to monitor muscle strength and condition over time. 2011; p.12. http://www.treat-nmd.eu/downloads/file/sops/dmd/MDX/DMD_M.2.1.004.pdf.
- 51. van Putten M, Kumar D, Hulsker M, Hoogaars WM, Plomp JJ, van Opstal A, van Iterson M, Admiraal P, van Ommen GJ, ‘t Hoen PA, Aartsma-Rus A. Comparison of skeletal muscle pathology and motor function of dystrophin and utrophin deficient mouse strains. Neuromuscul Disord. 2012; 22:406–17. https://doi.org/10.1016/j.nmd.2011.10.011 [PubMed]
- 52. Shao W, Zhang SZ, Tang M, Zhang XH, Zhou Z, Yin YQ, Zhou QB, Huang YY, Liu YJ, Wawrousek E, Chen T, Li SB, Xu M, et al. Suppression of neuroinflammation by astrocytic dopamine D2 receptors via αB-crystallin. Nature. 2013; 494:90–94. https://doi.org/10.1038/nature11748 [PubMed]
- 53. Saura J, Tusell JM, Serratosa J. High-yield isolation of murine microglia by mild trypsinization. Glia. 2003; 44:183–89. https://doi.org/10.1002/glia.10274 [PubMed]
- 54. Lee YJ, Choi DY, Choi IS, Han JY, Jeong HS, Han SB, Oh KW, Hong JT. Inhibitory effect of a tyrosine-fructose Maillard reaction product, 2,4-bis(p-hydroxyphenyl)-2-butenal on amyloid-β generation and inflammatory reactions via inhibition of NF-κB and STAT3 activation in cultured astrocytes and microglial BV-2 cells. J Neuroinflammation. 2011; 8:132. https://doi.org/10.1186/1742-2094-8-132 [PubMed]