


Introduction
Aneurysmal subarachnoid hemorrhage (aSAH) is a life-threatening medical event caused by the rupture of an intracranial aneurysm, resulting in blood leakage into the subarachnoid space [1]. According to the relevant literature, aSAH accounts for 75%-80% of nontraumatic SAH, with an annual incidence of approximately 6-16 cases per 100,000 individuals worldwide [2]. The mortality rate of SAH is estimated to be approximately 40-50%, with a 36% mortality rate within 30 days of the development of symptoms [3–5].
The most common symptom of aSAH is severe headache, usually accompanied by nausea, vomiting, photophobia, and neck rigidity [6]. Moreover, as the disease progresses, patients may also experience symptoms such as drowsiness, confusion, focal neurological deficits, hemiparesis, and coma [6]. According to previous reports, approximately 30% to 40% of the aSAH case may present with a warning headache which occurs a few weeks before hemorrhage [7–10].
The prognosis of patients with aSAH is mainly related to early brain injury, early cerebral vasospasms, and delayed cerebral ischemia, which is considered to be the main cause of unfavorable outcomes [11]. Several studies suggested that severe early brain injury after aSAH may be the leading factor contributing to death and poor prognosis in aSAH [12, 13]. Early identification of individuals with aSAH and timely adjustment of treatment are the main approaches for improving patient prognosis.
In order to identify aSAH samples at an early stage, we hypothesized that potential biomarkers may exit in the peripheral blood, for prediction of aSAH. Accordingly, in this study, we analysed the peripheral blood samples of 43 patients with aSAH due to ruptured intracranial aneurysms and those of 18 individuals with headaches using the weighted gene co-expression analysis (WGCNA) to select hub genes associated with aSAH. Subsequently, critical genes were identified by combining these data with differentially expressed genes (DEG) analysis and validation in 35 clinical samples. We identified three genes, ALPL, ANAXA3 and ARG1, that may be associated with aSAH disease progression. The workflow of the current analysis is shown in Figure 1.
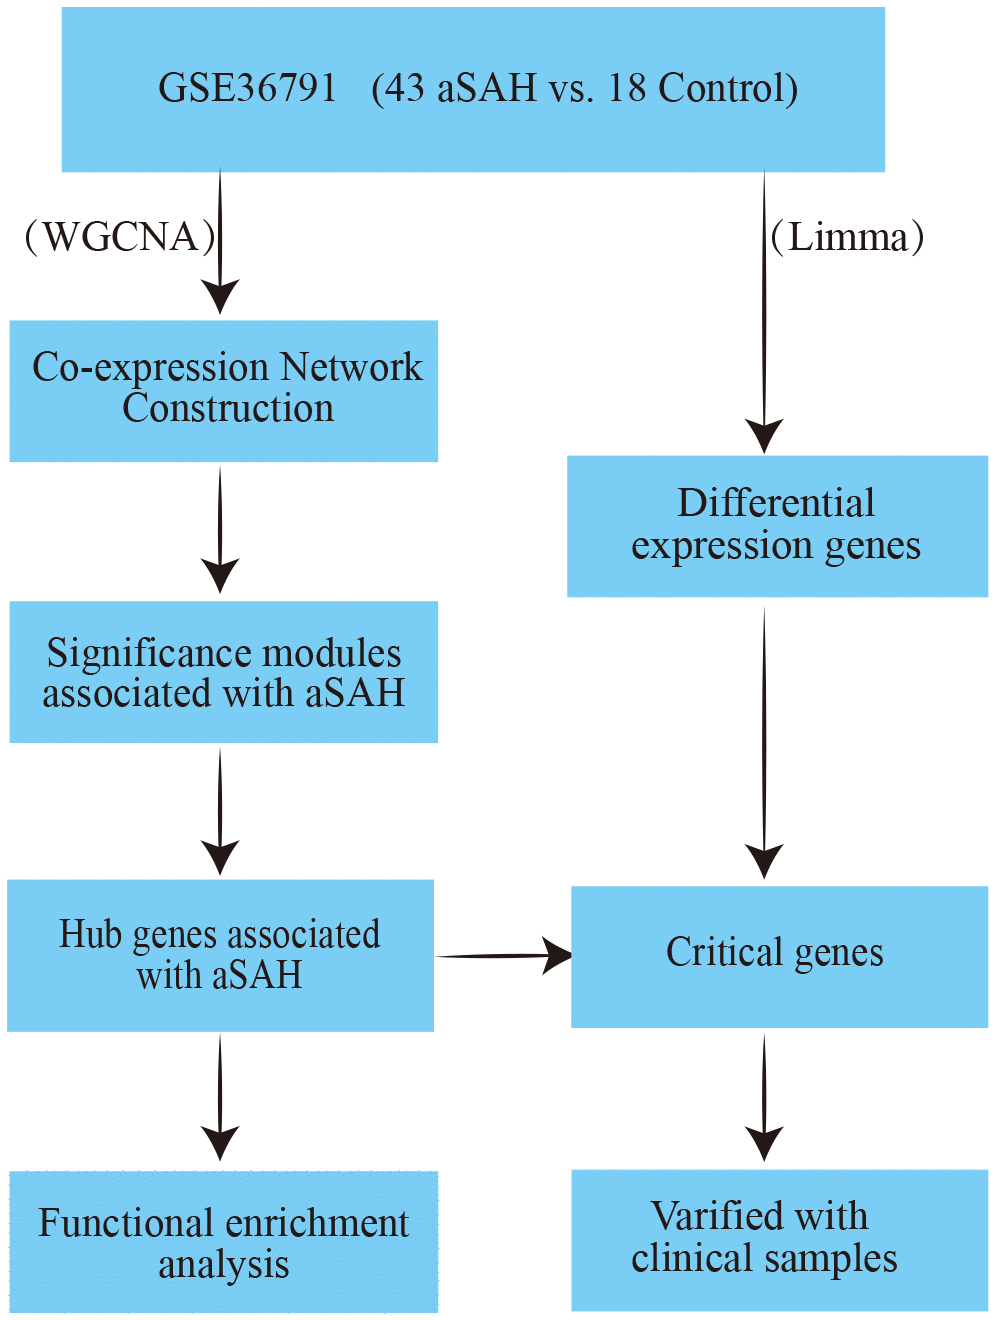
Figure 1. The workflow of this analysis.
Results
Data processing
For the data matrix, 12,095 unique genes were annotated with GPL10558 platform annotation file, and 7,987 of these genes were found to be protein-coding genes after referring to the human genome assembly GRCh38. The dataset included 43 aSAH samples and 18 control samples; no outlying samples were identified with the criterion Z.ku lower than the -5 base on Euclidean distance based sample network analysis. Thus, all samples expression data were applied to construct the co-expression network.
Weighted gene co-expression network construction
In WGCNA, we calculated the soft thresholding power base on the scale-free topology criterion using the pickSoft Threshold function. A beta value of 3 (R2 > 0.9) was chosen to construct the gene network by applying the default WGCNA approach (Figure 2A). In this analysis, 21 modules were identified with a minimum module size of 30, the medium sensitivity of 2 to branch splitting. We merged the modules with their pairwise correlation is larger than 0.8 so that to avoid modules eigengenes are highly correlated. Finally, 14 modules were picked out and they were displayed in Figure 2B.
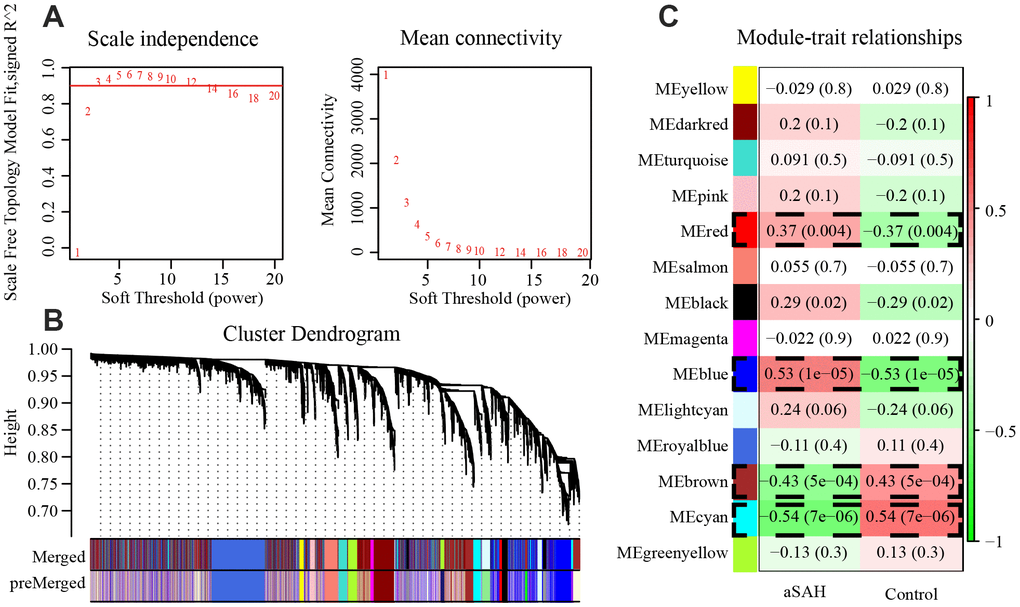
Figure 2. 4 modules were selected by WGCNA. (A) The panel shows analysis of the scale-free fit index and mean connectivity for various soft-thresholding powers (β). (B) Genes with the highest median absolute deviation enriched modules in co-expression network, 20 co-expression cluster were identified after merging the high related modules with cutoff value 0.2. (C) Correlation between each module and phenotype. Among the modules, red (P = 0.004), blue (P = 1e-05), brown (P = 5e-04) and cyan (P = 7e-06) showed closely associated with aSAH (P < 0.01).
Identification of significant modules
To select modules that were significantly associated with aSAH, the association between module eigengenes and clinical characteristics was evaluated with Pearson correlation analysis. Figure 2C shows the correlations between module eigengenes and aSAH. Among the modules, red (P = 0.004), blue (P = 1e-05), brown (P = 5e-04) and cyan (P = 7e-06) were closely associated with aSAH (P < 0.01). Genes with a high significance for aSAH and with high module membership in the selected four modules were identified depending on the gene significance (GS) and module membership (MM) measures. GS and MM were highly correlated in red (correlation coefficient = 0.77, P = 1e-09), blue (correlation coefficient = 0.94, P = 1e-200), brown (correlation coefficient = -0.85, P = 1e-200), and cyan (correlation coefficient = -0.91, P = 1e-200) modules, indicating that the red and blue modules contained genes with high positive correlations with aSAH, whereas the brown and cyan modules contained genes with negative correlations with aSAH (Figure 3A). The gene expression of genes in the aSAH group in the red (P < 0.01) and blue (P < 0.0001) modules was significantly higher than that of the genes in the control group, whereas the opposite results was observed for the brown (P < 0.001) and cyan (P < 0.0001) modules (Figure 3B).
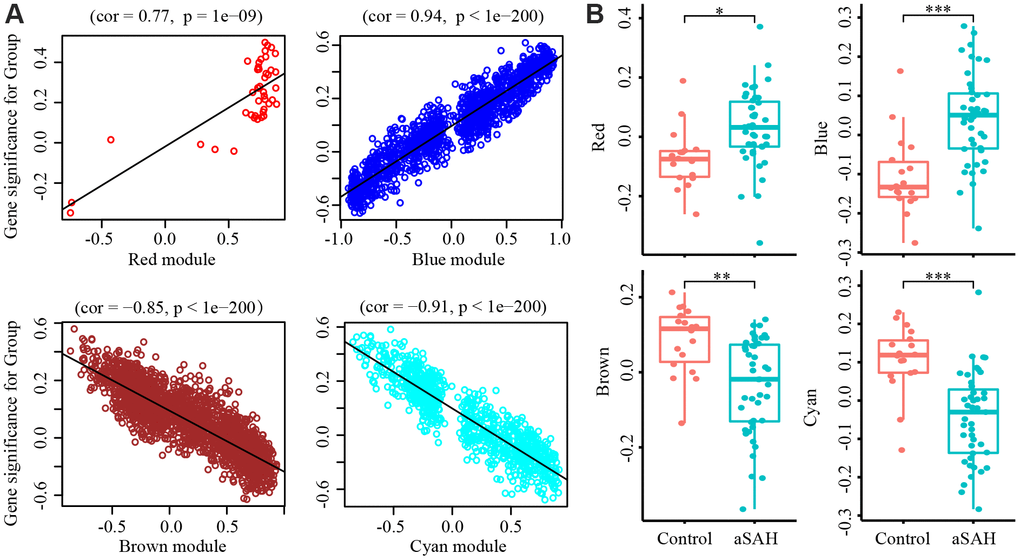
Figure 3. Gene Significance (GS) and module membership (MM) were calculated with Pearson correlation analysis. (A) The GS and MM are highly correlated in red (cor = 0.77, P = 1e-09), blue (cor = 0.94, P = 1e-200), brown (cor = -0.85, P = 1e-200) and cyan (cor = -0.91, P = 1e-200) module, indicated that the red and blue module contain genes that have high positive correlation with aSAH while the brown and cyan module contain genes that high negative correlations with aSAH. (B) The GS of aSAH group in red (*: p < 0.01) and blue (***: P < 0.0001) module were significantly higher than control group, while the opposite result was shown in the brown (**: P < 0.001) and cyan module (***: P < 0.0001).
Identification of hub genes and functional enrichment analysis
In each significant module, hub genes were identified based on the following criteria: absolute value of the correlation between the gene and aSAH higher than 0.2 and the absolute value of the correlation of the module higher than 0.8. Based on these thresholds, 364 hub genes were identified (Table 1). Then, the hub genes list was uploaded to Metascape (http://metascape.org/) to explore the biological functions of the hub genes. The top 10 biological processes (BPs) and Kyoto Encyclopedia of Genes and Genomes (KEGG) terms annotated with hub genes are displayed in Figure 4. The BP annotations showed that the hub genes were significantly enriched in the ribonucleoprotein complex biogenesis, ribosome biogenesis, translational initiation, nuclear-transcribed mRNA catabolic process, nonsense-mediated decay, viral gene expression, SRP-dependent cotranslational protein targeting to membrane, cotranslational protein targeting to the membrane, noncoding RNA processing, rRNA processing, and peptide biosynthetic process. The KEGG pathway enrichment analysis showed that the hub genes mainly participated in ribosome, hematopoietic cell lineage, tuberculosis, human T-cell leukemia virus 1 infection, ribosome biogenesis in eukaryotes, spliceosome, Th17 cell differentiation, RNA transport, toxoplasmosis, and human T-lymphotropic virus-I infection.
Table 1. Hub genes in significant modules.
| Modules | Genes |
| Red | ARRB2, CSF3R, DENND3, DYSF, GMIP, KDM6B, MAPK3, MTF1, PGD, PLEKHO2, RXRA, SEMA4A, TBC1D3G, THOC5, TOM1, USP32 |
| Blue | ABCF1, ABHD14A, ACSL1, ADA, AIP, AKIRIN2, AKR1B1, ALPK1, ALPL, ANXA3, APEX1, ARG1, ARHGAP24, ARPC2, ATP6V0E1, ATP6V1C1, B4GALT5, BASP1, BAZ1A, BCL2, BIN1, BOLA2, BRD9, BTBD10, BUB3, C12orf57, C16orf58, CA4, CAB39, CD2, CD27, CD3D, CD7, CD81, CEBPB, CMTM6, COMMD7, CPD, CR1, CS, CSF3R, CSGALNACT2, CSNK1D, CTBS, CUTA, DCTD, DDX24, DENND3, DNMT1, DNTTIP1, DYSF, ECH1, EIF3F, EIF3G, EIF3H, EIF3K, EIF3L, ELMO2, ERP29, ESD, ESYT1, ETS2, EVI2B, EXOC6, FAM102A, FARS2, FBL, FLT3LG, FN3KRP, FPR1, FPR2, FRAT1, FYN, GK, GLO1, GNG5, GOT2, GPR141, GTDC1, GTPBP4, GZMM, HAL, HIGD2A, HINT2, HLA-DMA, HLA-DMB, IL10RA, IMP4, IMPDH2, ITGAM, ITM2A, ITPR3, ITPRIP, IVNS1ABP, JMJD8, JUNB, KCNJ15, KIF1B, KLF6, KLHL2, LAT, LAT2, LIMK2, LIN7A, LRG1, LSM2, LY9, MAL, MANSC1, MCL1, MCTP2, MEGF9, MFNG, MRPL37, MRPS24, MTMR3, NAE1, NAMPT, NDEL1, NDUFS8, NGDN, NHP2, NOL11, NOP56, NR2C2AP, NUMB, OCIAD2, OSBPL9, OSTF1, PACSIN2, PCSK7, PEBP1, PFKFB4, PGD, PGS1, PHF21A, PHTF1, PLSCR3, PLXNC1, POLR1E, POLR2H, PPIH, PRKCD, PRMT1, PTEN, PVRIG, PYGL, QPCT, RANBP1, RASGRP4, RCC2, REPS2, RFTN1, RNF149, RNF24, RNPS1, ROPN1L, RPL10A, RPL12, RPL15, RPL18A, RPL19, RPL22, RPL24, RPL3, RPL35, RPL36, RPL5, RPL6, RPS16, RPS20, RPS27, RPS27A, RPS29, RPS3, RPS4X, RUVBL1, SAMSN1, SCAMP3, SF3A3, SH3GLB1, SLA, SLC25A44, SLC9A8, SMAP2, SNRPB, SNRPF, SP100, SPAG9, SPI1, SRGN, SSBP4, STAT3, STX3, STXBP5, TGFA, TLR4, TLR8, TMED3, TMEM109, TMEM160, TMEM203, TNFRSF1A, TNFRSF25, TPST1, TRIB1, TRIM25, TUBB, UFC1, URM1, USP32, VNN3, XRCC6, ZFAND3, ZNF281, ZNF428 |
| Brown | ABHD14A, ACAD9, ACTR5, AFG3L2, ALKBH3, BRD9, C16orf58, C8orf33, CCNDBP1, CD320, COPS6, CSE1L, CTNNBIP1, CTNNBL1, DCTD, DDX54, DNAJC9, DUS1L, EBP, ECHS1, EIF2B4, EIF3L, ELAC2, ENO2, ERP29, EXOSC1, EXOSC5, FARS2, FLT3LG, FNBP4, FXYD5, GGA2, GNL2, GRWD1, GSS, HIC2, IDUA, ITFG2, LCMT1, LONP1, LTBP3, LZTR1, MDC1, MFSD3, MORC2, MPRIP, MPV17, MRPL11, MRPL12, MRPL2, MRPL38, MRPS9, N6AMT1, NFX1, NHP2, NOP2, NUBP1, NUDC, NXT1, PAAF1, PACS2, PDCL3, PDXP, PEX14, PHB, PIGP, PLSCR3, POMT1, PRMT7, PRPF31, PTRH1, RASSF1, RNF220, RNF26, RPAIN, RPL19, RSAD1, SDHAF1, SIGMAR1, SLC25A1, SLC7A6, SNRPB, TACO1, TEX10, TMEM109, TMEM147, TMEM41A, TNFRSF25, TOMM40, TRIM68, TRMT1, TTC31, TYSND1, UCKL1, VAC14, WDR18, WDR74, ZBTB9, ZC3HC1, ZDHHC14, ZFP90, FYVE16 |
| Cyan | ACTR1A, AKAP11, API5, BRIX1, BUB3, C11orf1, C16orf58, CA4, CCND2, CD2, DDX47, DNAJC9, DNMT1, DOCK10, ETS1, FNBP4, GIMAP6, GOLGA8B, GTPBP4, HADH, HIBADH, IL7R, ITK, KHDRBS1, KIFAP3, LANCL1, LRIG1, LY9, MATR3, MPHOSPH10, NAE1, NOL11, NSA2, NUP54, PDCL3, PDLIM7, PEBP1, PGLYRP1, PPP3CC, PSMG2, PVRIG, RALGAPA1, RFTN1, RPL15, RPL22, RRN3, SET, SH2D1A, SLC7A6, SMARCAD1, STAMBPL1, SUCLG2, TARBP1, TC2N, TFB2M, THOC1, THUMPD1, TRAT1, TUBB, UBE2N, UBE2Q2, WBP11, WWP1, XPO4, ZNF529 |
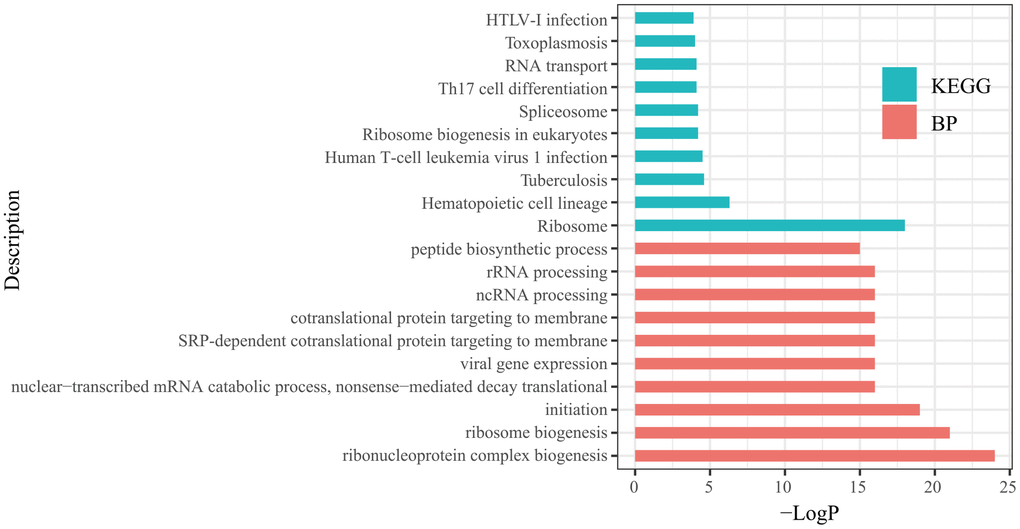
Figure 4. Top 10 biological processes (BP) and Kyoto Encyclopedia of Genes and Genomes (KEGG) analysis terms of hub genes.
Identification and validation of critical genes
In order to select critical genes from the hub genes, we analyzed the DEGs between aSAH and control individuals using the limma package, according to the cut-off criteria of |log2 fold change (FC)| greater than or equal to 1 and adjusted P value less than 0.05. Among all genes, 13 genes (CD27, IL2RB, FCER1A, ANXA3, ACSL1, HP, PGLYRP1, ALPL, ARG1, TPST1, SLPI, ECHDC3, and ORM1) were screened as DEGs (Table 2). The expression profile heatmap of the DEGs is shown in Figure 5A. Among the genes, 7 overlapped genes (CD27, ANXA3, ACSL1, PGLYRP1, ALPL, ARG1, and TPST1) were identified between DEGs and hub genes, including in one down-regulated gene (CD27) and six up-regulated genes (ANXA3, ACSL1, PGLYRP1, ALPL, ARG1, and TPST1) in aSAH (Figure 5B, 5C). These genes were defined as critical genes with playing a key role in the aSAH development. Receiver operating characteristic (ROC) curve was plotted and the area under the curve (AUC) was calculated to distinguish individuals with aSAH from controls. The AUCs of almost all critical gene was higher than 0.8 in the datasets, indicated they may be act as potential biomarker in diagnosing aSAH (Figure 6).
Table 2. DEGs identified with limma package.
| LogFC | AveExpr | t | P.Value | Adj.P.Val | B | Change | |
| CD27 | -1.10594 | 9.404925 | -6.84003 | 3.87E-09 | 7.72E-06 | 10.67715 | Down |
| IL2RB | -1.0878 | 9.875714 | -6.45442 | 1.80E-08 | 2.37E-05 | 9.234499 | Down |
| FCER1A | -1.49737 | 9.451985 | -6.38427 | 2.37E-08 | 2.37E-05 | 8.973335 | Down |
| ANXA3 | 1.525969 | 10.78493 | 5.864546 | 1.82E-07 | 5.68E-05 | 7.056242 | Up |
| ACSL1 | 1.08668 | 12.80813 | 5.031488 | 4.35E-06 | 0.000395 | 4.081304 | Up |
| HP | 1.29243 | 9.336274 | 4.982566 | 5.22E-06 | 0.000414 | 3.911711 | Up |
| PGLYRP1 | 1.053254 | 11.36885 | 4.885738 | 7.46E-06 | 0.000505 | 3.578054 | Up |
| ALPL | 1.032425 | 13.71477 | 4.861184 | 8.16E-06 | 0.000537 | 3.49388 | Up |
| ARG1 | 1.751164 | 9.920118 | 4.756838 | 1.19E-05 | 0.000649 | 3.138231 | Up |
| TPST1 | 1.001745 | 8.967003 | 4.088617 | 0.000126 | 0.003169 | 0.950828 | Up |
| SLPI | 1.003622 | 9.238332 | 4.083136 | 0.000128 | 0.003208 | 0.933614 | Up |
| ECHDC3 | 1.008504 | 8.890846 | 3.535259 | 0.000772 | 0.010721 | -0.7168 | Up |
| ORM1 | 1.069796 | 10.33428 | 2.994054 | 0.003936 | 0.033948 | -2.19028 | Up |
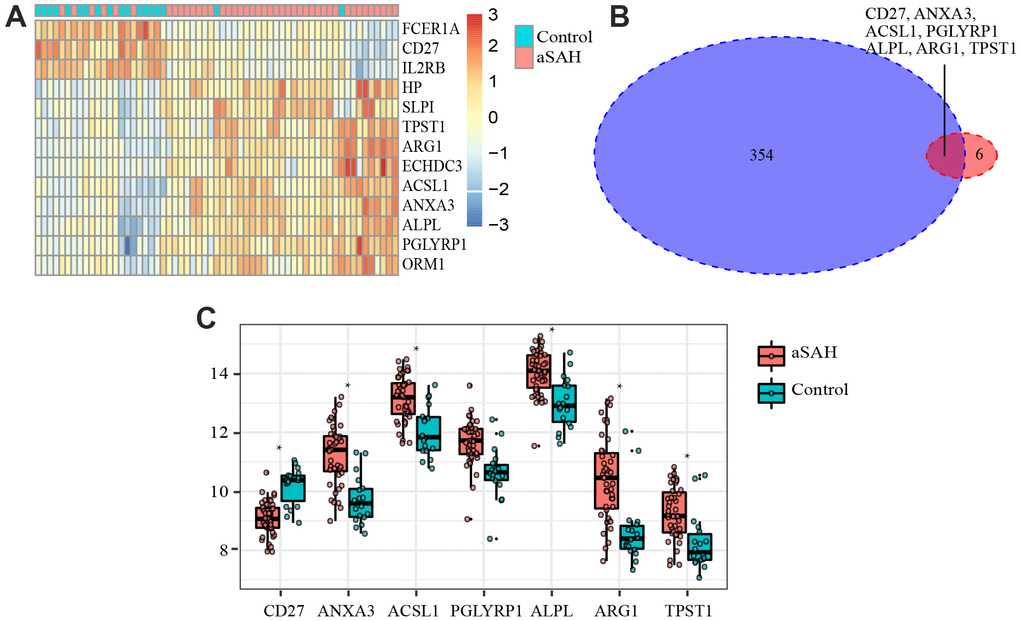
Figure 5. Differentially expressed genes (DEGs) and critical genes. (A) Heatmap of DEGs. (B) 7 critical genes were selected. (C) Expression of 7 critical genes in GSE36791.
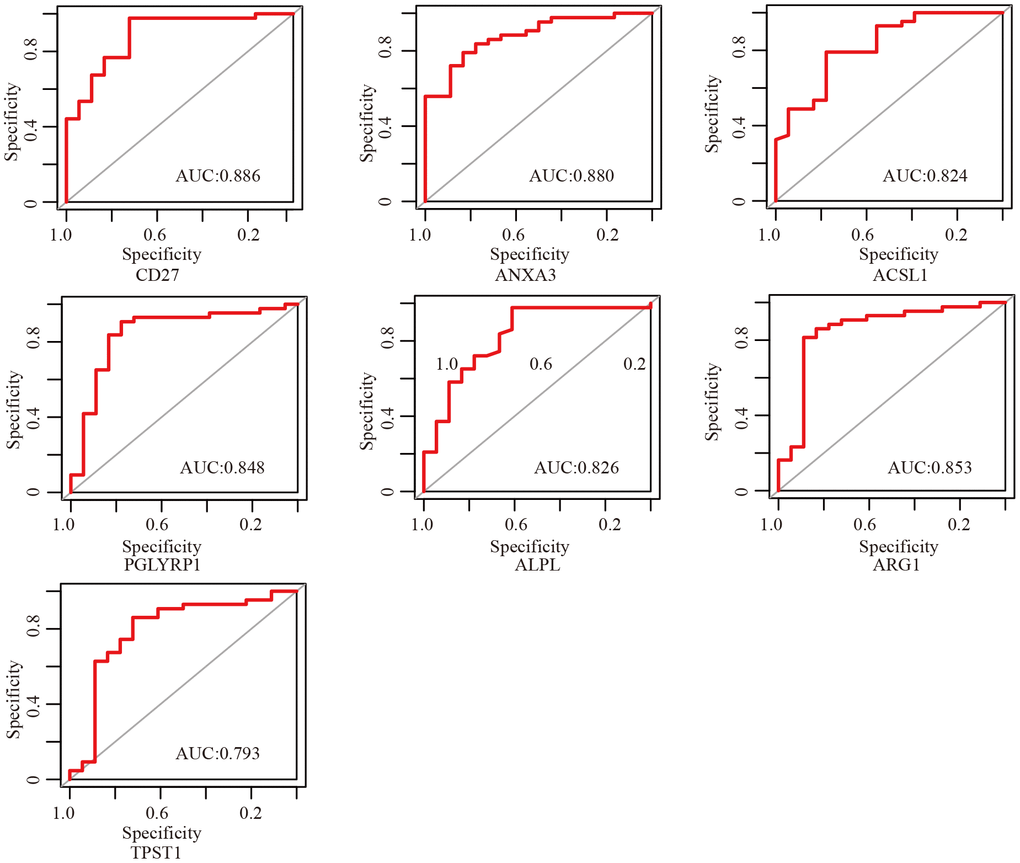
Figure 6. ROC curves of critical genes. The AUC of almost all critical gene was higher than 0.8.
To further test our analysis, we detected the expression of critical genes based on clinical data. The expression of the selected critical genes was significantly different between the aSAH and control groups (Figure 7A). ANXA3, ACSL1, PGLYRP1, ALPL, ARG1, and TPST1 were obviously up regulated in patients with aSAH, whereas CD27 was down regulated, the results were consistent with our analysis. We also detected the gene expression in patients with aSAH at 3 days and 7 days after diagnosis. Interestingly, the expression levels of ALPL, ANAXA3, and ARG1 were reduced over time (Figure 7B).
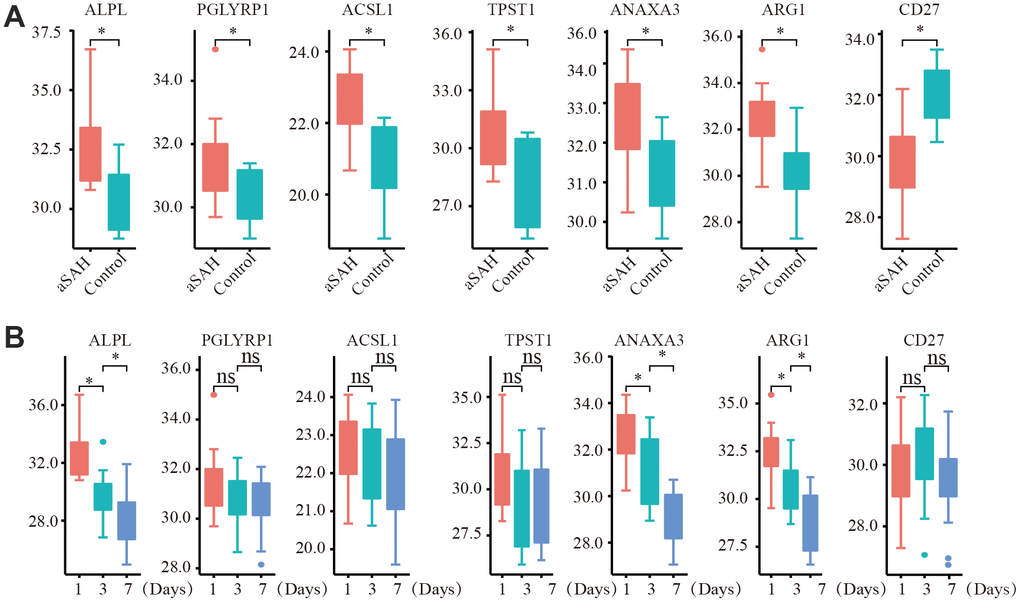
Figure 7. The expression of critical genes tested by qRT-PCR with clinical data. (A) ANXA3, ACSL1, PGLYRP1, ALPL, ARG1, TPST1 were obviously up regulated in aSAH patients, while CD27 was down regulated. (B) The expression of ALPL, ANAXA3, and ARG1 were obviously reduced over time. (*: p < 0.05).
Discussion
aSAH accounts for 75%-80% of all cases of SAH and is associated with a high mortality rate of approximately 40–50%, with a 30-day fatality rate of 36% [2, 4, 5]. The molecular mechanisms involved in the pathophysiology of aSAH remain unclear. Therefore, exploring susceptibility modules and genes for aSAH may contribute to the early diagnosis and treatment of SAH, thereby reducing mortality and serious adverse reactions.
In this study, four modules were found to be highly associated with aSAH, based on WGCNA. Additionally, 364 hub genes were identified. BP and KEGG enrichment analyses suggested that protein biosynthesis-related processes and inflammatory response-related processes were significantly involved in the pathology of aSAH. Among the hub genes, seven were found to be differentially expressed between aSAH and control groups and were identified as critical genes involved in the development of aSAH, with potential applications in the early prediction of aSAH. Finally, we validated our results using clinical data obtained from quantitative reverse transcription polymerase chain reaction (qRT-PCR).
Among the critical genes identified in this study, CD27, ANXA3, PGLYRP1, and ARG1 are closely associated with the immune system. CD27, a transmembrane glycoprotein, plays an important role in immune response and is expressed on most B lymphocytes cells, T lymphocytes cells, and natural killer (NK) cells [14, 15]. The expression of CD70, which is primarily controlled by antigen receptor and Toll-like receptor stimulation on T cells, B cells and dendritic cells is a key factor in determining the contribution of CD27 to the immune response [16]. CD27 binds to the receptor CD70, and plays important roles in regulation of the activation of T lymphocytes cell and the synthesis of immunoglobulin. In this study, CD27 was obviously down regulated in the aSAH group with that in the control group, suggesting that decreased CD27 transcription was related to B lymphocytes, T lymphocytes, and NK cells in patients with aSAH. This finding was consistent with the result from Joanna et al., who revealed that decreased CD27 mRNA expression was related to T lymphocytes in aSAH [17]. ANXA3, PGLYRP1, and ARG1 were all participated in the recognition of bacteria by neutrophils. ANXA3 is particularly abundant in neutrophils, accounting for approximately 1% of all cytosolic proteins [18] and contributing to neutrophil antimicrobial activity by promoting phagolysosome fusion [19]. PGLYRP1, which belongs to a family of PGN-binding proteins (PGRPs), highly conserved among insects and mammals, is an antibacterial protein found in neutrophil tertiary granules. PGRP1 plays critical roles in neutrophil production of reactive oxygen species and modulation of immune response [20, 21]. ARG1 is stored in granules of neutrophils. Once released and activated, ARG1 can degrade extra cellular arginine, resulting in inhibition of the activation and proliferation of T lymphocytes cells [22]. We found that ARG1 was significantly upregulated in the SAH group, suggesting that high expression of ARG1 may be related to decreased T lymphocytes activation and proliferation in patients with aSAH. Therefore, these results suggested that there was an abundance of transcripts related to monocytes and neutrophils with a simultaneous decrease in transcripts related to T lymphocytes in patients with aSAH.
ACSL1 is an enzyme that converts free long-chain fatty acids into fatty acyl-CoA esters, and thereby plays critical roles in both in lipid biosynthesis and fatty acid degradation [23]. Thus, disordered lipid metabolism may be involved in the development of aSAH. A previous study also demonstrated that related membrane lipid metabolism is altered in spastic basilar arteries after SAH [24]. Statins have been used and show significant benefits in models of traumatic brain injury and the related disease processes, including cerebral ischemia, intracerebral haemorrhage, and SAH [25]. The most compelling preclinical data has been obtained in experimental SAH, where statins have been shown to reduce vasospasm and improve outcomes after SAH in the animal experiments [26–28]. Similarly, statin treatment has been shown to improve outcomes in murine models of intracranial hemorrhage [29, 30] and acute ischemic stroke [31–33]. ALPL encodes tissue-nonspecific alkaline phosphatase (ALP), which has key roles in skeletal mineralization via the regulation of diphosphate levels. ALP can also promote vascular calcification by catalyzing the hydrolysis of organic pyrophosphate, an inhibitor of vascular calcification [34]. A number of studies have reported that a close relationship between serum ALP and increased morbidity and mortality in patients with cardiovascular diseases [35, 36]. Moreover, elevated serum ALP levels have been shown to be associated with increased mortality rates, poor functional outcomes, and disease recurrence in patients with stroke [37, 38]. Zhu et al. evaluated the association between the outcomes and serum ALPL level in 196 patients with aSAH and found that higher serum ALP levels are associated with an increased risk of vasospasm, delayed cerebral ischemia-induced clinical deterioration, and functional outcomes after aSAH [39]. Thus, ALPL may be a predictive biomarker for patients with aSAH.
TPST1, a type of homologous tyrosyl protein sulfotransferase (TPST) enzymes, plays a critical role in protein tyrosine sulfation for transfer of sulfate from the cofactor PAPS (3'-phosphoadenosine 5'-phosphosulfate) to a context-dependent tyrosine in a protein substrate [40]. To date, the functional importance of protein tyrosine sulfation is still unclear; however, this process has been shown to play a role in altering biological activities of proteins, modulating the proteolytic processing of bioactive peptides [41], influencing the half-life of proteins in circulation [42], and regulating extracellular protein-protein interactions, as observed for inflammatory leukocyte adhesion [43, 44]. The recent discovery of tyrosine sulfation of chemokine receptors suggests an even broader role in inflammatory responses [45, 46]. The role of TPST1 in aSAH is unknown, and further studies are needed to explore the potential mechanisms.
With the development of sequencing technology, genomics is playing an important role in disease diagnosis, mechanism research, drug development and treatment, especially in tumor diagnosis and treatment. Nowadays, sequencing technologies are increasingly used in clinical settings, and key genes may play an important role in the occurrence and development of a certain disease. Therefore, the expression of key genes can be used to determine the diagnosis of aneurysm, and the intervention of key genes can be used to treat aneurysm, thus preventing the occurrence of serious complications.
In conclusion, in this study, we found that protein biosynthesis-related processes and inflammatory responses related processes were involved in the pathology of aSAH. Additionally, we found that CD27, ANXA3, ACSL1, PGLYRP1, ALPL, ARG1, and TPST1 were significant potential biomarkers to guide the identification and treatment of aSAH. According to our PCR data, the levels of ALPL, ANAXA3, and ARG1 were reduced over time in patients with aSAH. However, further studies are needed to determine the relationships of these changes with the disease status. Moreover, our study lacked extensive clinical experimental verification of the identified genes. Thus, in future analyses, it will be necessary to verify our findings in clinical studies.
Materials and Methods
Microarray data processing
The GSE36791 gene expression matrix was retrieved and obtained from the Gene Expression Omnibus (GEO) (https://www.ncbi.nlm.nih.gov/geo/) by using the GEO query package in the R environment (Version 4.2.0) [47]. Gene expression data from peripheral blood samples were obtained from 43 patients with SAH caused by a ruptured intracranial aneurysm and 18 patients with headaches symptoms as the control group, the detail characteristics of all samples were displayed in Table 1 of the paper-Gene expression profiling of blood in ruptured intracranial aneurysms: in search of biomarkers [17]. The corresponding annotation file-GPL10558 matrix which includes more than 47,000 probes and targets to more than 31,000 annotated genes, was downloaded and applied to convert the probe into the target gene. If the target gene was annotated with two or more probes, the mean value was calculated for subsequent analysis. Among the targeted genes, the protein-coding genes were obtained by referring to the human genome assembly GRCh38. The matrix was normalized without transformation by using the Bead Array package [48]. In this analysis, the data were log2 transformed. The outlying microarray samples were identified with Euclidean distance-based sample network methods and a Z.ku cut-off of -5 was calculated as ku-mean(k) / sqrt(var[k]) [49].
Weighted gene co-expression network construction
WGCNA was performed to identify clusters that were highly correlated with all three phenotypes using the WGCNA package [49]. First, the soft threshold beta was chosen via scale free topology with the R function pickSoft Threshold. Second, we applied a power adjacent function to select adjacencies between all protein-coding genes and to transform data into a topological overlap matrix (TOM), and the corresponding dissimilarity (1-TOM) was evaluated. Third, the parameters of cutree Dynamic function were set as a minimum gene size of 30 and a medium sensitivity of 2 for branch splitting to calculate the average linkage hierarchical clustering tree. Finally, highly correlated modules were merged with a pairwise correlation coefficient higher than 0.8 for the identification of modules with very similar expression profiles depending on the clustering methods.
Identification of significant modules
To select modules that were significantly associated with aSAH, the associations between module eigengenes and aSAH were evaluated via Pearson correlation analysis. The modules with the P-value < 0.01 were considered to be significantly associated with aSAH. Since the module eigengene is an optimal summary of the gene expression profiles of a given module, it is natural to correlate eigengenes with these characteristics and to find the most important associations. To quantify the similarity of all genes on the array to the identified module. We quantify associations of individual genes with aSAH by defining GS as the absolute value of the correlation between the gene and the specific trait and by defining the quantitative measure of MM as the correlation of the module eigengene and the gene expression profile.
Identification of hub genes and functional enrichment analysis
In each significant module, hub genes were screened according to the following criterion, including the absolute value of the correlation between the aSAH and gene higher than 0.2 and the absolute value of the correlation of the module higher than 0.8 [50]. To explore the biological function of the hub genes, we performed Gene Ontology (GO) and KEGG enrichment analysis using Metascape (http://metascape.org/) [51]. The top 10 GO terms and KEGG terms were visualized with the ggplot2 package in the R programming language [52].
Identification of critical genes
In this analysis, the critical genes were identified based on two traits: significant differential expression between aSAH and control samples and high interconnections with genes in the module. Briefly, critical genes were defined as differentially expressed hub genes. The limma package [53] was applied to identify differential expressed genes (DEGs) between two groups in the expression data with the cut-off criteria |log2 fold change (FC)| ≥ 1 and adjust P value < 0.05 [54]. Then, the critical genes were screened and visualized with the Venn diagrams package [55]. The expression of critical genes was displayed and they were verified in another dataset. Additionally, ROC curves were plotted with the pROC package to verify the diagnostic performance of critical genes.
Validation of critical genes using qRT-PCR
Finally, we validated the obtained results from microarray data of peripheral blood samples by using qRT-PCR on samples from 25 patients with aSAH and 10 healthy controls recruited from the Department of Neurosurgery, Jinling Hospital, the First School of Clinical Medicine, Southern Medical University, China. Blood was collected from patients with aSAH at three time points: before therapy, 3 days after aSAH, and 7 days after aSAH, and that from the control samples was collected at the physical examination center. All samples were obtained in the fasting condition. The characteristics of the recruited patients are shown in Table 3. Whole blood samples were homogenized in TRIzol reagent (Servicebio, Wuhan, China). Total cellular RNA was then extracted and transcribed into cDNA using a Servicebio RT First-strand cDNA Synthesis Kit (Servicebio, Wuhan, China). qPCR was subsequently performed by using 2×SYBR Green qPCR Master Mix (Low ROX; Servicebio, Wuhan, China) with the CFX Real-time PCR system (Bio-Rad Laboratories, MN, USA). Table 4 lists all primer oligos, which were synthesized by Servicebio Biotechnology (Wuhan, China). The mRNA levels of glyceraldeyhyde 3-phosphate dehydrogenase (GAPDH) were used for normalization of mRNA expression (The average qRT-PCR values are shown in Supplementary Table 1). Subsequently, relative quantification was performed based on the comparative threshold cycle (2-ΔΔCT) method. The qPCR experiment of each clinical sample was repeated for 3 times, and the mean value were calculated for differential comparation. The differential gene expression between the two groups was analyzed using a non-parametric test, and P values less than 0.05 were considered statistically significant.
Table 3. The characteristics of recruited patients.
| Characteristics | aSAH | Control |
| Age | 64.62 ± 12.26 | 63.25 ± 13.54 |
| Male/Female | 14/11 | 6/4 |
| Hypertension | 72.00 % | 70.00% |
| Diabetes | 32.00% | 30.00% |
| Stroke (cerebral ischemia) | 30.00% | 20.00% |
Table 4. Primer sequences of critical genes used in this study.
| Critical genes | Direction | Primer sequences |
| ARG | Forward primer | TGGCAAGGTGATGGAAGAAAC |
| Reverse primer | TCCCGAGCAAGTCCGAAAC | |
| CD27 | Forward primer | CTGTCGGCACTGTAACTCTGGTC |
| Reverse primer | TCAGCGAAGGGTTTGGAAGAG | |
| ANXA3 | Forward primer | GCTGAAAGATGACTTGAAGGGTG |
| Reverse primer | CCTTCATTTGCCTGCTTGTCC | |
| ACSL1 | H-ACSL1-S | CCCATGAGCTGTTCCGGTATT |
| H-ACSL1-A | ACCCGCCACTTCCACTGACT | |
| PGLYRP1 | Forward primer | GAGCCTGCCCTTACGCTATGT |
| Reverse primer | ACGAGCCCGTCTTCTCCAAT | |
| ALPL | Forward primer | AAGGACGCTGGGAAATCTGTG |
| Reverse primer | CGTCAATGTCCCTGATGTTATGC | |
| TPST1 | Forward primer | CCAAGTAATCAAGCCAGTCAATG |
| Reverse primer | GTTGGAATTCTCCCTTATAGACCCT |
Data availability
The data used to support the findings of this study are from previously reported studies and datasets, which have been cited.
Supplementary Materials
Author Contributions
Zhizhong Yan and Qi Wu had accessed all data in the study and assume responsibility for the integrity of the data and accuracy of the data analysis. Xin Zhang and Handong Wang conceptualized and designed the study. Zhizhong Yan, Qi Wu, Wei Cai, Haitao Xiang, Lili Wen, An Zhang, Yaonan Peng drafted of the figures and manuscript. All authors critically revised the manuscript for important intellectual content.
Acknowledgments
The authors are grateful to the providers who submitted the data to the public databases.
Conflicts of Interest
The authors declare that they have no conflicts of interest.
Funding
This work was supported by the National Natural Science Foundation of China (No 82071328).
Editorial Note
This corresponding author has a verified history of publications using a personal email address for correspondence
References
- 1. Chen TF, Chen KW, Chien Y, Lai YH, Hsieh ST, Ma HY, Wang KC, Shiau CY. Dental Pulp Stem Cell-Derived Factors Alleviate Subarachnoid Hemorrhage-Induced Neuroinflammation and Ischemic Neurological Deficits. Int J Mol Sci. 2019; 20:3747. https://doi.org/10.3390/ijms20153747 [PubMed]
- 2. van Gijn J, Rinkel GJ. Subarachnoid haemorrhage: diagnosis, causes and management. Brain. 2001; 124:249–78. https://doi.org/10.1093/brain/124.2.249 [PubMed]
- 3. van Gijn J, Kerr RS, Rinkel GJ. Subarachnoid haemorrhage. Lancet. 2007; 369:306–18. https://doi.org/10.1016/S0140-6736(07)60153-6 [PubMed]
- 4. Sandvei MS, Mathiesen EB, Vatten LJ, Müller TB, Lindekleiv H, Ingebrigtsen T, Njølstad I, Wilsgaard T, Løchen ML, Vik A, Romundstad PR. Incidence and mortality of aneurysmal subarachnoid hemorrhage in two Norwegian cohorts, 1984-2007. Neurology. 2011; 77:1833–39. https://doi.org/10.1212/WNL.0b013e3182377de3 [PubMed]
- 5. Macdonald RL. Delayed neurological deterioration after subarachnoid haemorrhage. Nat Rev Neurol. 2014; 10:44–58. https://doi.org/10.1038/nrneurol.2013.246 [PubMed]
- 6. Petridis AK, Kamp MA, Cornelius JF, Beez T, Beseoglu K, Turowski B, Steiger HJ. Aneurysmal Subarachnoid Hemorrhage. Dtsch Arztebl Int. 2017; 114:226–36. https://doi.org/10.3238/arztebl.2017.0226 [PubMed]
- 7. Beck J, Raabe A, Szelenyi A, Berkefeld J, Gerlach R, Setzer M, Seifert V. Sentinel headache and the risk of rebleeding after aneurysmal subarachnoid hemorrhage. Stroke. 2006; 37:2733–37. https://doi.org/10.1161/01.STR.0000244762.51326.e7 [PubMed]
- 8. Ritz R, Reif J. Comparison of prognosis and complications after warning leaks in subarachnoidal hemorrhage--experience with 214 patients following aneurysm clipping. Neurol Res. 2005; 27:620–24. https://doi.org/10.1179/016164105X25199 [PubMed]
- 9. Verweij RD, Wijdicks EF, van Gijn J. Warning headache in aneurysmal subarachnoid hemorrhage. A case-control study. Arch Neurol. 1988; 45:1019–20. https://doi.org/10.1001/archneur.1988.00520330109018 [PubMed]
- 10. Ostergaard JR. Headache as a warning symptom of impending aneurysmal subarachnoid haemorrhage. Cephalalgia. 1991; 11:53–55. https://doi.org/10.1046/j.1468-2982.1991.1101053.x [PubMed]
- 11. Sheng B, Fang X, Liu C, Wu D, Xia D, Xu S, Lai N. Persistent High Levels of miR-502-5p Are Associated with Poor Neurologic Outcome in Patients with Aneurysmal Subarachnoid Hemorrhage. World Neurosurg. 2018; 116:e92–99. https://doi.org/10.1016/j.wneu.2018.04.088 [PubMed]
- 12. Dou Y, Shen H, Feng D, Li H, Tian X, Zhang J, Wang Z, Chen G. Tumor necrosis factor receptor-associated factor 6 participates in early brain injury after subarachnoid hemorrhage in rats through inhibiting autophagy and promoting oxidative stress. J Neurochem. 2017; 142:478–92. https://doi.org/10.1111/jnc.14075 [PubMed]
- 13. Helbok R, Schiefecker AJ, Beer R, Dietmann A, Antunes AP, Sohm F, Fischer M, Hackl WO, Rhomberg P, Lackner P, Pfausler B, Thomé C, Humpel C, Schmutzhard E. Early brain injury after aneurysmal subarachnoid hemorrhage: a multimodal neuromonitoring study. Crit Care. 2015; 19:75. https://doi.org/10.1186/s13054-015-0809-9 [PubMed]
- 14. Takeda K, Oshima H, Hayakawa Y, Akiba H, Atsuta M, Kobata T, Kobayashi K, Ito M, Yagita H, Okumura K. CD27-mediated activation of murine NK cells. J Immunol. 2000; 164:1741–45. https://doi.org/10.4049/jimmunol.164.4.1741 [PubMed]
- 15. Borst J, Hendriks J, Xiao Y. CD27 and CD70 in T cell and B cell activation. Curr Opin Immunol. 2005; 17:275–81. https://doi.org/10.1016/j.coi.2005.04.004 [PubMed]
- 16. Tesselaar K, Xiao Y, Arens R, van Schijndel GM, Schuurhuis DH, Mebius RE, Borst J, van Lier RA. Expression of the murine CD27 ligand CD70 in vitro and in vivo. J Immunol. 2003; 170:33–40. https://doi.org/10.4049/jimmunol.170.1.33 [PubMed]
- 17. Pera J, Korostynski M, Golda S, Piechota M, Dzbek J, Krzyszkowski T, Dziedzic T, Moskala M, Przewlocki R, Szczudlik A, Slowik A. Gene expression profiling of blood in ruptured intracranial aneurysms: in search of biomarkers. J Cereb Blood Flow Metab. 2013; 33:1025–31. https://doi.org/10.1038/jcbfm.2013.37 [PubMed]
- 18. Ernst JD, Hoye E, Blackwood RA, Jaye D. Purification and characterization of an abundant cytosolic protein from human neutrophils that promotes Ca2(+)-dependent aggregation of isolated specific granules. J Clin Invest. 1990; 85:1065–71. https://doi.org/10.1172/JCI114537 [PubMed]
- 19. Le Cabec V, Maridonneau-Parini I. Annexin 3 is associated with cytoplasmic granules in neutrophils and monocytes and translocates to the plasma membrane in activated cells. Biochem J. 1994; 303:481–87. https://doi.org/10.1042/bj3030481 [PubMed]
- 20. Park SY, Jing X, Gupta D, Dziarski R. Peptidoglycan recognition protein 1 enhances experimental asthma by promoting Th2 and Th17 and limiting regulatory T cell and plasmacytoid dendritic cell responses. J Immunol. 2013; 190:3480–92. https://doi.org/10.4049/jimmunol.1202675 [PubMed]
- 21. Dziarski R, Platt KA, Gelius E, Steiner H, Gupta D. Defect in neutrophil killing and increased susceptibility to infection with nonpathogenic gram-positive bacteria in peptidoglycan recognition protein-S (PGRP-S)-deficient mice. Blood. 2003; 102:689–97. https://doi.org/10.1182/blood-2002-12-3853 [PubMed]
- 22. Rodriguez PC, Quiceno DG, Ochoa AC. L-arginine availability regulates T-lymphocyte cell-cycle progression. Blood. 2007; 109:1568–73. https://doi.org/10.1182/blood-2006-06-031856 [PubMed]
- 23. Coleman RA, Lewin TM, Muoio DM. Physiological and nutritional regulation of enzymes of triacylglycerol synthesis. Annu Rev Nutr. 2000; 20:77–103. https://doi.org/10.1146/annurev.nutr.20.1.77 [PubMed]
- 24. Takuwa Y, Matsui T, Abe Y, Nagafuji T, Yamashita K, Asano T. Alterations in protein kinase C activity and membrane lipid metabolism in cerebral vasospasm after subarachnoid hemorrhage. J Cereb Blood Flow Metab. 1993; 13:409–15. https://doi.org/10.1038/jcbfm.1993.55 [PubMed]
- 25. Wible EF, Laskowitz DT. Statins in traumatic brain injury. Neurotherapeutics. 2010; 7:62–73. https://doi.org/10.1016/j.nurt.2009.11.003 [PubMed]
- 26. Bulsara KR, Coates JR, Agrawal VK, Eifler DM, Wagner-Mann CC, Durham HE, Fine DM, Toft K. Effect of combined simvastatin and cyclosporine compared with simvastatin alone on cerebral vasospasm after subarachnoid hemorrhage in a canine model. Neurosurg Focus. 2006; 21:E11. https://doi.org/10.3171/foc.2006.21.3.11 [PubMed]
- 27. McGirt MJ, Pradilla G, Legnani FG, Thai QA, Recinos PF, Tamargo RJ, Clatterbuck RE. Systemic administration of simvastatin after the onset of experimental subarachnoid hemorrhage attenuates cerebral vasospasm. Neurosurgery. 2006; 58:945–51. https://doi.org/10.1227/01.NEU.0000210262.67628.7E [PubMed]
- 28. McGirt MJ, Lynch JR, Parra A, Sheng H, Pearlstein RD, Laskowitz DT, Pelligrino DA, Warner DS. Simvastatin increases endothelial nitric oxide synthase and ameliorates cerebral vasospasm resulting from subarachnoid hemorrhage. Stroke. 2002; 33:2950–56. https://doi.org/10.1161/01.str.0000038986.68044.39 [PubMed]
- 29. Jung KH, Chu K, Jeong SW, Han SY, Lee ST, Kim JY, Kim M, Roh JK. HMG-CoA reductase inhibitor, atorvastatin, promotes sensorimotor recovery, suppressing acute inflammatory reaction after experimental intracerebral hemorrhage. Stroke. 2004; 35:1744–49. https://doi.org/10.1161/01.STR.0000131270.45822.85 [PubMed]
- 30. Seyfried D, Han Y, Lu D, Chen J, Bydon A, Chopp M. Improvement in neurological outcome after administration of atorvastatin following experimental intracerebral hemorrhage in rats. J Neurosurg. 2004; 101:104–07. https://doi.org/10.3171/jns.2004.101.1.0104 [PubMed]
- 31. Sironi L, Cimino M, Guerrini U, Calvio AM, Lodetti B, Asdente M, Balduini W, Paoletti R, Tremoli E. Treatment with statins after induction of focal ischemia in rats reduces the extent of brain damage. Arterioscler Thromb Vasc Biol. 2003; 23:322–27. https://doi.org/10.1161/01.atv.0000044458.23905.3b [PubMed]
- 32. Mayanagi K, Katakam PV, Gáspár T, Domoki F, Busija DW. Acute treatment with rosuvastatin protects insulin resistant (C57BL/6J ob/ob) mice against transient cerebral ischemia. J Cereb Blood Flow Metab. 2008; 28:1927–35. https://doi.org/10.1038/jcbfm.2008.81 [PubMed]
- 33. Prinz V, Laufs U, Gertz K, Kronenberg G, Balkaya M, Leithner C, Lindauer U, Endres M. Intravenous rosuvastatin for acute stroke treatment: an animal study. Stroke. 2008; 39:433–38. https://doi.org/10.1161/STROKEAHA.107.492470 [PubMed]
- 34. Harmey D, Hessle L, Narisawa S, Johnson KA, Terkeltaub R, Millán JL. Concerted regulation of inorganic pyrophosphate and osteopontin by akp2, enpp1, and ank: an integrated model of the pathogenesis of mineralization disorders. Am J Pathol. 2004; 164:1199–209. https://doi.org/10.1016/S0002-9440(10)63208-7 [PubMed]
- 35. Tonelli M, Curhan G, Pfeffer M, Sacks F, Thadhani R, Melamed ML, Wiebe N, Muntner P. Relation between alkaline phosphatase, serum phosphate, and all-cause or cardiovascular mortality. Circulation. 2009; 120:1784–92. https://doi.org/10.1161/CIRCULATIONAHA.109.851873 [PubMed]
- 36. Wannamethee SG, Sattar N, Papcosta O, Lennon L, Whincup PH. Alkaline phosphatase, serum phosphate, and incident cardiovascular disease and total mortality in older men. Arterioscler Thromb Vasc Biol. 2013; 33:1070–76. https://doi.org/10.1161/ATVBAHA.112.300826 [PubMed]
- 37. Ryu WS, Lee SH, Kim CK, Kim BJ, Yoon BW. Increased serum alkaline phosphatase as a predictor of long-term mortality after stroke. Neurology. 2010; 75:1995–2002. https://doi.org/10.1212/WNL.0b013e3181ff966a [PubMed]
- 38. Zhong C, You S, Chen J, Zhai G, Du H, Luo Y, Dong X, Cao Y, Liu CF, Zhang Y. Serum Alkaline Phosphatase, Phosphate, and In-Hospital Mortality in Acute Ischemic Stroke Patients. J Stroke Cerebrovasc Dis. 2018; 27:257–66. https://doi.org/10.1016/j.jstrokecerebrovasdis.2017.08.041 [PubMed]
- 39. Zhu Y, Jiang H, Li Y, Weng Y, Xu K, Zhou L, Lin H, Sun T, Cheng D, Shen J, Zeng J, Ye D, Wang D, Zhan R. Serum Alkaline Phosphatase Level is Associated with Angiographic Vasospasm, Delayed Cerebral Ischemia-Caused Clinical Deterioration, and Functional Outcome After Aneurysmal Subarachnoid Hemorrhage. Neurocrit Care. 2019; 31:466–75. https://doi.org/10.1007/s12028-019-00714-7 [PubMed]
- 40. Byrne DP, Li Y, Ngamlert P, Ramakrishnan K, Eyers CE, Wells C, Drewry DH, Zuercher WJ, Berry NG, Fernig DG, Eyers PA. New tools for evaluating protein tyrosine sulfation: tyrosylprotein sulfotransferases (TPSTs) are novel targets for RAF protein kinase inhibitors. Biochem J. 2018; 475:2435–55. https://doi.org/10.1042/BCJ20180266 [PubMed]
- 41. Gregory H, Hardy PM, Jones DS, Kenner GW, Sheppard RC. The antral Hormone Gastrin: Structure of Gastrin. Nature. 1964; 204:931–33. https://doi.org/10.1038/204931a0 [PubMed]
- 42. Leyte A, van Schijndel HB, Niehrs C, Huttner WB, Verbeet MP, Mertens K, van Mourik JA. Sulfation of Tyr1680 of human blood coagulation factor VIII is essential for the interaction of factor VIII with von Willebrand factor. J Biol Chem. 1991; 266:740–46. https://doi.org/10.1016/S0021-9258(17)35234-1 [PubMed]
- 43. Ippel JH, de Haas CJ, Bunschoten A, van Strijp JA, Kruijtzer JA, Liskamp RM, Kemmink J. Structure of the tyrosine-sulfated C5a receptor N terminus in complex with chemotaxis inhibitory protein of Staphylococcus aureus. J Biol Chem. 2009; 284:12363–72. https://doi.org/10.1074/jbc.M808179200 [PubMed]
- 44. Pouyani T, Seed B. PSGL-1 recognition of P-selectin is controlled by a tyrosine sulfation consensus at the PSGL-1 amino terminus. Cell. 1995; 83:333–43. https://doi.org/10.1016/0092-8674(95)90174-4 [PubMed]
- 45. Veldkamp CT, Seibert C, Peterson FC, De la Cruz NB, Haugner JC 3rd, Basnet H, Sakmar TP, Volkman BF. Structural basis of CXCR4 sulfotyrosine recognition by the chemokine SDF-1/CXCL12. Sci Signal. 2008; 1:ra4. https://doi.org/10.1126/scisignal.1160755 [PubMed]
- 46. Choe H, Farzan M. Chapter 7. Tyrosine sulfation of HIV-1 coreceptors and other chemokine receptors. Methods Enzymol. 2009; 461:147–70. https://doi.org/10.1016/S0076-6879(09)05407-X [PubMed]
- 47. Davis S, Meltzer PS. GEOquery: a bridge between the Gene Expression Omnibus (GEO) and BioConductor. Bioinformatics. 2007; 23:1846–47. https://doi.org/10.1093/bioinformatics/btm254 [PubMed]
- 48. Dunning MJ, Smith ML, Ritchie ME, Tavaré S. beadarray: R classes and methods for Illumina bead-based data. Bioinformatics. 2007; 23:2183–84. https://doi.org/10.1093/bioinformatics/btm311 [PubMed]
- 49. Langfelder P, Horvath S. WGCNA: an R package for weighted correlation network analysis. BMC Bioinformatics. 2008; 9:559. https://doi.org/10.1186/1471-2105-9-559 [PubMed]
- 50. Yuan L, Chen L, Qian K, Qian G, Wu CL, Wang X, Xiao Y. Co-expression network analysis identified six hub genes in association with progression and prognosis in human clear cell renal cell carcinoma (ccRCC). Genom Data. 2017; 14:132–40. https://doi.org/10.1016/j.gdata.2017.10.006 [PubMed]
- 51. Zhou Y, Zhou B, Pache L, Chang M, Khodabakhshi AH, Tanaseichuk O, Benner C, Chanda SK. Metascape provides a biologist-oriented resource for the analysis of systems-level datasets. Nat Commun. 2019; 10:1523. https://doi.org/10.1038/s41467-019-09234-6 [PubMed]
- 52. Maag JL. gganatogram: An R package for modular visualisation of anatograms and tissues based on ggplot2. F1000Res. 2018; 7:1576. https://doi.org/10.12688/f1000research.16409.2 [PubMed]
- 53. Ritchie ME, Phipson B, Wu D, Hu Y, Law CW, Shi W, Smyth GK. limma powers differential expression analyses for RNA-sequencing and microarray studies. Nucleic Acids Res. 2015; 43:e47. https://doi.org/10.1093/nar/gkv007 [PubMed]
- 54. Zhang H, Zhong J, Tu Y, Liu B, Chen Z, Luo Y, Tang Y, Xiao F, Zhong J. Integrated Bioinformatics Analysis Identifies Hub Genes Associated with the Pathogenesis and Prognosis of Esophageal Squamous Cell Carcinoma. Biomed Res Int. 2019; 2019:2615921. https://doi.org/10.1155/2019/2615921 [PubMed]
- 55. Chen H, Boutros PC. VennDiagram: a package for the generation of highly-customizable Venn and Euler diagrams in R. BMC Bioinformatics. 2011; 12:35. https://doi.org/10.1186/1471-2105-12-35 [PubMed]