


Introduction
Lung cancer is malignant with high incidence and mortality all over the world [1, 2]. The 5-year survival rate of lung cancer is 4–17% based on different stages when diagnosed [3]. Lung adenocarcinoma (LUAD) is the most common type of lung cancer in histology [1, 2].
The pathogenesis of LUAD is complicated [4]. In addition to genetic factors, the main risk factors are smoking, asbestos, radon and other environmental factors [5]. Although the targeting and immunotherapy of LUAD have made great progresses in recent years, its prognosis is still poor [6]. The main reason is the polymer heterogeneity of lung cancer [7]. Since the current diagnostic methods relying on low-dose CT scans and classic serum tumor markers are limited and not specific, LUAD is usually at an advanced stage when diagnosed [8, 9]. Therefore, it is greatly significant to carry out more in-depth explorations of LUAD, and to find new biomarkers related to its diagnosis and prognosis.
Metastatic progression is one of the biggest challenges, which limits the effect of cancer therapies. Proteolysis is involved in the invasion by cleavage of proteins that mediate adherence to neighboring cells. Cathepsins are a family of lysosomal proteases involved in proliferation, invasion and metastasis of different kinds of cancers [10]. The human cysteine cathepsin family is comprised of eleven members including Cat B, C, F, H, L, K, O, S, V, W, and X/Z, which shares a conserved active site. CTSL2 gene encodes cathepsin like 2 (cathepsin L2, also known as cathepsin V) [11]. CTSL2 is a lysosomal cysteine protease, and may be associated with tumor metastasis [10, 12]. Overexpression of CTSL2 has been found in various human cancers, including breast cancer, squamous cell carcinoma, thymic carcinoma, et al. [13–15]. Besides, CTSL2 is regarded as a potential drug target [16]. These findings indicate that CTSL2 may be a biomarker for cancer diagnosis and prognosis. Therefore, we focus on the role of CTSL2 in LUAD.
In this study, bioinformatics analysis of CTSL2 in LUAD was performed. The association between CTSL2 expression and clinical features in LUAD was studied. CTSL2 expression in the overall survival and on the risk of LUAD was illustrated. Furthermore, in vitro cell experiments of CTSL2 expression on cell proliferation and migration of LUAD cells were carried out. CTSL2 is found to have predictive value, and high CTSL2 expression is in association with poor prognosis of LUAD.
Results
Characteristics of patients with lung cancer
Totally, 517 LUAD patients were involved, including 277 (53.58%) females, and 240 (46.42%) males (Table 1). As for LUAD stage, there were 277 (53.58%) in I, 122 (23.60%) in II, 84 (16.25%) in III, and 26 (5.03%) in IV. Moreover, the T2 (53.77%), N0 (64.41%), and M0 (67.12%) showed the highest percentage. It can be seen that 99.61% were primary lung cancer.
Table 1. Clinical characteristics of the lung adenocarcinoma patients.
| Characteristics | N (%) | ||||||||||||||||||||||||||||||||||||||||||||||||||||||||||||||||||||||||||||||||||||||||||||||||||
| Age (years) | |||||||||||||||||||||||||||||||||||||||||||||||||||||||||||||||||||||||||||||||||||||||||||||||||||
| <55 | 71 (13.73) | ||||||||||||||||||||||||||||||||||||||||||||||||||||||||||||||||||||||||||||||||||||||||||||||||||
| > = 55 | 427 (82.59) | ||||||||||||||||||||||||||||||||||||||||||||||||||||||||||||||||||||||||||||||||||||||||||||||||||
| NA | 19 (3.68) | ||||||||||||||||||||||||||||||||||||||||||||||||||||||||||||||||||||||||||||||||||||||||||||||||||
| Gender | |||||||||||||||||||||||||||||||||||||||||||||||||||||||||||||||||||||||||||||||||||||||||||||||||||
| Female | 277 (53.58) | ||||||||||||||||||||||||||||||||||||||||||||||||||||||||||||||||||||||||||||||||||||||||||||||||||
| Male | 240 (46.42) | ||||||||||||||||||||||||||||||||||||||||||||||||||||||||||||||||||||||||||||||||||||||||||||||||||
| Stage | |||||||||||||||||||||||||||||||||||||||||||||||||||||||||||||||||||||||||||||||||||||||||||||||||||
| I | 277 (53.58) | ||||||||||||||||||||||||||||||||||||||||||||||||||||||||||||||||||||||||||||||||||||||||||||||||||
| II | 122 (23.60) | ||||||||||||||||||||||||||||||||||||||||||||||||||||||||||||||||||||||||||||||||||||||||||||||||||
| III | 84 (16.25) | ||||||||||||||||||||||||||||||||||||||||||||||||||||||||||||||||||||||||||||||||||||||||||||||||||
| IV | 26 (5.03) | ||||||||||||||||||||||||||||||||||||||||||||||||||||||||||||||||||||||||||||||||||||||||||||||||||
| NA | 8 (1.55) | ||||||||||||||||||||||||||||||||||||||||||||||||||||||||||||||||||||||||||||||||||||||||||||||||||
| T classification | |||||||||||||||||||||||||||||||||||||||||||||||||||||||||||||||||||||||||||||||||||||||||||||||||||
| T1 | 170 (32.88) | ||||||||||||||||||||||||||||||||||||||||||||||||||||||||||||||||||||||||||||||||||||||||||||||||||
| T2 | 278 (53.77) | ||||||||||||||||||||||||||||||||||||||||||||||||||||||||||||||||||||||||||||||||||||||||||||||||||
| T3 | 47 (9.09) | ||||||||||||||||||||||||||||||||||||||||||||||||||||||||||||||||||||||||||||||||||||||||||||||||||
| T4 | 19 (3.68) | ||||||||||||||||||||||||||||||||||||||||||||||||||||||||||||||||||||||||||||||||||||||||||||||||||
| TX | 3 (0.58) | ||||||||||||||||||||||||||||||||||||||||||||||||||||||||||||||||||||||||||||||||||||||||||||||||||
| N classification | |||||||||||||||||||||||||||||||||||||||||||||||||||||||||||||||||||||||||||||||||||||||||||||||||||
| N0 | 333 (64.41) | ||||||||||||||||||||||||||||||||||||||||||||||||||||||||||||||||||||||||||||||||||||||||||||||||||
| N1 | 96 (18.57) | ||||||||||||||||||||||||||||||||||||||||||||||||||||||||||||||||||||||||||||||||||||||||||||||||||
| N2 | 74 (14.31) | ||||||||||||||||||||||||||||||||||||||||||||||||||||||||||||||||||||||||||||||||||||||||||||||||||
| N3 | 2 (0.39) | ||||||||||||||||||||||||||||||||||||||||||||||||||||||||||||||||||||||||||||||||||||||||||||||||||
| NX | 11 (2.13) | ||||||||||||||||||||||||||||||||||||||||||||||||||||||||||||||||||||||||||||||||||||||||||||||||||
| NA | 1 (0.19) | ||||||||||||||||||||||||||||||||||||||||||||||||||||||||||||||||||||||||||||||||||||||||||||||||||
| M classification | |||||||||||||||||||||||||||||||||||||||||||||||||||||||||||||||||||||||||||||||||||||||||||||||||||
| M0 | 347 (67.12) | ||||||||||||||||||||||||||||||||||||||||||||||||||||||||||||||||||||||||||||||||||||||||||||||||||
| M1 | 25 (4.84) | ||||||||||||||||||||||||||||||||||||||||||||||||||||||||||||||||||||||||||||||||||||||||||||||||||
| MX | 141 (27.27) | ||||||||||||||||||||||||||||||||||||||||||||||||||||||||||||||||||||||||||||||||||||||||||||||||||
| NA | 4 (0.77) | ||||||||||||||||||||||||||||||||||||||||||||||||||||||||||||||||||||||||||||||||||||||||||||||||||
| Radiation therapy | |||||||||||||||||||||||||||||||||||||||||||||||||||||||||||||||||||||||||||||||||||||||||||||||||||
| No | 400 (77.37) | ||||||||||||||||||||||||||||||||||||||||||||||||||||||||||||||||||||||||||||||||||||||||||||||||||
| Yes | 60 (11.61) | ||||||||||||||||||||||||||||||||||||||||||||||||||||||||||||||||||||||||||||||||||||||||||||||||||
| NA | 57 (11.03) | ||||||||||||||||||||||||||||||||||||||||||||||||||||||||||||||||||||||||||||||||||||||||||||||||||
| Residual tumor | |||||||||||||||||||||||||||||||||||||||||||||||||||||||||||||||||||||||||||||||||||||||||||||||||||
| R0 | 345 (66.73) | ||||||||||||||||||||||||||||||||||||||||||||||||||||||||||||||||||||||||||||||||||||||||||||||||||
| R1 | 13 (2.51) | ||||||||||||||||||||||||||||||||||||||||||||||||||||||||||||||||||||||||||||||||||||||||||||||||||
| R2 | 4 (0.77) | ||||||||||||||||||||||||||||||||||||||||||||||||||||||||||||||||||||||||||||||||||||||||||||||||||
| RX | 25 (4.84) | ||||||||||||||||||||||||||||||||||||||||||||||||||||||||||||||||||||||||||||||||||||||||||||||||||
| NA | 130 (25.15) | ||||||||||||||||||||||||||||||||||||||||||||||||||||||||||||||||||||||||||||||||||||||||||||||||||
| Vital status | |||||||||||||||||||||||||||||||||||||||||||||||||||||||||||||||||||||||||||||||||||||||||||||||||||
| Deceased | 187 (36.17) | ||||||||||||||||||||||||||||||||||||||||||||||||||||||||||||||||||||||||||||||||||||||||||||||||||
| Living | 330 (63.83) | ||||||||||||||||||||||||||||||||||||||||||||||||||||||||||||||||||||||||||||||||||||||||||||||||||
| Sample type | |||||||||||||||||||||||||||||||||||||||||||||||||||||||||||||||||||||||||||||||||||||||||||||||||||
| Primary tumor | 515 (99.61) | ||||||||||||||||||||||||||||||||||||||||||||||||||||||||||||||||||||||||||||||||||||||||||||||||||
| Recurrent tumor | 2 (0.39) | ||||||||||||||||||||||||||||||||||||||||||||||||||||||||||||||||||||||||||||||||||||||||||||||||||
| Abbreviations: NA: not available; X represents uncertain. | |||||||||||||||||||||||||||||||||||||||||||||||||||||||||||||||||||||||||||||||||||||||||||||||||||
High CTSL2 expression in LUAD
The expression of CTSL2 in lung adenocarcinoma and normal lung tissues were compared (Figure 1A). The tumor CTSL2 level was significantly increased (P < 0.001) in comparison with normal tissue. The comparison of tumor and paired normal tissue further verified the high CTSL2 expression in LUAD (P < 0.001; Figure 1B).
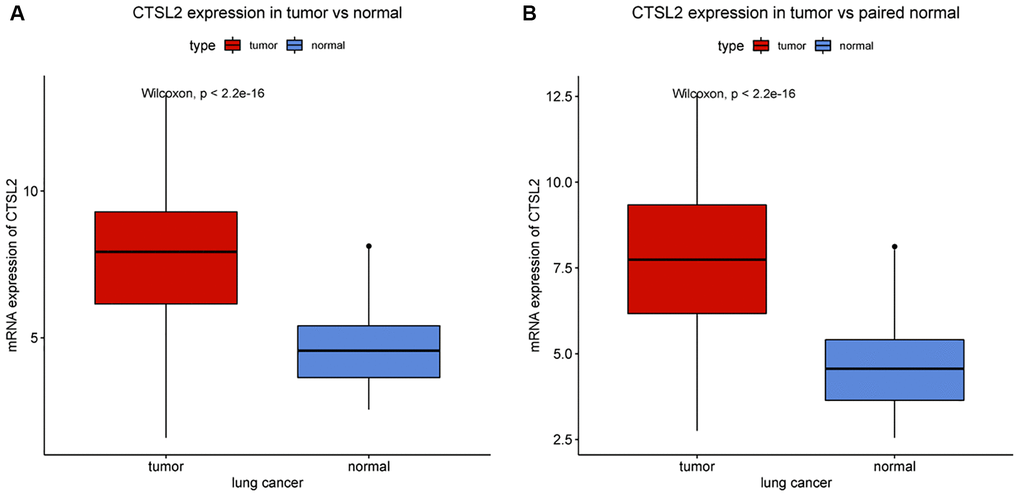
Figure 1. CTSL2 expression in lung adenocarcinoma tissues. (A) CTSL2 expression in normal and tumor tissues. (B) CTSL2 expression in paired tissues.
Correlation between CTSL2 expression and clinical characteristics
As shown in Table 2 and Figure 2, high CTSL2 expression was significantly associated with age (P = 0.02), vital status (P < 0.001), and T classification (P = 0.03). Meanwhile, gender, stage, N and M classification, and residual tumor showed no significant differences.
Table 2. Logistic analysis of the association between CTSL2 expression and clinical characteristics.
| Characteristics | Total | High | Low | χ2 | P | ||||||||||||||||||||||||||||||||||||||||||||||||||||||||||||||||||||||||||||||||||||||||||||||
| Age | <55 | 71 | 42 (17.65) | 29 (11.15) | 3.771 | 0.052 | |||||||||||||||||||||||||||||||||||||||||||||||||||||||||||||||||||||||||||||||||||||||||||||
| > = 55 | 427 | 196 (82.35) | 231 (88.85) | ||||||||||||||||||||||||||||||||||||||||||||||||||||||||||||||||||||||||||||||||||||||||||||||||
| Gender | Female | 277 | 123 (50.2) | 154 (56.62) | 1.882 | 0.170 | |||||||||||||||||||||||||||||||||||||||||||||||||||||||||||||||||||||||||||||||||||||||||||||
| Male | 240 | 122 (49.8) | 118 (43.38) | ||||||||||||||||||||||||||||||||||||||||||||||||||||||||||||||||||||||||||||||||||||||||||||||||
| Stage | I | 277 | 123 (50.62) | 154 (57.89) | 2.778 | 0.423 | |||||||||||||||||||||||||||||||||||||||||||||||||||||||||||||||||||||||||||||||||||||||||||||
| II | 122 | 64 (26.34) | 58 (21.8) | ||||||||||||||||||||||||||||||||||||||||||||||||||||||||||||||||||||||||||||||||||||||||||||||||
| III | 84 | 43 (17.7) | 41 (15.41) | ||||||||||||||||||||||||||||||||||||||||||||||||||||||||||||||||||||||||||||||||||||||||||||||||
| IV | 26 | 13 (5.35) | 13 (4.89) | ||||||||||||||||||||||||||||||||||||||||||||||||||||||||||||||||||||||||||||||||||||||||||||||||
| T classification | T1 | 170 | 67 (27.35) | 103 (37.87) | 11.503 | 0.019 | |||||||||||||||||||||||||||||||||||||||||||||||||||||||||||||||||||||||||||||||||||||||||||||
| T2 | 278 | 147 (60) | 131 (48.16) | ||||||||||||||||||||||||||||||||||||||||||||||||||||||||||||||||||||||||||||||||||||||||||||||||
| T3 | 47 | 24 (9.8) | 23 (8.46) | ||||||||||||||||||||||||||||||||||||||||||||||||||||||||||||||||||||||||||||||||||||||||||||||||
| T4 | 19 | 7 (2.86) | 12 (4.41) | ||||||||||||||||||||||||||||||||||||||||||||||||||||||||||||||||||||||||||||||||||||||||||||||||
| TX | 3 | 0 (0) | 3 (1.1) | ||||||||||||||||||||||||||||||||||||||||||||||||||||||||||||||||||||||||||||||||||||||||||||||||
| N classification | N0 | 333 | 149 (60.82) | 184 (67.9) | 10.893 | 0.023 | |||||||||||||||||||||||||||||||||||||||||||||||||||||||||||||||||||||||||||||||||||||||||||||
| N1 | 96 | 55 (22.45) | 41 (15.13) | ||||||||||||||||||||||||||||||||||||||||||||||||||||||||||||||||||||||||||||||||||||||||||||||||
| N2 | 74 | 37 (15.1) | 37 (13.65) | ||||||||||||||||||||||||||||||||||||||||||||||||||||||||||||||||||||||||||||||||||||||||||||||||
| N3 | 2 | 2 (0.82) | 0 (0) | ||||||||||||||||||||||||||||||||||||||||||||||||||||||||||||||||||||||||||||||||||||||||||||||||
| NX | 11 | 2 (0.82) | 9 (3.32) | ||||||||||||||||||||||||||||||||||||||||||||||||||||||||||||||||||||||||||||||||||||||||||||||||
| M classification | M0 | 347 | 164 (67.21) | 183 (68.03) | 0.210 | 0.902 | |||||||||||||||||||||||||||||||||||||||||||||||||||||||||||||||||||||||||||||||||||||||||||||
| M1 | 25 | 13 (5.33) | 12 (4.46) | ||||||||||||||||||||||||||||||||||||||||||||||||||||||||||||||||||||||||||||||||||||||||||||||||
| MX | 141 | 67 (27.46) | 74 (27.51) | ||||||||||||||||||||||||||||||||||||||||||||||||||||||||||||||||||||||||||||||||||||||||||||||||
| Radiation therapy | No | 400 | 179 (84.83) | 221 (88.76) | 1.222 | 0.269 | |||||||||||||||||||||||||||||||||||||||||||||||||||||||||||||||||||||||||||||||||||||||||||||
| Yes | 60 | 32 (15.17) | 28 (11.24) | ||||||||||||||||||||||||||||||||||||||||||||||||||||||||||||||||||||||||||||||||||||||||||||||||
| Residual tumor | R0 | 345 | 173 (89.18) | 172 (89.12) | 1.733 | 0.677 | |||||||||||||||||||||||||||||||||||||||||||||||||||||||||||||||||||||||||||||||||||||||||||||
| R1 | 13 | 5 (2.58) | 8 (4.15) | ||||||||||||||||||||||||||||||||||||||||||||||||||||||||||||||||||||||||||||||||||||||||||||||||
| R2 | 4 | 3 (1.55) | 1 (0.52) | ||||||||||||||||||||||||||||||||||||||||||||||||||||||||||||||||||||||||||||||||||||||||||||||||
| RX | 25 | 13 (6.7) | 12 (6.22) | ||||||||||||||||||||||||||||||||||||||||||||||||||||||||||||||||||||||||||||||||||||||||||||||||
| Vital status | Deceased | 187 | 107 (43.67) | 80 (29.41) | 10.746 | 0.001 | |||||||||||||||||||||||||||||||||||||||||||||||||||||||||||||||||||||||||||||||||||||||||||||
| Living | 330 | 138 (56.33) | 192 (70.59) | ||||||||||||||||||||||||||||||||||||||||||||||||||||||||||||||||||||||||||||||||||||||||||||||||
| Sample type | Primary tumor | 515 | 243 (99.18) | 272 (100) | 0.614 | 0.433 | |||||||||||||||||||||||||||||||||||||||||||||||||||||||||||||||||||||||||||||||||||||||||||||
| Recurrent tumor | 2 | 2 (0.82) | 0 (0) | ||||||||||||||||||||||||||||||||||||||||||||||||||||||||||||||||||||||||||||||||||||||||||||||||
| X represents uncertain. | |||||||||||||||||||||||||||||||||||||||||||||||||||||||||||||||||||||||||||||||||||||||||||||||||||
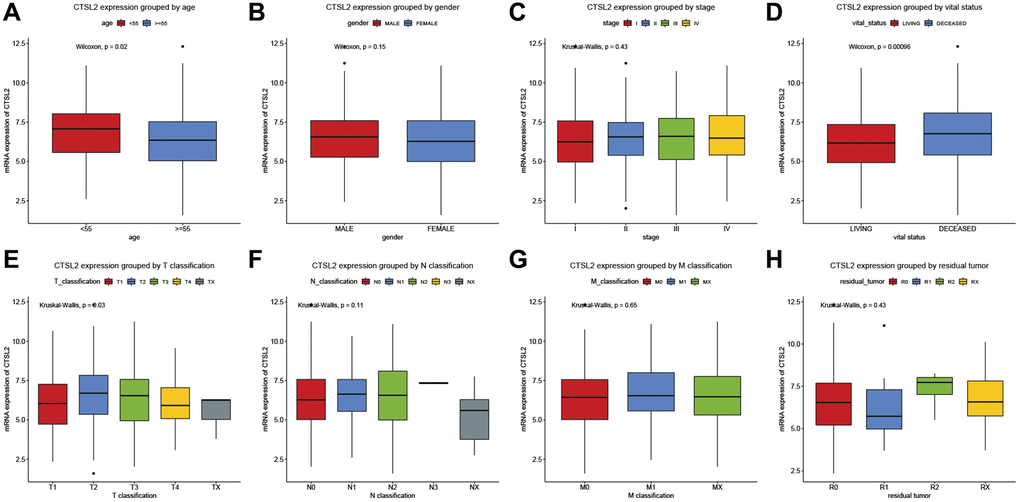
Figure 2. CTSL2 expression of patients with lung adenocarcinoma grouped by (A) age, (B) gender, (C) stage, (D) vital status, (E) T classification, (F) N classification, (G) M classification, and (H) residual tumor.
High CTSL2 expression is an independent risk factor for overall survival
As shown in Figure 3A, high expression of CTSL2 was associated with poor prognosis (P = 0.0011). The subgroup analysis (Figure 3B–3P) showed that high expression of CTSL2 was significantly associated with poor prognosis in stage I (P = 0.025), N0 (P = 0.015), and M0 (P = 0.0065). As shown in Table 3, the high expression of CTSL2 was significantly correlated with poor overall survival (HR = 1.62, 95% CI = 1.21–2.18, P = 0.001). As shown in Table 3 and Figure 4, high CTSL2 expression was confirmed to be an independent risk factor for overall survival (HR = 1.52, 95% CI = 1.12–2.05, P = 0.006).
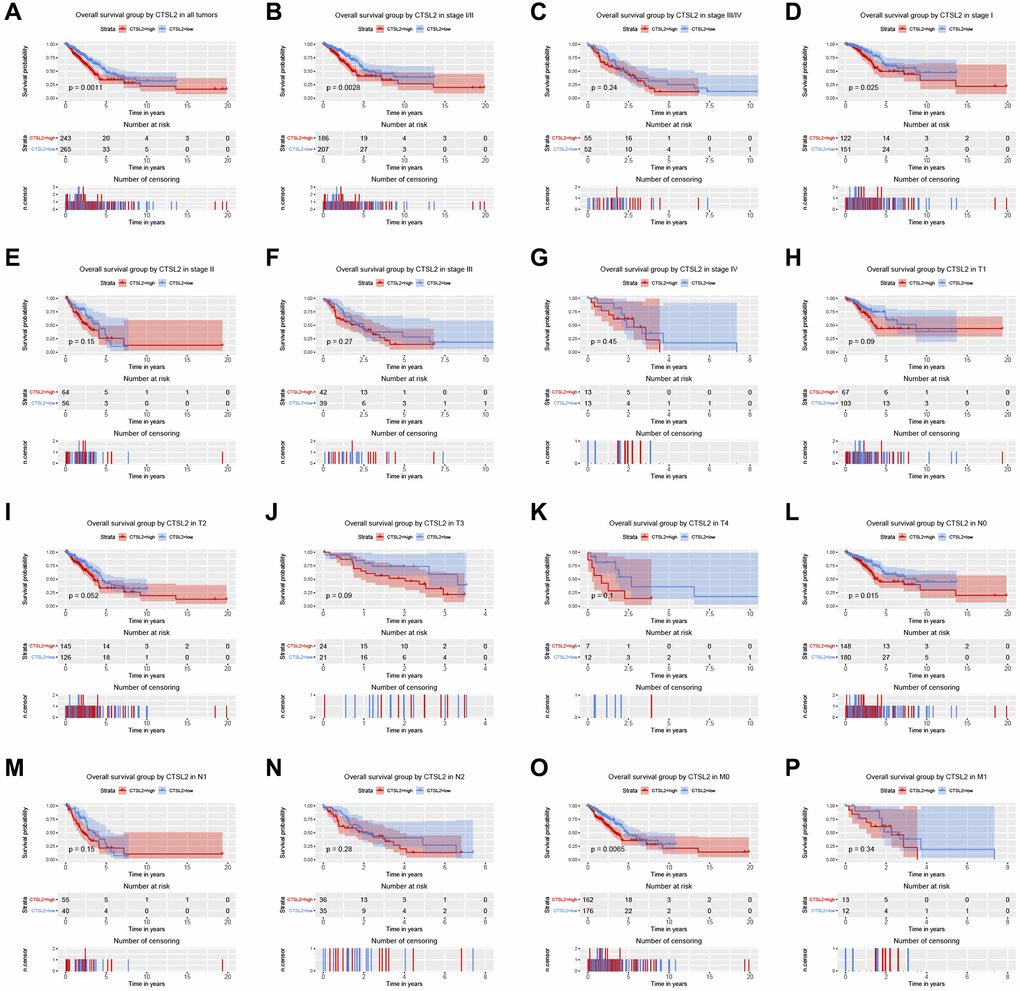
Figure 3. Kaplan-Meier curve for overall survival in lung adenocarcinoma. (A) CTSL2 in all tumors; (B–G) Subgroup analysis for stage I/II, III/IV, I, II, III, and IV; (H–P) Subgroup analysis for T1, T2, T3, T4, N0, N1, N2, M0, and M1.
Table 3. Univariate and multivariate Cox regression analyses of clinical characteristics associated with overall survival.
| Characteristics | Univariate analysis | Multivariate analysis | |||||||||||||||||||||||||||||||||||||||||||||||||||||||||||||||||||||||||||||||||||||||||||||||||
| HR | 95% CI | P | HR | 95% CI | P | ||||||||||||||||||||||||||||||||||||||||||||||||||||||||||||||||||||||||||||||||||||||||||||||
| Age | 0.82 | 0.55–1.22 | 0.322 | ||||||||||||||||||||||||||||||||||||||||||||||||||||||||||||||||||||||||||||||||||||||||||||||||
| Gender | 1.05 | 0.78–1.40 | 0.760 | ||||||||||||||||||||||||||||||||||||||||||||||||||||||||||||||||||||||||||||||||||||||||||||||||
| Stage | 1.68 | 1.47–1.93 | <0.001 | 1.54 | 1.24–1.92 | <0.001 | |||||||||||||||||||||||||||||||||||||||||||||||||||||||||||||||||||||||||||||||||||||||||||||
| T classification | 1.52 | 1.26–1.82 | <0.001 | 1.20 | 0.99–1.45 | 0.064 | |||||||||||||||||||||||||||||||||||||||||||||||||||||||||||||||||||||||||||||||||||||||||||||
| N classification | 1.67 | 1.41–1.97 | <0.001 | 1.11 | 0.89–1.40 | 0.357 | |||||||||||||||||||||||||||||||||||||||||||||||||||||||||||||||||||||||||||||||||||||||||||||
| M classification | 1.40 | 1.04–1.90 | 0.029 | 0.92 | 0.67–1.26 | 0.611 | |||||||||||||||||||||||||||||||||||||||||||||||||||||||||||||||||||||||||||||||||||||||||||||
| Radiation therapy | 1.25 | 0.89–1.75 | 0.199 | ||||||||||||||||||||||||||||||||||||||||||||||||||||||||||||||||||||||||||||||||||||||||||||||||
| Residual tumor | 1.20 | 1.01–1.42 | 0.037 | 1.10 | 0.92–1.30 | 0.310 | |||||||||||||||||||||||||||||||||||||||||||||||||||||||||||||||||||||||||||||||||||||||||||||
| CTSL2 expression | 1.62 | 1.21–2.18 | 0.001 | 1.52 | 1.12–2.05 | 0.006 | |||||||||||||||||||||||||||||||||||||||||||||||||||||||||||||||||||||||||||||||||||||||||||||
| Abbreviations: HR: hazard ratio; CI: confidence interval. | |||||||||||||||||||||||||||||||||||||||||||||||||||||||||||||||||||||||||||||||||||||||||||||||||||
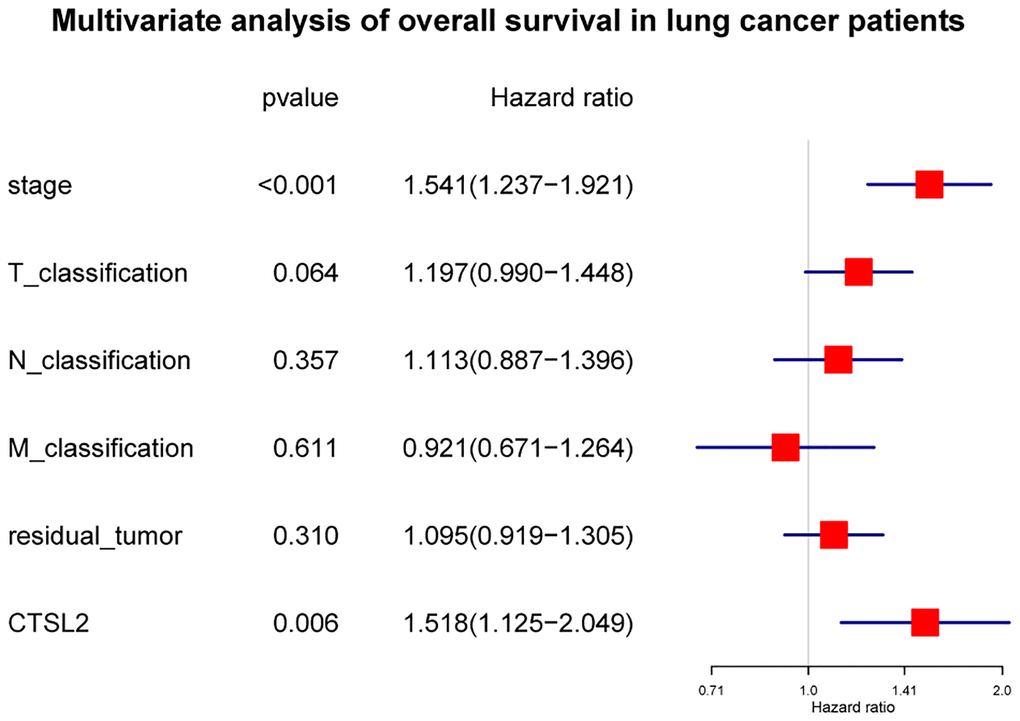
Figure 4. Forest plot of the multivariate Cox regression analysis in lung adenocarcinoma.
Diagnostic value of CTSL2 for LUAD
The ROC curves were drawn to examine the diagnostic value of for LUAD. The area was 0.881, indicating a modest diagnostic value of CTSL2 expression (Figure 5A). As shown in Figure 5B–5E, the AUC values were 0.763 for stage I, 0.827 for stage II, 0.816 for stage III, and 0.771 for stage IV, respectively. Furthermore, a nomogram model was established for predicting the survival probability of LUAD patients in different years, which involved stage and CTSL2 expression (Figure 6). To evaluate the discrimination and performance of the model, DCA, calibration, and ROC curves were plotted, indicating that the nomogram was stable in predicting the prognosis of LUAD patients (Supplementary Figure 1).
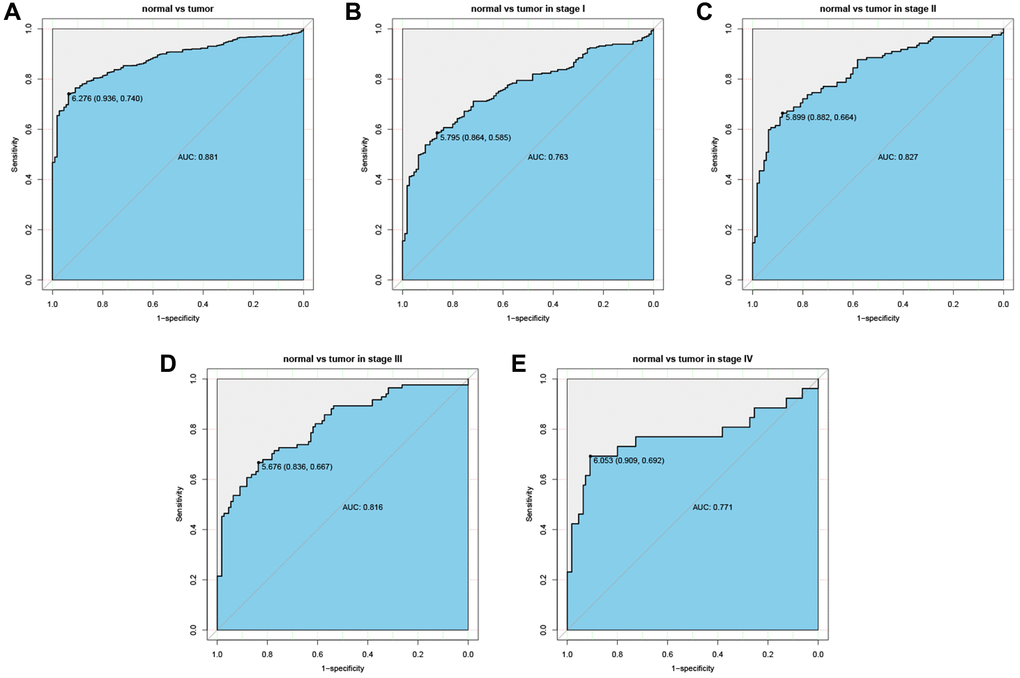
Figure 5. Diagnostic value of CTSL2 expression in lung adenocarcinoma. (A) ROC curve for CTSL2 in normal lung tissue and tumor; (B–E) Subgroup analysis for stage I, II, III, and IV.
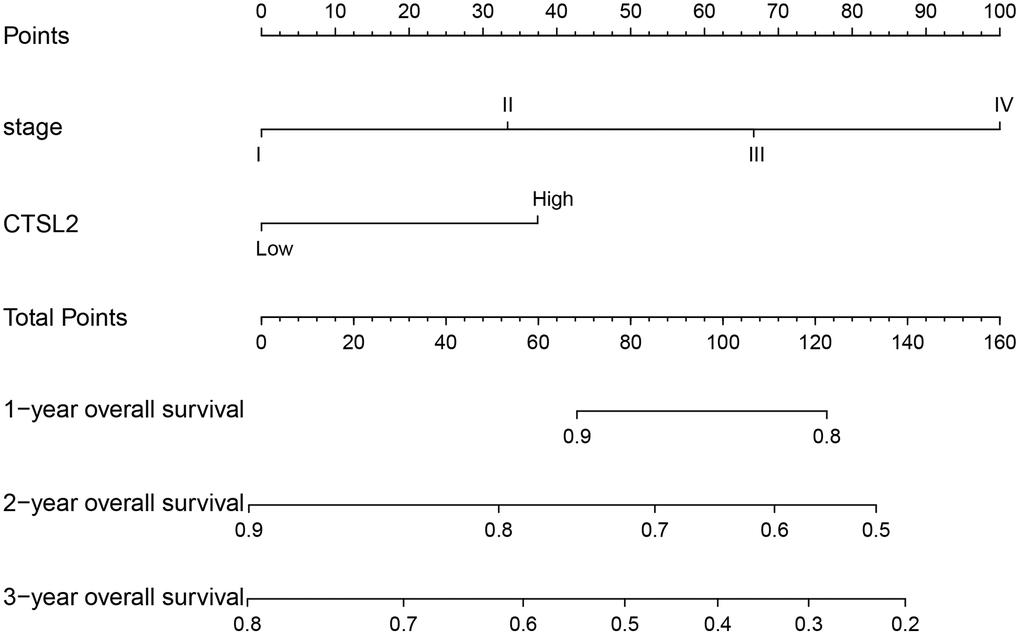
Figure 6. Nomogram for predicting probability of patients with 1-, 2- and 3-year overall survival. 1-, 3- and 5-year related survival probabilities were obtained by draw a line straight down to the Risk axis.
CTSL2-related signaling pathways by GSEA
The gene set enrichment analysis (GSEA) was carried out to identify differentially activated signaling pathways in low and high expression of CTSL2. As shown in Table 4, the significant gene sets enriched in the high CTSL2 expression were observed. As shown in Figure 7A–7K, different enrichments were observed in cell cycle, basal transcription factors, spliceosome, p53 signaling pathway, oocyte meiosis, mismatch repair, DNA replication, ubiquitin mediated proteolysis, nucleotide excision repair, homologous recombination, and base excision repair.
Table 4. Gene sets enriched in the high CTSL2 expression phenotype.
| Gene set name | Size | ES | NES | NOM p-value | FDR q-value | ||||||||||||||||||||||||||||||||||||||||||||||||||||||||||||||||||||||||||||||||||||||||||||||
| KEGG_CELL_CYCLE | 118 | –0.654 | –1.935 | <0.001 | 0.103 | ||||||||||||||||||||||||||||||||||||||||||||||||||||||||||||||||||||||||||||||||||||||||||||||
| KEGG_BASAL_TRANSCRIPTION_FACTORS | 35 | –0.557 | –1.909 | <0.001 | 0.069 | ||||||||||||||||||||||||||||||||||||||||||||||||||||||||||||||||||||||||||||||||||||||||||||||
| KEGG_SPLICEOSOME | 114 | –0.522 | –1.894 | 0.008 | 0.055 | ||||||||||||||||||||||||||||||||||||||||||||||||||||||||||||||||||||||||||||||||||||||||||||||
| KEGG_P53_SIGNALING_PATHWAY | 67 | –0.561 | –1.829 | 0.002 | 0.079 | ||||||||||||||||||||||||||||||||||||||||||||||||||||||||||||||||||||||||||||||||||||||||||||||
| KEGG_OOCYTE_MEIOSIS | 112 | –0.499 | –1.795 | 0.006 | 0.081 | ||||||||||||||||||||||||||||||||||||||||||||||||||||||||||||||||||||||||||||||||||||||||||||||
| KEGG_MISMATCH_REPAIR | 23 | –0.714 | –1.781 | 0.002 | 0.078 | ||||||||||||||||||||||||||||||||||||||||||||||||||||||||||||||||||||||||||||||||||||||||||||||
| KEGG_DNA_REPLICATION | 36 | –0.769 | –1.770 | 0.002 | 0.073 | ||||||||||||||||||||||||||||||||||||||||||||||||||||||||||||||||||||||||||||||||||||||||||||||
| KEGG_UBIQUITIN_MEDIATED_PROTEOLYSIS | 134 | –0.323 | –1.753 | 0.019 | 0.074 | ||||||||||||||||||||||||||||||||||||||||||||||||||||||||||||||||||||||||||||||||||||||||||||||
| KEGG_NUCLEOTIDE_EXCISION_REPAIR | 44 | –0.533 | –1.724 | 0.022 | 0.085 | ||||||||||||||||||||||||||||||||||||||||||||||||||||||||||||||||||||||||||||||||||||||||||||||
| KEGG_HOMOLOGOUS_RECOMBINATION | 26 | –0.723 | –1.627 | 0.006 | 0.146 | ||||||||||||||||||||||||||||||||||||||||||||||||||||||||||||||||||||||||||||||||||||||||||||||
| KEGG_BASE_EXCISION_REPAIR | 33 | –0.515 | –1.580 | 0.046 | 0.161 | ||||||||||||||||||||||||||||||||||||||||||||||||||||||||||||||||||||||||||||||||||||||||||||||
| Abbreviations: ES: enrichment score; NES: normalized enrichment score; NOM: nominal; FDR: false discovery rate. | |||||||||||||||||||||||||||||||||||||||||||||||||||||||||||||||||||||||||||||||||||||||||||||||||||
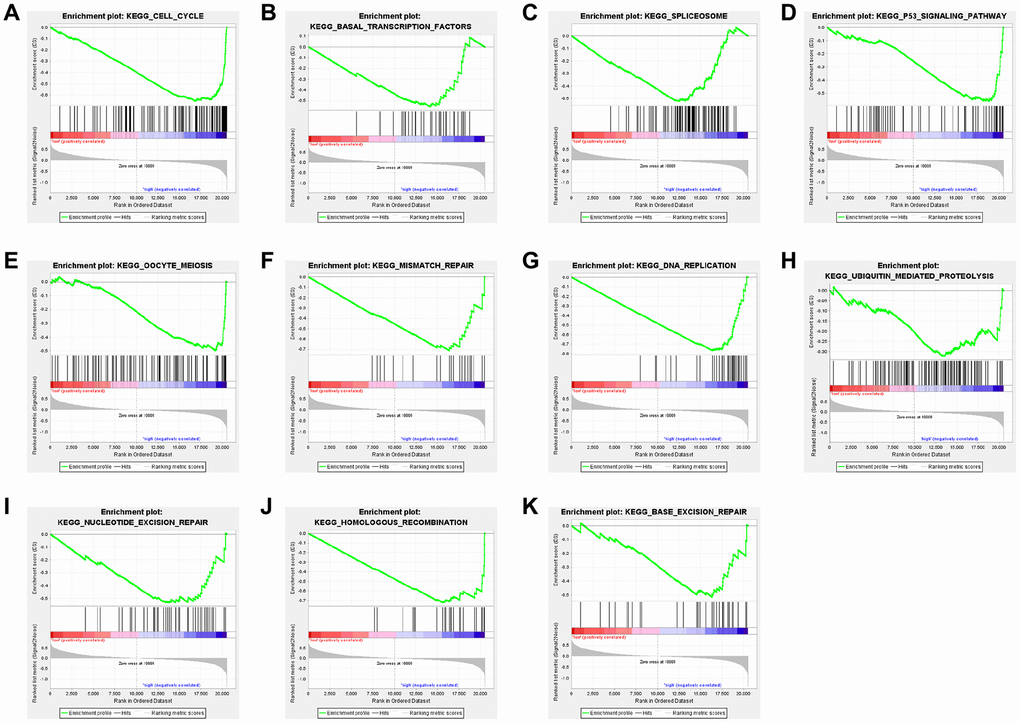
Figure 7. Enrichment plots from GSEA of (A) cell cycle, (B) basal transcription factors, (C) spliceosome, (D) p53 signaling pathway, (E) oocyte meiosis, (F) mismatch repair, (G) DNA replication, (H) ubiquitin mediated proteolysis, (I) nucleotide excision repair, (J) homologous recombination, and (K) base excision repair in lung adenocarcinoma cases with high CTSL2 expression.
Validation using independent external database
Two independent external datasets were used to validate the prognostic value of CTSL2 expression. By analyzing GSE30219, we found patients with high CTSL2 expression showed decreased overall survival (Figure 8A–8H). Consistently, decreased overall survival was also observed in patients with high CTSL2 expression by analyzing GSE50081 (Figure 8I–8P). Furthermore, 12 distinct LUAD datasets (including Beer Lung, Bhattacharjee Lung, Garber Lung, Hou Lung, Landi Lung, Okayama Lung, Selamat Lung, Stearman Lung, Su Lung, TCGA Lung, Weiss Lung, and Yamagata Lung) indicated the CTSL2 expression was significantly increased by pooled analysis in the Oncomine database (Figure 9A–9B) [17–27]. Besides, significantly increased CTSL2 expression was observed in the TIMER database (Figure 9C). Of note, high expression of CTSL2 is usually found in different kinds of solid tumors, including lung cancer, cervical carcinoma, cholangiocarcinoma, colorectal cancer, et al.
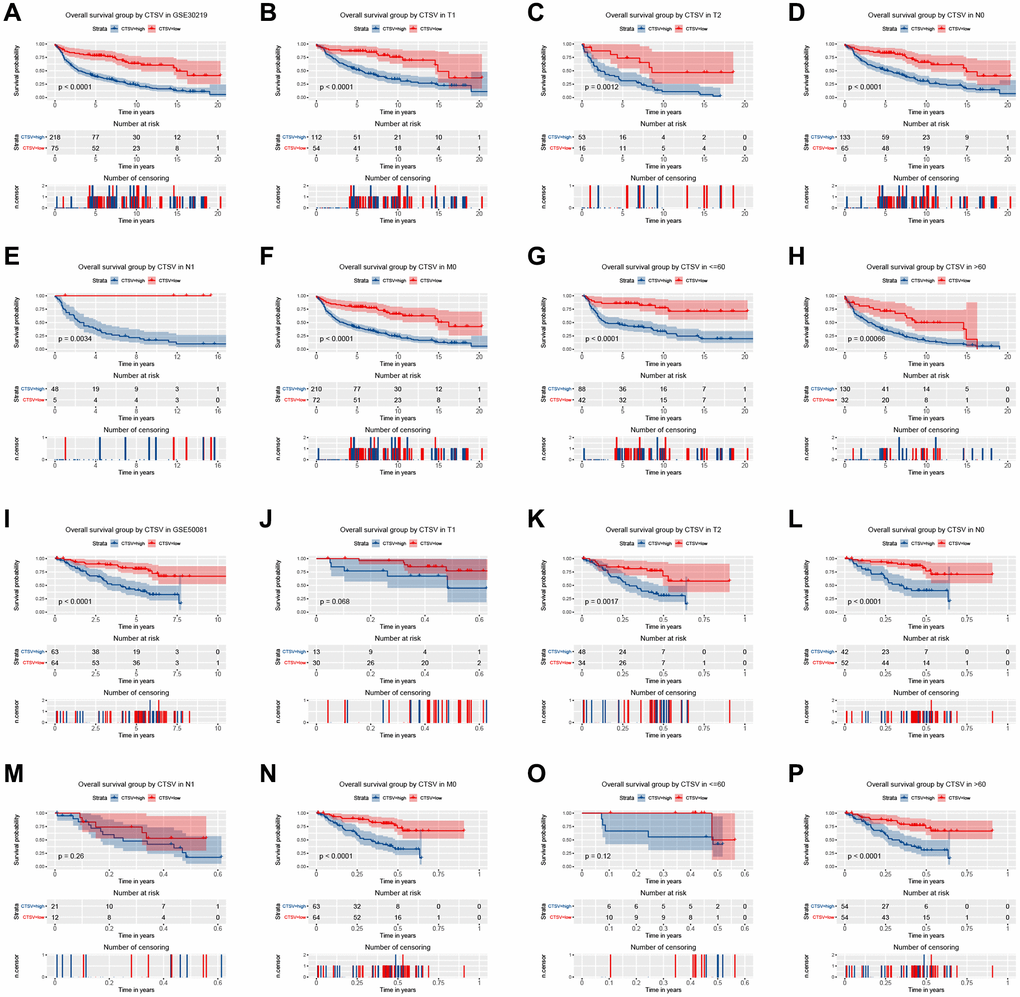
Figure 8. Kaplan–Meier curve for overall survival in lung adenocarcinoma in the validation datasets GSE30219 (A–H) and GSE50081 (I–P).
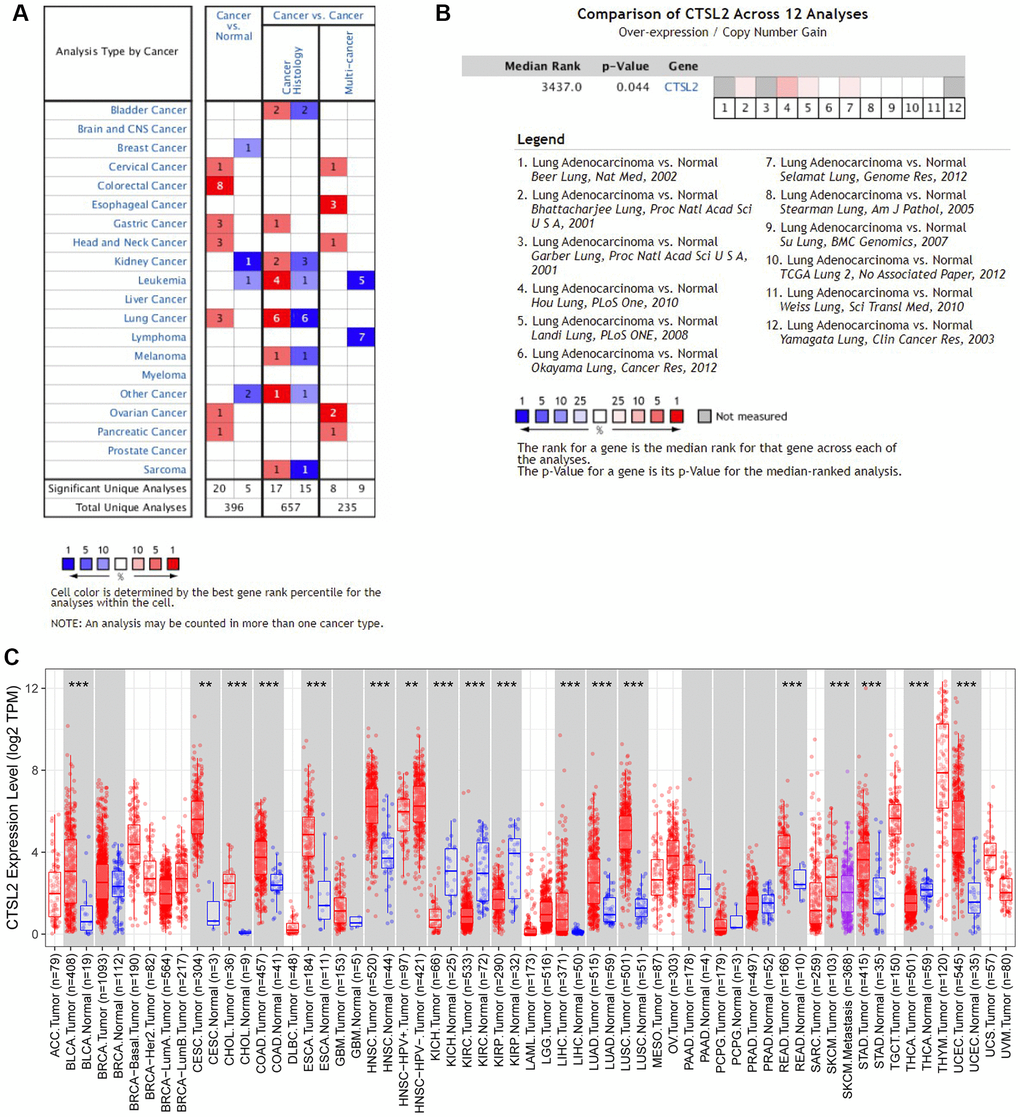
Figure 9. Expression analysis of CTSL2 by Oncomine and TIMER databases. (A) Expression of CTSL2 in different types of human cancers in the Oncomine database; (B) CTSL2 is over-expression (red) in lung adenocarcinoma by Oncomine meta-analysis comparing with normal tissue; (C) Expression of CTSL2 in different types of human cancers in the TIMER database.
High CTSL2 expression in LUAD tissue and cell
As shown in Figure 10A, CTSL2 expression was significantly higher in LUAD than adjacent normal tissue (P < 0.001). Besides, the CTSL2 expression was significantly increased (P < 0.01) in lung cancer cell lines in comparison with normal cell lines (Figure 10B). Notably, A549 cell line showed the highest CTSL2 expression among all the lung cancer cell lines, and used for the subsequent experiments.
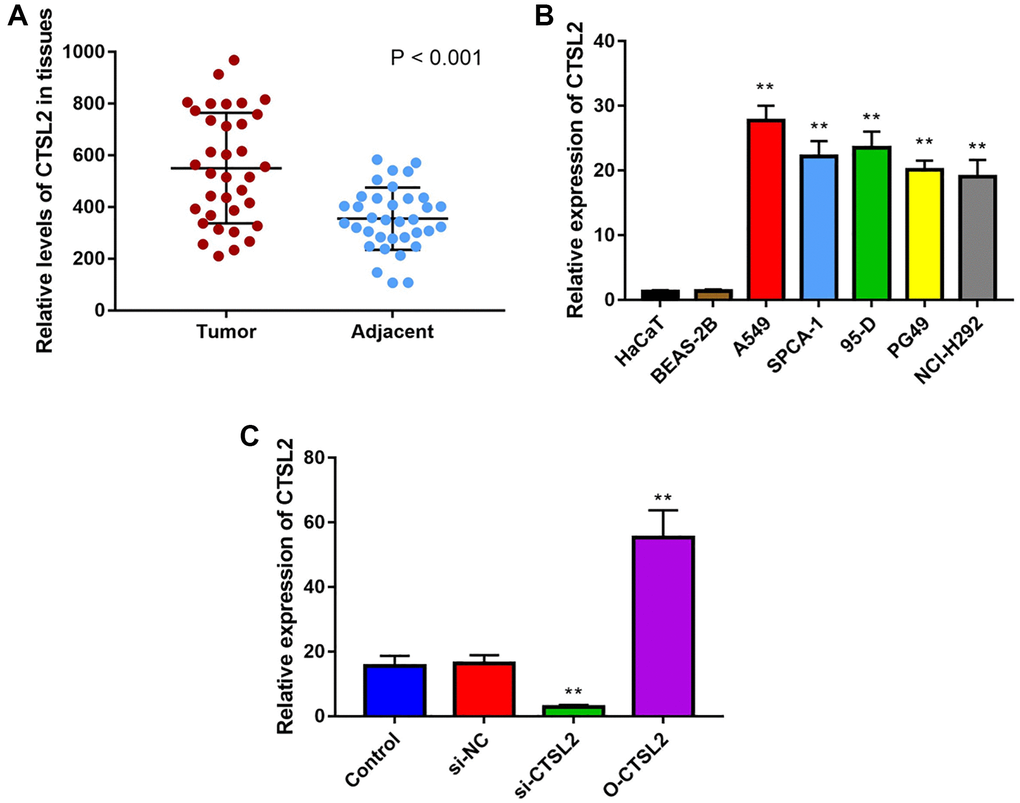
Figure 10. CTSL2 expression in human LUAD tissues and cell lines. (A) Expression of CTSL2 in 35 LUAD tissues and adjacent normal tissues by qRT-PCR; (B) CTSL2 expression levels in HaCaT, BEAS-2B, A549, SPCA-1, 95-D, PG-49, and NCI-H292 by qRT-PCR; (C) CTSL2 expression in A549 cells transfected with control, si-NC, si-CTSL2, and O-CTSL2 by qRT-PCR. **P < 0.01.
CTSL2 promoted the proliferation and migration of A549 cells
The function of CTSL2 on A549 cell proliferation was studied by transfection of siRNA and non-silencing RNA sequences. As shown in Figure 10C, the qRT-PCR was performed to validate the over-expression and knockdown efficiency. It can be observed that CTSL2 expression was significantly decreased after transfection of si-CTSL2 (P < 0.01), and increased after transfection of O-CTSL2 in A549 cells (P < 0.01).
The role of CTSL2 on proliferation and migration of A549 cells was studied. As shown in Figure 11A, over-expression and knockdown of CTSL2 promoted and inhibited the proliferation of A549 cells, respectively. The results of CCK-8 were verified by the LIVE/DEAD staining (Figure 11B–11C). Compared with control and si-NC group, si-CTSL2 group showed significantly higher percentage of dead cells (P < 0.01). The results of colony formation were consistent with those of CCK-8 and LIVE/DEAD staining (Figure 11D–11E). Over-expression of CTSL2 showed significantly increased number of colonies (P < 0.05). The cell migration assay showed that si-CTSL2 significantly reduced and O-CTSL2 significantly increased the migration distance of A549 cells (Figure 11F–11G).
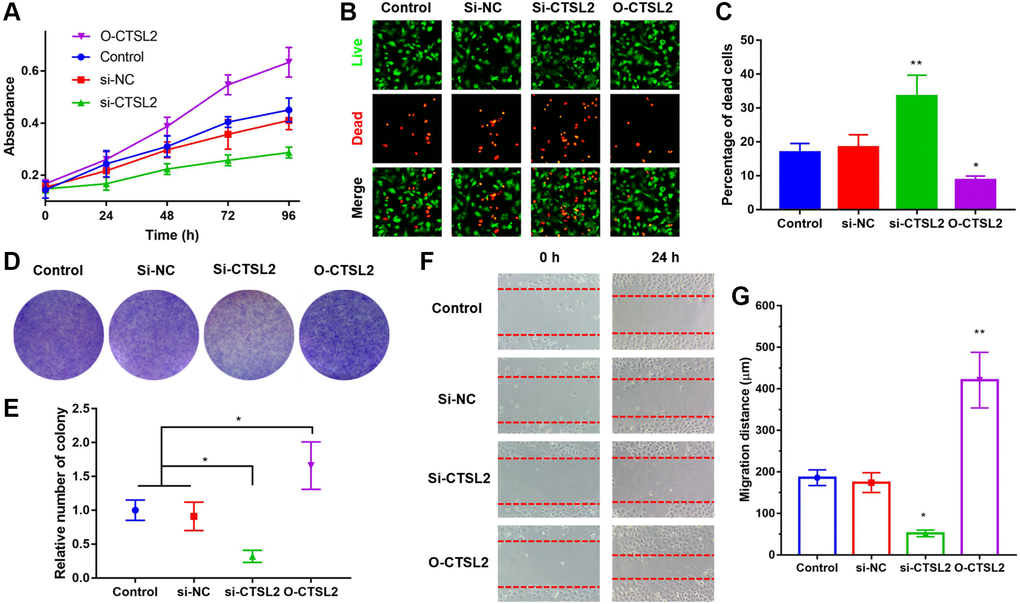
Figure 11. CTSL2 promoted cell proliferation and migration of LUAD cells. (A) CCK-8 proliferation curve of A549 cells; (B) Co-staining of calcein AM and PI of A549 cells, the live cells were stained with green fluorescence, and the dead cells were stained with red fluorescence; (C) Percentage of dead cells in different groups; (D) Colony formation of A549 cells; (E) Relative number of colonies in different groups; (F) Cell migration of A549 cells during 24 h; (G) Migration distance in different groups. *P < 0.05, **P < 0.01. All the experiments were repeated for three times.
Discussion
Exploration of biomarker have been performed in cancer such as breast cancer and liver cancer [28–30]. However, not too much progress has been made in LUAD. We first demonstrated that CTSL2 was highly expressed in LUAD, which was significantly associated with age, vital status, and T classification. Moreover, CTSL2 showed the moderate diagnostic value for LUAD. Data mining has been emerged as an approach to find novel biomarkers [31, 32]. The existed biomarkers have not shown satisfied diagnostic and prognostic value [33–35]. Therefore, it is necessary to explore novel biomarkers to further solve this problem [36–37]. The thymidine kinase 1 was found to improve its diagnostic value for LUAD when combined with carcinoembryonic antigen [38]. Moreover, newly reported biomarkers including uridine-cytidine kinase 2 and long non-coding RNA XLOC_009167 have shown potential value in prognosis [39–40]. Together with these findings, our finding that high CTSL2 expression predicts poor prognosis in patients with LUAD also contributes to the biomarker exploration for clinical practice.
CTSL2 belongs to the cathepsins family, which are involved in proliferation, invasion, and metastasis of different kinds of cancers. Upregulation of cathepsin L protein was observed in the conditional K-rasG12D mouse LUAC model [41]. High CTSL2 expression was found in squamous cell carcinoma by high-density oligonucleotide microarray [14]. mRNA level of CTSL2 is significantly increased in endometrial cancer especially in G3 tumors, indicating it may lead to the progression of endometrial cancer [42]. In our study, we found high CTSL2 expression in LUAD tissue and cell by performing bioinformatic analysis and q-PCR. Similarly, Michael et al. reported the prognostic significance of CTSL2 in breast ductal carcinoma in situ [43]. Moreover, our GSEA analysis suggested that high CTSL2 expression may be associated with cell cycle, basal transcription factors, spliceosome, p53 signaling pathway, oocyte meiosis, et al. The phenomenon that CTSL2 promoted the proliferation and migration of A549 cells may be associated with these biological processes and signaling pathways, which needs to be investigated in the future.
In conclusion, high expression of CTSL2 was found in LUAD and associated with clinical progression. High CTSL2 expression was an independent risk factor for OS in LUAD patients. CTSL2 promoted the proliferation and migration of LUAD cells. CTSL2 may serve as a biomarker for diagnosis and prognosis of LUAD. High CTSL2 expression predicts poor prognosis in patients with LUAD.
Materials and Methods
Data mining
Public TCGA (The Cancer Genome Atlas) database was analyzed for data mining with no ethical concern, involving 517 LUAD patients. The RNA expression of CTSL2 was box-plotted. ROC (Receiver operating characteristic) curve was drawn with the AUC (area under curves) calculated using pROC package [44]. The high-expressed and low-expressed groups were determined by identified CTSL2 threshold level. The survival package in R and Cox model was used as previously reported [45]. The covariates included in the multivariate Cox regression model were stage, T, N, M classification, residual tumor, and CTSL2 expression. GSE30219 (analyzing 293 lung tumor and 14 normal lung specimen) and GSE50081 (analyzing 181 Stage I and II non-small cell lung carcinoma) were used for external validation. Evaluation of subgroups was performed as well. GSEA was carried out for identification of CTSL2 expression-related genes and examination of the survival significances. Oncomine database and TIMER database were used for validation of CTSL2 expression.
Sample collection
We collected LUAD and adjacent tissues from 35 patients. The samples were kept in liquid nitrogen immediately after resection, and stored at −80°C. The study was approved by the First Hospital of Jilin University Ethics Committee and conformed to the Declaration of Helsinki.
Cell culture and cell transfection
BEAS-2B, HaCaT, A549, SPCA-1, 95-D, NCI-H292 and PG-49 cell lines were purchased from American Tissue Culture Collection. BEAS-2B, A549, 95-D, and NCI-H292 and were cultured in Dulbecco’s modified Eagle’s medium supplemented with 10% fetal bovine serum. HaCaT, SPCA-1, and PG-49 were cultured in Roswell Park Memorial Institute-1640 supplemented with 10% fetal bovine serum. Antibiotics penicillin and streptomycin (1 %) were used. The cells were cultured at 37°C with 5% CO2. The lentiviral vector containing siRNA targeting CTSL2 was constructed. As previously reported, the transfection of four groups including (a) si-CTSL2: si-CTSL2 transfected group, (b) O-CTSL2: CTSL2 overexpressed group, (c) si-NC: an empty lentiviral vector transfected group as negative control, (d) control: un-transfected group. The validation of over-expression and knockdown efficiency was performed using qRT-PCR.
qRT-PCR
The total RNA extraction was carried out following the instruction of manufacturer (Invitrogen, Thermo Fisher Scientific, USA). Then, the RNA was reversely transcribed into cDNA using the kit (Roche, Basel, Switzerland). The qRT-PCR was performed and the expression of CTSL2 was quantified using 2−ΔΔCt method. The primers were as follows (5′-3′): CTSL2 forward primer, GAAGTCAGAAAGGAAGTACAGAGG; CTSL2 reverse primer, CTCTCCAGTCAACAGATCGTG; β-actin forward primer, ACCCCAAAGCCAACAGA; β-actin reverse primer, CCAGAGTCCATCACAATACC.
Cell proliferation assay
First, plasmid was added into each plate, followed by culturing for 24 h. After adding CCK-8 solution (10 μL), the cells were placed for 20 min. The 490 nm absorbance was measured, and the cell viability was calculated. Calcein AM and PI co-staining and colony formation assay were further performed [44].
Wound healing assay
Calcein AM was used to stain the live cells [44]. The cell migration was recorded using fluorescence microscope, and the migration distance was calculated.
Statistical analysis
R version 3.5.2 package and ggplot2 package in R were used for bioinformatics analysis [45–46]. The Wilcoxon rank-sum test and Kruskal-Wallis test were used. The chi-squared test and Fisher's exact test were used for assessing association. Kaplan-Meier and Cox regression were performed to evaluate the effect of CTSL2 expression in the overall survival [47]. GSEA was performed using data from TCGA. The student’s t-test (unpaired, two-tailed) was used to analyze experiment data. P < 0.05 was used as the threshold of statistical significance.
Supplementary Materials
Author Contributions
G.W., and W.P. designed this study and had full access to all of data in the study; J.S., and J.J. extracted the data; N.W., and Z.D. analyzed and interpreted the data; J.S., and J.J wrote the paper. All authors reviewed the manuscript.
Conflicts of Interest
The authors declare no conflicts of interest related to this study.
Funding
This study was supported by Jilin university project (No. 2019XZC082).
References
- 1. Herbst RS, Morgensztern D, Boshoff C. The biology and management of non-small cell lung cancer. Nature. 2018; 553:446–54. https://doi.org/10.1038/nature25183 [PubMed]
- 2. Gridelli C, Rossi A, Carbone DP, Guarize J, Karachaliou N, Mok T, Petrella F, Spaggiari L, Rosell R. Non-small-cell lung cancer. Nat Rev Dis Primers. 2015; 1:15009. https://doi.org/10.1038/nrdp.2015.9 [PubMed]
- 3. Hirsch FR, Scagliotti GV, Mulshine JL, Kwon R, Curran WJ
Jr , Wu YL, Paz-Ares L. Lung cancer: current therapies and new targeted treatments. Lancet. 2017; 389:299–311. https://doi.org/10.1016/S0140-6736(16)30958-8 [PubMed] - 4. Arbour KC, Riely GJ. Systemic Therapy for Locally Advanced and Metastatic Non-Small Cell Lung Cancer: A Review. JAMA. 2019; 322:764–74. https://doi.org/10.1001/jama.2019.11058 [PubMed]
- 5. Schuller HM. The impact of smoking and the influence of other factors on lung cancer. Expert Rev Respir Med. 2019; 13:761–69. https://doi.org/10.1080/17476348.2019.1645010 [PubMed]
- 6. Blandin Knight S, Crosbie PA, Balata H, Chudziak J, Hussell T, Dive C. Progress and prospects of early detection in lung cancer. Open Biol. 2017; 7:170070. https://doi.org/10.1098/rsob.170070 [PubMed]
- 7. Goveia J, Rohlenova K, Taverna F, Treps L, Conradi LC, Pircher A, Geldhof V, de Rooij LP, Kalucka J, Sokol L, García-Caballero M, Zheng Y, Qian J, et al. An Integrated Gene Expression Landscape Profiling Approach to Identify Lung Tumor Endothelial Cell Heterogeneity and Angiogenic Candidates. Cancer Cell. 2020; 37:21–36.e13. https://doi.org/10.1016/j.ccell.2019.12.001 [PubMed]
- 8. Collins LG, Haines C, Perkel R, Enck RE. Lung cancer: diagnosis and management. Am Fam Physician. 2007; 75:56–63. [PubMed]
- 9. Nasim F, Sabath BF, Eapen GA. Lung Cancer. Med Clin North Am. 2019; 103:463–73. https://doi.org/10.1016/j.mcna.2018.12.006 [PubMed]
- 10. Gocheva V, Joyce JA. Cysteine cathepsins and the cutting edge of cancer invasion. Cell Cycle. 2007; 6:60–64. https://doi.org/10.4161/cc.6.1.3669 [PubMed]
- 11. Wong CH, Wu Z, Yu Q. CTSL2 is a pro-apoptotic target of E2F1 and a modulator of histone deacetylase inhibitor and DNA damage-induced apoptosis. Oncogene. 2014; 33:1249–57. https://doi.org/10.1038/onc.2013.72 [PubMed]
- 12. Sun T, Jiang D, Zhang L, Su Q, Mao W, Jiang C. Expression profile of cathepsins indicates the potential of cathepsins B and D as prognostic factors in breast cancer patients. Oncol Lett. 2016; 11:575–83. [PubMed]
- 13. Santamaría I, Velasco G, Cazorla M, Fueyo A, Campo E, López-Otín C. Cathepsin L2, a novel human cysteine proteinase produced by breast and colorectal carcinomas. Cancer Res. 1998; 58:1624–30. [PubMed]
- 14. Haider AS, Peters SB, Kaporis H, Cardinale I, Fei J, Ott J, Blumenberg M, Bowcock AM, Krueger JG, Carucci JA. Genomic analysis defines a cancer-specific gene expression signature for human squamous cell carcinoma and distinguishes malignant hyperproliferation from benign hyperplasia. J Invest Dermatol. 2006; 126:869–81. https://doi.org/10.1038/sj.jid.5700157 [PubMed]
- 15. Kiuchi S, Tomaru U, Ishizu A, Imagawa M, Kiuchi T, Iwasaki S, Suzuki A, Otsuka N, Deguchi T, Shimizu T, Marukawa K, Matsuno Y, Kasahara M. Expression of cathepsins V and S in thymic epithelial tumors. Hum Pathol. 2017; 60:66–74. https://doi.org/10.1016/j.humpath.2016.09.027 [PubMed]
- 16. Ong PC, McGowan S, Pearce MC, Irving JA, Kan WT, Grigoryev SA, Turk B, Silverman GA, Brix K, Bottomley SP, Whisstock JC, Pike RN. DNA accelerates the inhibition of human cathepsin V by serpins. J Biol Chem. 2007; 282:36980–86. https://doi.org/10.1074/jbc.m706991200 [PubMed]
- 17. Beer DG, Kardia SL, Huang CC, Giordano TJ, Levin AM, Misek DE, Lin L, Chen G, Gharib TG, Thomas DG, Lizyness ML, Kuick R, Hayasaka S, et al. Gene-expression profiles predict survival of patients with lung adenocarcinoma. Nat Med. 2002; 8:816–24. https://doi.org/10.1038/nm733 [PubMed]
- 18. Bhattacharjee A, Richards WG, Staunton J, Li C, Monti S, Vasa P, Ladd C, Beheshti J, Bueno R, Gillette M, Loda M, Weber G, Mark EJ, et al. Classification of human lung carcinomas by mRNA expression profiling reveals distinct adenocarcinoma subclasses. Proc Natl Acad Sci U S A. 2001; 98:13790–95. https://doi.org/10.1073/pnas.191502998 [PubMed]
- 19. Garber ME, Troyanskaya OG, Schluens K, Petersen S, Thaesler Z, Pacyna-Gengelbach M, van de Rijn M, Rosen GD, Perou CM, Whyte RI, Altman RB, Brown PO, Botstein D, Petersen I. Diversity of gene expression in adenocarcinoma of the lung. Proc Natl Acad Sci U S A. 2001; 98:13784–89. https://doi.org/10.1073/pnas.241500798 [PubMed]
- 20. Hou J, Aerts J, den Hamer B, van Ijcken W, den Bakker M, Riegman P, van der Leest C, van der Spek P, Foekens JA, Hoogsteden HC, Grosveld F, Philipsen S. Gene expression-based classification of non-small cell lung carcinomas and survival prediction. PLoS One. 2010; 5:e10312. https://doi.org/10.1371/journal.pone.0010312 [PubMed]
- 21. Landi MT, Dracheva T, Rotunno M, Figueroa JD, Liu H, Dasgupta A, Mann FE, Fukuoka J, Hames M, Bergen AW, Murphy SE, Yang P, Pesatori AC, et al. Gene expression signature of cigarette smoking and its role in lung adenocarcinoma development and survival. PLoS One. 2008; 3:e1651. https://doi.org/10.1371/journal.pone.0001651 [PubMed]
- 22. Okayama H, Kohno T, Ishii Y, Shimada Y, Shiraishi K, Iwakawa R, Furuta K, Tsuta K, Shibata T, Yamamoto S, Watanabe S, Sakamoto H, Kumamoto K, et al. Identification of genes upregulated in ALK-positive and EGFR/KRAS/ALK-negative lung adenocarcinomas. Cancer Res. 2012; 72:100–11. https://doi.org/10.1158/0008-5472.CAN-11-1403 [PubMed]
- 23. Selamat SA, Chung BS, Girard L, Zhang W, Zhang Y, Campan M, Siegmund KD, Koss MN, Hagen JA, Lam WL, Lam S, Gazdar AF, Laird-Offringa IA. Genome-scale analysis of DNA methylation in lung adenocarcinoma and integration with mRNA expression. Genome Res. 2012; 22:1197–211. https://doi.org/10.1101/gr.132662.111 [PubMed]
- 24. Stearman RS, Dwyer-Nield L, Zerbe L, Blaine SA, Chan Z, Bunn PA
Jr , Johnson GL, Hirsch FR, Merrick DT, Franklin WA, Baron AE, Keith RL, Nemenoff RA, et al. Analysis of orthologous gene expression between human pulmonary adenocarcinoma and a carcinogen-induced murine model. Am J Pathol. 2005; 167:1763–75. https://doi.org/10.1016/S0002-9440(10)61257-6 [PubMed] - 25. Su LJ, Chang CW, Wu YC, Chen KC, Lin CJ, Liang SC, Lin CH, Whang-Peng J, Hsu SL, Chen CH, Huang CY. Selection of DDX5 as a novel internal control for Q-RT-PCR from microarray data using a block bootstrap re-sampling scheme. BMC Genomics. 2007; 8:140. https://doi.org/10.1186/1471-2164-8-140 [PubMed]
- 26. Weiss J, Sos ML, Seidel D, Peifer M, Zander T, Heuckmann JM, Ullrich RT, Menon R, Maier S, Soltermann A, Moch H, Wagener P, Fischer F, et al. Frequent and focal FGFR1 amplification associates with therapeutically tractable FGFR1 dependency in squamous cell lung cancer. Sci Transl Med. 2010; 2:62ra93. https://doi.org/10.1126/scitranslmed.3001451 [PubMed]
- 27. Yamagata N, Shyr Y, Yanagisawa K, Edgerton M, Dang TP, Gonzalez A, Nadaf S, Larsen P, Roberts JR, Nesbitt JC, Jensen R, Levy S, Moore JH, et al. A training-testing approach to the molecular classification of resected non-small cell lung cancer. Clin Cancer Res. 2003; 9:4695–704. [PubMed]
- 28. Cai H, Jiao Y, Li Y, Yang Z, He M, Liu Y. Low CYP24A1 mRNA expression and its role in prognosis of breast cancer. Sci Rep. 2019; 9:13714. https://doi.org/10.1038/s41598-019-50214-z [PubMed]
- 29. Jiao Y, Fu Z, Li Y, Meng L, Liu Y. High EIF2B5 mRNA expression and its prognostic significance in liver cancer: a study based on the TCGA and GEO database. Cancer Manag Res. 2018; 10:6003–14. https://doi.org/10.2147/CMAR.S185459 [PubMed]
- 30. Jiao Y, Li Y, Fu Z, Hou L, Chen Q, Cai Y, Jiang P, He M, Yang Z. OGDHL Expression as a Prognostic Biomarker for Liver Cancer Patients. Dis Markers. 2019; 2019:9037131. https://doi.org/10.1155/2019/9037131 [PubMed]
- 31. Jiao Y, Li Y, Jiang P, Han W, Liu Y. PGM5: a novel diagnostic and prognostic biomarker for liver cancer. PeerJ. 2019; 7:e7070. https://doi.org/10.7717/peerj.7070 [PubMed]
- 32. Jiao Y, Li Y, Liu S, Chen Q, Liu Y. ITGA3 serves as a diagnostic and prognostic biomarker for pancreatic cancer. Onco Targets Ther. 2019; 12:4141–52. https://doi.org/10.2147/OTT.S201675 [PubMed]
- 33. Neal JW, Gainor JF, Shaw AT. Developing biomarker-specific end points in lung cancer clinical trials. Nat Rev Clin Oncol. 2015; 12:135–46. https://doi.org/10.1038/nrclinonc.2014.222 [PubMed]
- 34. Krebs MG, Sloane R, Priest L, Lancashire L, Hou JM, Greystoke A, Ward TH, Ferraldeschi R, Hughes A, Clack G, Ranson M, Dive C, Blackhall FH. Evaluation and prognostic significance of circulating tumor cells in patients with non-small-cell lung cancer. J Clin Oncol. 2011; 29:1556–63. https://doi.org/10.1200/JCO.2010.28.7045 [PubMed]
- 35. Grunnet M, Sorensen JB. Carcinoembryonic antigen (CEA) as tumor marker in lung cancer. Lung Cancer. 2012; 76:138–43. https://doi.org/10.1016/j.lungcan.2011.11.012 [PubMed]
- 36. Tang T, Yang C, Brown HE, Huang J. Circulating Heat Shock Protein 70 Is a Novel Biomarker for Early Diagnosis of Lung Cancer. Dis Markers. 2018; 2018:6184162. https://doi.org/10.1155/2018/6184162 [PubMed]
- 37. Yang Q, Zhang P, Wu R, Lu K, Zhou H. Identifying the Best Marker Combination in CEA, CA125, CY211, NSE, and SCC for Lung Cancer Screening by Combining ROC Curve and Logistic Regression Analyses: Is It Feasible? Dis Markers. 2018; 2018:2082840. https://doi.org/10.1155/2018/2082840 [PubMed]
- 38. Jiang ZF, Wang M, Xu JL. Thymidine kinase 1 combined with CEA, CYFRA21-1 and NSE improved its diagnostic value for lung cancer. Life Sci. 2018; 194:1–6. https://doi.org/10.1016/j.lfs.2017.12.020 [PubMed]
- 39. Wu Y, Jamal M, Xie T, Sun J, Song T, Yin Q, Li J, Pan S, Zeng X, Xie S, Zhang Q. Uridine-cytidine kinase 2 (UCK2): A potential diagnostic and prognostic biomarker for lung cancer. Cancer Sci. 2019; 110:2734–47. https://doi.org/10.1111/cas.14125 [PubMed]
- 40. Jiang N, Meng X, Mi H, Chi Y, Li S, Jin Z, Tian H, He J, Shen W, Tian H, Pan J, Fang S, Jin X, et al. Circulating lncRNA XLOC_009167 serves as a diagnostic biomarker to predict lung cancer. Clin Chim Acta. 2018; 486:26–33. https://doi.org/10.1016/j.cca.2018.07.026 [PubMed]
- 41. Grimm J, Kirsch DG, Windsor SD, Kim CF, Santiago PM, Ntziachristos V, Jacks T, Weissleder R. Use of gene expression profiling to direct in vivo molecular imaging of lung cancer. Proc Natl Acad Sci U S A. 2005; 102:14404–09. https://doi.org/10.1073/pnas.0503920102 [PubMed]
- 42. Skrzypczak M, Springwald A, Lattrich C, Häring J, Schüler S, Ortmann O, Treeck O. Expression of cysteine protease cathepsin L is increased in endometrial cancer and correlates with expression of growth regulatory genes. Cancer Invest. 2012; 30:398–403. https://doi.org/10.3109/07357907.2012.672608 [PubMed]
- 43. Toss M, Miligy I, Gorringe K, Mittal K, Aneja R, Ellis I, Green A, Rakha E. Prognostic significance of cathepsin V (CTSV/CTSL2) in breast ductal carcinoma in situ. J Clin Pathol. 2020; 73:76–82. https://doi.org/10.1136/jclinpath-2019-205939 [PubMed]
- 44. Yan F, Shen N, Pang J, Zhao N, Deng B, Li B, Yang Y, Yang P, Molina JR, Liu S. A regulatory circuit composed of DNA methyltransferases and receptor tyrosine kinases controls lung cancer cell aggressiveness. Oncogene. 2017; 36:6919–28. https://doi.org/10.1038/onc.2017.305 [PubMed]
- 45. Robin X, Turck N, Hainard A, Tiberti N, Lisacek F, Sanchez JC, Müller M. pROC: an open-source package for R and S+ to analyze and compare ROC curves. BMC Bioinformatics. 2011; 12:77. https://doi.org/10.1186/1471-2105-12-77 [PubMed]
- 46. Moreno-Betancur M, Sadaoui H, Piffaretti C, Rey G. Survival Analysis with Multiple Causes of Death: Extending the Competing Risks Model. Epidemiology. 2017; 28:12–19. https://doi.org/10.1097/EDE.0000000000000531 [PubMed]
- 47. Jin CY, Du L, Nuerlan AH, Wang XL, Yang YW, Guo R. High expression of RRM2 as an independent predictive factor of poor prognosis in patients with lung adenocarcinoma. Aging (Albany NY). 2020; 13:3518–35. https://doi.org/10.18632/aging.202292 [PubMed]