


This article has been corrected: The authors replaced the “oe-H19 + oe-CTCF + oe-PKD1” panel of the HE staining in Figure 5C, which was accidently mislabeled and partially duplicated with the “oe-NC + oe-NC + oe-NC” image. Replacement was done using representative images from the original sets of experiments. This alteration does not affect the results or conclusions of this work.
The new Figure 5 is presented below.
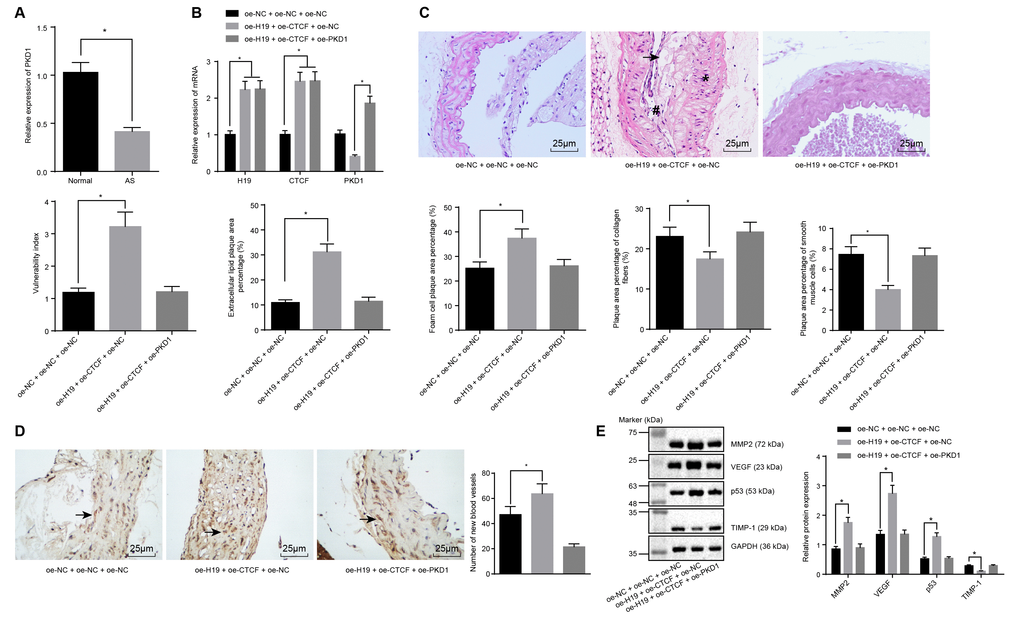
Figure 5. H19 is involved in atherosclerotic vulnerable plaque formation and intraplaque angiogenesis through down-regulating PKD1 by recruiting CTCF in ApoE knockout mice with AS. (A) The expression pattern of PKD1 in the aortic tissues of normal and AS mice determined by RT-qPCR. * p < 0.05 vs. the control group. (B) The overexpressing efficiency of H19, CTCF and PKD1 assessed by RT-qPCR. * p < 0.05 vs. the oe-NC + oe-NC + oe-NC group; # p < 0.05 vs. the oe-H19 + oe-CTCF + oe-NC group. (C) The atherosclerotic vulnerable plaque formation evaluated by HE staining (× 400) (The arrow referred to lipid vacuoles, * represented inflammatory cells and # indicated fractured smooth muscle). (D) The number of new blood vessels measured by Immunohistochemical staining (× 400) (The arrow referred to CD34-positive cells). (E) The protein levels of MMP-2, VEGF, p53 and TIMP-1 in atherosclerotic plaques normalized to GAPDH after transfection determined by Western blot analysis. * p < 0.05 vs. the oe-NC + oe-NC + oe-NC group. The data were measurement data and expressed by mean ± standard deviation. Data differences between two groups were analyzed by unpaired t-test; comparisons made among multiple groups were analyzed by one-way ANOVA. The experiments were repeated three times independently.