


Introduction
Advanced development of internet telecommunication technologies (ICT) enables clinicians and healthcare professionals to collect real-time information through wearable biosensors that further changes healthcare services and healthy lifestyles. The integration of electronic health records and wearable devices may overwhelmingly modify the disease diagnosis, treatment and care management of clinical conditions. The World Health Organization’s Global Observatory recognized the roles of mobile devices in supporting medical and public health practice to collect health data, to support diagnosis, to monitor progress, and to promote health promotion [1]. The advantage of real-time and person-powered data nature of wearable devices promotes integration of daily lifestyle conditions in disease diagnosis, health promotion, and personalized care planning that echoes the concepts of precision medicine [2, 3].
Although a great variety of parameters have been developed to measure health, the usual walking speed is a well-established and widely-recognized biomarker to predict adverse health outcomes for older adults [4]. Walking is a complex physical performance interconnected with musculoskeletal, neural systems, and other organ systems. Usual walking speed is a simple functional measure to predict mortality [5], cognitive impairment [6], and disability [7]. Given its nature as a quick, simple and reliable assessment tool for functional ability of older adults, walking speed has been recommended as the indicator for physical health and successful aging [7]. A study of 1925 patients with osteoarthritis showed that intensive walking training significantly prevented walking speed slowing [8], which suggested the potentials to improve or maintain walking speed through appropriate training even on those with orthopedic conditions. Wearable devices have garnered extensive research attentions as a safe, reliable and cost-effective approach to track physical activities [9, 10]. Moreover, the use of wearable devices may modify users’ behavior and enhance their physical activities through self-monitoring and reinforcement [11]. Using wearable devices in health care systems may shift the traditional provider/organization-centric service delivery model to person-centered approach that empowers individuals to carry on healthy lifestyles. Although the potential benefits of using wearable devices for healthy lifestyles have been reported, the effects of wearable devices on health outcomes were inconsistent [12–16]. It has been reported that using wearable devices substantially improved daily sensatory behavior of workers [13], and also increased daily walking steps of older adults [14]. However, using wearable devices did not show improvement in walking speed in the subacute rehabilitation setting [15]. A study of 350 older women aged≥75 years reported that moderate to vigorous physical activities prevented walking speed slowing [16], but those activities were not triggered by the utilization of wearable devices. Moreover, a systematic review of six published studies did not identify significantly favorable effects of using wearable devices on chronic conditions management and related health outcomes [12]. Hence, this study aimed to evaluate the potential health benefits of wearable device use among community-dwelling middle-aged and older persons during the 12-month follow-up. We hypothesized that reciprocal self-monitoring and reinforcement may enable behavior changes, prevent functional declines, and improve health outcomes through a longer follow-up period.
Results
Overall, 369 participants were enrolled for study, and 319 (mean age: 64.9±6.6 year, 32.3 % male) of them completed a 12-months follow-up (Figure 1); 128 (40.1%) out of the 319 participants were classified as active users. Table 1 summarized comparisons of demographic characteristics, functional assessments, cardiovascular parameters and age-related hormones between groups. Compared to non-active users, active users had better nutrition(p=0.046) and cognitive performance(p=0.006), higher T-score of bone mineral density (p for trend =0.020), lower serum levels of ACTH (p for trend =0.005), higher serum levels of IGF-1 (p for trend < 0.001), lower serum levels of AST (p for trend =0.007), and lower urine microalbumin-to-creatinine ratio (p for trend =0.036). However, the appendicular muscle mass was similar to non-active users. Figure 2 showed mean declines of daily steps among participants of the three groups during the study period. Table 2 summarized changes of physical and functional measurements during the study period based on the utilization patterns of the wearable device. Multivariable linear regression showed the changes of walking speed over 12 months of active users was 0.16 m/s higher than that of non-active users, but similar in handgrip strength, 5-time sit-to-stand test and other functional measurements like MNA-SF, CES-D, MoCA, SMAF, and blood pressure measurements. ROC analysis showed the average daily steps of 7,008 was the most optimal cutoff to prevent walking speed slowing in the 12-month period (sensitivity 0.44, specificity 0.68, c-statistics 0.53).
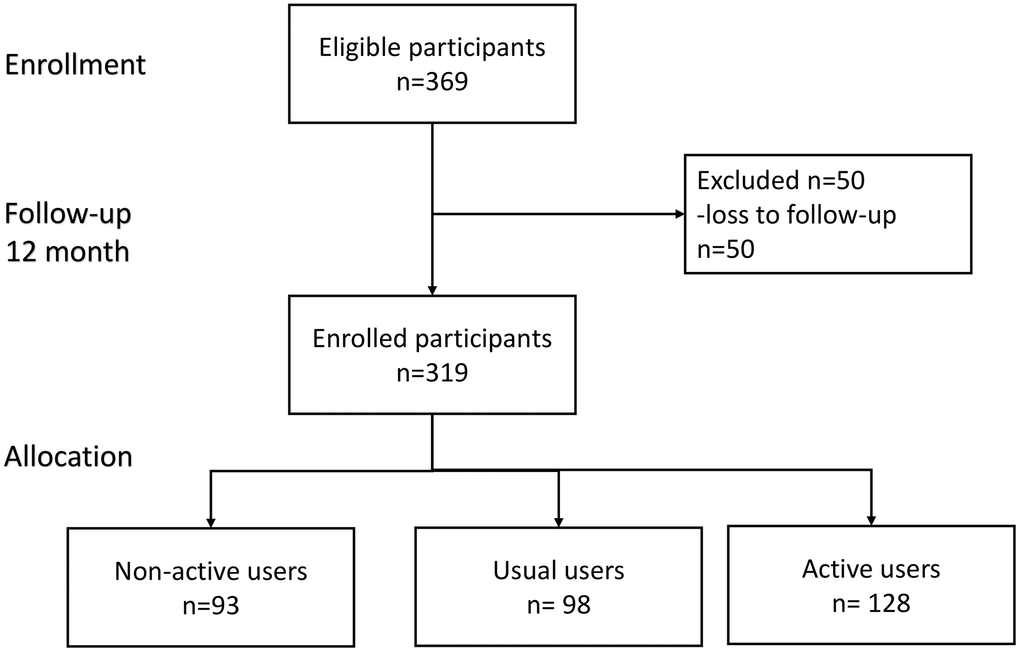
Figure 1. Flowchart diagram of participants in this study.
Table 1. Characteristics of participants by wearable device.
| Characteristics: data show mean ± SD or number (%) | Non-active user (n=93) | Usual user (n=98) | Active user (n=128) | p value | |||||||||||||||||||||||||||||||||||||||||||||||||||||||||||||||||||||||||||||||||||||||||||||||
| Age(years) | 66.0±7.2 | 64.6±6.6 | 64.3±6.1 | 0.135 | |||||||||||||||||||||||||||||||||||||||||||||||||||||||||||||||||||||||||||||||||||||||||||||||
| Men | 33(35.5) | 30(30.6) | 40(31.2) | 0.730 | |||||||||||||||||||||||||||||||||||||||||||||||||||||||||||||||||||||||||||||||||||||||||||||||
| Education (years) | 14.2±3.5 | 13.6±3.2 | 14.5±3.1 | 0.181 | |||||||||||||||||||||||||||||||||||||||||||||||||||||||||||||||||||||||||||||||||||||||||||||||
| Body composition | |||||||||||||||||||||||||||||||||||||||||||||||||||||||||||||||||||||||||||||||||||||||||||||||||||
| Body height (cm) | 161.0±7.9 | 159.5±8.8 | 158.6±7.4 | 0.098 | |||||||||||||||||||||||||||||||||||||||||||||||||||||||||||||||||||||||||||||||||||||||||||||||
| Body weight (kg) | 61.1±10.8 | 60.2±10.6 | 60.7±10.4 | 0.859 | |||||||||||||||||||||||||||||||||||||||||||||||||||||||||||||||||||||||||||||||||||||||||||||||
| Body mass index (kg/m2) | 23.5±3.4 | 23.6±3.1 | 24.0±3.2 | 0.449 | |||||||||||||||||||||||||||||||||||||||||||||||||||||||||||||||||||||||||||||||||||||||||||||||
| Appendicular skeletal muscle (kg) | 17.1±4.1 | 16.8±4.0 | 17.1±4.2 | 0.922 | |||||||||||||||||||||||||||||||||||||||||||||||||||||||||||||||||||||||||||||||||||||||||||||||
| Appendicular skeletal muscle/height2 (kg/m2) | 6.5±1.1 | 6.5±1.0 | 6.7±1.2 | 0.192 | |||||||||||||||||||||||||||||||||||||||||||||||||||||||||||||||||||||||||||||||||||||||||||||||
| Bone marrow density (g/cm2) | 2.4±0.6 | 2.5±0.5 | 2.5±0.4 | 0.553 | |||||||||||||||||||||||||||||||||||||||||||||||||||||||||||||||||||||||||||||||||||||||||||||||
| T-score | -1.7±1.1 | -1.5±1.2 | -1.4±1.1 | 0.018* | |||||||||||||||||||||||||||||||||||||||||||||||||||||||||||||||||||||||||||||||||||||||||||||||
| Functional assessment | |||||||||||||||||||||||||||||||||||||||||||||||||||||||||||||||||||||||||||||||||||||||||||||||||||
| Charlson Comorbidity index | 0.7±1.4 | 0.6±1.1 | 0.7±1.1 | 0.926 | |||||||||||||||||||||||||||||||||||||||||||||||||||||||||||||||||||||||||||||||||||||||||||||||
| SMAF | -0.1±0.3 | -0.1±0.3 | 0.0±0.2 | 0.456 | |||||||||||||||||||||||||||||||||||||||||||||||||||||||||||||||||||||||||||||||||||||||||||||||
| MNA-SF | 12.9±1.3 | 13.1±1.1 | 13.2±1.0 | 0.042* | |||||||||||||||||||||||||||||||||||||||||||||||||||||||||||||||||||||||||||||||||||||||||||||||
| CESD | 3.1±5.5 | 2.5±3.4 | 2.6±4.4 | 0.421 | |||||||||||||||||||||||||||||||||||||||||||||||||||||||||||||||||||||||||||||||||||||||||||||||
| MoCA | 26.9±2.3 | 27.5±2.1 | 27.8±2.0 | 0.006* | |||||||||||||||||||||||||||||||||||||||||||||||||||||||||||||||||||||||||||||||||||||||||||||||
| Physical assessment | |||||||||||||||||||||||||||||||||||||||||||||||||||||||||||||||||||||||||||||||||||||||||||||||||||
| Walking speed (m/s) | 1.9±0.6 | 1.8±0.6 | 1.8±0.4 | 0.061 | |||||||||||||||||||||||||||||||||||||||||||||||||||||||||||||||||||||||||||||||||||||||||||||||
| Grip strength (kg) | 28.7±8.7 | 28.0±8.0 | 27.9±8.2 | 0.500 | |||||||||||||||||||||||||||||||||||||||||||||||||||||||||||||||||||||||||||||||||||||||||||||||
| Five Chair Time (second) | 8.8±2.2 | 8.8±2.4 | 9.0±1.9 | 0.500 | |||||||||||||||||||||||||||||||||||||||||||||||||||||||||||||||||||||||||||||||||||||||||||||||
| Cardiovascular parameters | |||||||||||||||||||||||||||||||||||||||||||||||||||||||||||||||||||||||||||||||||||||||||||||||||||
| Systolic pressure (mmHg) | 128.9±16.5 | 126.3±18.8 | 131.7±20.2 | 0.274 | |||||||||||||||||||||||||||||||||||||||||||||||||||||||||||||||||||||||||||||||||||||||||||||||
| Diastolic pressure(mmHg) | 78.2±9.1 | 77.9±9.7 | 79.7±10.6 | 0.260 | |||||||||||||||||||||||||||||||||||||||||||||||||||||||||||||||||||||||||||||||||||||||||||||||
| Heart rate (bpm) | 68.2±10.5 | 68.3±8.5 | 69.8±10.0 | 0.204 | |||||||||||||||||||||||||||||||||||||||||||||||||||||||||||||||||||||||||||||||||||||||||||||||
| Uric acid(mg/dL) | 5.4±1.2 | 5.5±1.4 | 5.6±1.2 | 0.745 | |||||||||||||||||||||||||||||||||||||||||||||||||||||||||||||||||||||||||||||||||||||||||||||||
| Fasting glucose (mg/dL) | 95.6±15.0 | 95.1±12.2 | 97.6±15.2 | 0.356 | |||||||||||||||||||||||||||||||||||||||||||||||||||||||||||||||||||||||||||||||||||||||||||||||
| HbA1C (%) | 5.7±0.4 | 5.7±0.4 | 5.8±0.6 | 0.570 | |||||||||||||||||||||||||||||||||||||||||||||||||||||||||||||||||||||||||||||||||||||||||||||||
| Insulin (mIU/L) | 8.9±6.7 | 8.9±5.1 | 8.8±4.0 | 0.984 | |||||||||||||||||||||||||||||||||||||||||||||||||||||||||||||||||||||||||||||||||||||||||||||||
| HOMA-IR | 2.2±1.7 | 2.2±1.4 | 2.2±1.1 | 0.996 | |||||||||||||||||||||||||||||||||||||||||||||||||||||||||||||||||||||||||||||||||||||||||||||||
| Cholesterol (mg/dL) | 202.1±31.9 | 205.5±33.6 | 203.0±31.5 | 0.746 | |||||||||||||||||||||||||||||||||||||||||||||||||||||||||||||||||||||||||||||||||||||||||||||||
| Triglyceride (mg/dL) | 108.3±84.2 | 106.3±49.9 | 112.8±56.7 | 0.738 | |||||||||||||||||||||||||||||||||||||||||||||||||||||||||||||||||||||||||||||||||||||||||||||||
| High density lipoprotein cholesterol (mg/dL) | 62.7±17.1 | 60.2±14.0 | 58.9±15.1 | 0.199 | |||||||||||||||||||||||||||||||||||||||||||||||||||||||||||||||||||||||||||||||||||||||||||||||
| Low density lipoprotein cholesterol (mg/dL) | 115.9±28.2 | 120.9±29.0 | 119.7±28.0 | 0.447 | |||||||||||||||||||||||||||||||||||||||||||||||||||||||||||||||||||||||||||||||||||||||||||||||
| high sensitive CRP (mg/L) | 1.5±2.7 | 1.8±2.6 | 1.7±2.4 | 0.604 | |||||||||||||||||||||||||||||||||||||||||||||||||||||||||||||||||||||||||||||||||||||||||||||||
| homocysteine (mcmol/L) | 13.5±4.8 | 13.0±4.0 | 13.0±3.5 | 0.600 | |||||||||||||||||||||||||||||||||||||||||||||||||||||||||||||||||||||||||||||||||||||||||||||||
| Neutrophil to lymphocyte ratio | 1.8±0.8 | 1.8±0.8 | 1.9±0.9 | 0.600 | |||||||||||||||||||||||||||||||||||||||||||||||||||||||||||||||||||||||||||||||||||||||||||||||
| Platelet to lymphocyte ratio | 7.5±2.8 | 7.0±2.6 | 7.6±3.2 | 0.798 | |||||||||||||||||||||||||||||||||||||||||||||||||||||||||||||||||||||||||||||||||||||||||||||||
| Age related hormone | |||||||||||||||||||||||||||||||||||||||||||||||||||||||||||||||||||||||||||||||||||||||||||||||||||
| ACTH (pmol/L) | 19.6±11.7 | 16.9±8.0 | 16.0±7.4 | 0.013* | |||||||||||||||||||||||||||||||||||||||||||||||||||||||||||||||||||||||||||||||||||||||||||||||
| Cortisol (mcg/dL) | 10.9±4.2 | 10.0±4.1 | 10.5±3.7 | 0.258 | |||||||||||||||||||||||||||||||||||||||||||||||||||||||||||||||||||||||||||||||||||||||||||||||
| Growth hormone (ng/mL) | 1.7±1.7 | 1.3±1.5 | 1.7±1.9 | 0.295 | |||||||||||||||||||||||||||||||||||||||||||||||||||||||||||||||||||||||||||||||||||||||||||||||
| Insulin-Like Growth Factor 1 (ng/ml) | 118.4±42.2 | 130.7±52.8 | 142.7±51.8 | 0.002** | |||||||||||||||||||||||||||||||||||||||||||||||||||||||||||||||||||||||||||||||||||||||||||||||
| DHEAS(μg/dL) | 114.2±63.9 | 118.9±76.6 | 126.1±74.1 | 0.462 | |||||||||||||||||||||||||||||||||||||||||||||||||||||||||||||||||||||||||||||||||||||||||||||||
| Testosterone (ng/dL) | 183.8±220.0 | 159.3±209.4 | 149.3±183.5 | 0.450 | |||||||||||||||||||||||||||||||||||||||||||||||||||||||||||||||||||||||||||||||||||||||||||||||
| Sex hormone binding protein (nmol/L) | 74.9±42.4 | 67.3±36.4 | 63.8±35.5 | 0.097 | |||||||||||||||||||||||||||||||||||||||||||||||||||||||||||||||||||||||||||||||||||||||||||||||
| General biochemistry data | |||||||||||||||||||||||||||||||||||||||||||||||||||||||||||||||||||||||||||||||||||||||||||||||||||
| WBC (x10^3/uL) | 5.4±1.1 | 5.2±1.4 | 5.5±1.3 | 0.764 | |||||||||||||||||||||||||||||||||||||||||||||||||||||||||||||||||||||||||||||||||||||||||||||||
| Hemoglobin (g/dL) | 14.0±1.3 | 13.9±1.4 | 13.9±1.2 | 0.838 | |||||||||||||||||||||||||||||||||||||||||||||||||||||||||||||||||||||||||||||||||||||||||||||||
| Platelet (x10^3/uL) | 240.0±49.7 | 231.9±50.3 | 240.2±56.2 | 0.975 | |||||||||||||||||||||||||||||||||||||||||||||||||||||||||||||||||||||||||||||||||||||||||||||||
| Neutrophil (%) | 56.1±9.3 | 56.4±8.3 | 57.6±8.6 | 0.208 | |||||||||||||||||||||||||||||||||||||||||||||||||||||||||||||||||||||||||||||||||||||||||||||||
| Lymphocyte (%) | 34.4±8.7 | 35.4±8.3 | 34.1±8.2 | 0.816 | |||||||||||||||||||||||||||||||||||||||||||||||||||||||||||||||||||||||||||||||||||||||||||||||
| AST (U/L) | 26.6±7.5 | 25.9±6.2 | 24.3±5.0 | 0.008** | |||||||||||||||||||||||||||||||||||||||||||||||||||||||||||||||||||||||||||||||||||||||||||||||
| ALT(U/L) | 24.8±12.8 | 24.9±10.1 | 23.0±7.4 | 0.186 | |||||||||||||||||||||||||||||||||||||||||||||||||||||||||||||||||||||||||||||||||||||||||||||||
| Albumin (g/dL) | 4.5±0.2 | 4.5±0.2 | 4.5±0.2 | 0.769 | |||||||||||||||||||||||||||||||||||||||||||||||||||||||||||||||||||||||||||||||||||||||||||||||
| Globulin(g/dL) | 2.9±0.3 | 2.9±0.3 | 2.9±0.4 | 0.805 | |||||||||||||||||||||||||||||||||||||||||||||||||||||||||||||||||||||||||||||||||||||||||||||||
| Blood Urea Nitrogen (mg/dL) | 16.4±4.6 | 15.6±3.2 | 15.5±2.8 | 0.117 | |||||||||||||||||||||||||||||||||||||||||||||||||||||||||||||||||||||||||||||||||||||||||||||||
| Creatinine(mg/dL) | 0.8±0.2 | 0.8±0.2 | 0.8±0.2 | 0.337 | |||||||||||||||||||||||||||||||||||||||||||||||||||||||||||||||||||||||||||||||||||||||||||||||
| eGFR (mL/min/1.73 m2) | 89.4±19.8 | 91.1±16.2 | 89.7±16.3 | 0.773 | |||||||||||||||||||||||||||||||||||||||||||||||||||||||||||||||||||||||||||||||||||||||||||||||
| Urine microalbumin creatinine ratio | 51.5±177.5 | 16.4±29.6 | 19.8±57.9 | 0.035* | |||||||||||||||||||||||||||||||||||||||||||||||||||||||||||||||||||||||||||||||||||||||||||||||
| *denotes p<0.05; **denotes p<0.01, bold type denotes statistical significance. | |||||||||||||||||||||||||||||||||||||||||||||||||||||||||||||||||||||||||||||||||||||||||||||||||||
| SMAF denotes the Functional Autonomy Measurement System; MNA-SF denotes Short-Form Mini-Nutritional Assessment; CESD denotes Center for Epidemiologic Studies Depression Scale; MoCA denotes the Montreal Cognitive Assessment ACTH denotes; Adrenocorticotropic hormone; DHEA denotes Dehydroepiandrosterone-sulfate; AST denotes aspartate Aminotransferase; ALT denotes alanine aminotransferase. | |||||||||||||||||||||||||||||||||||||||||||||||||||||||||||||||||||||||||||||||||||||||||||||||||||
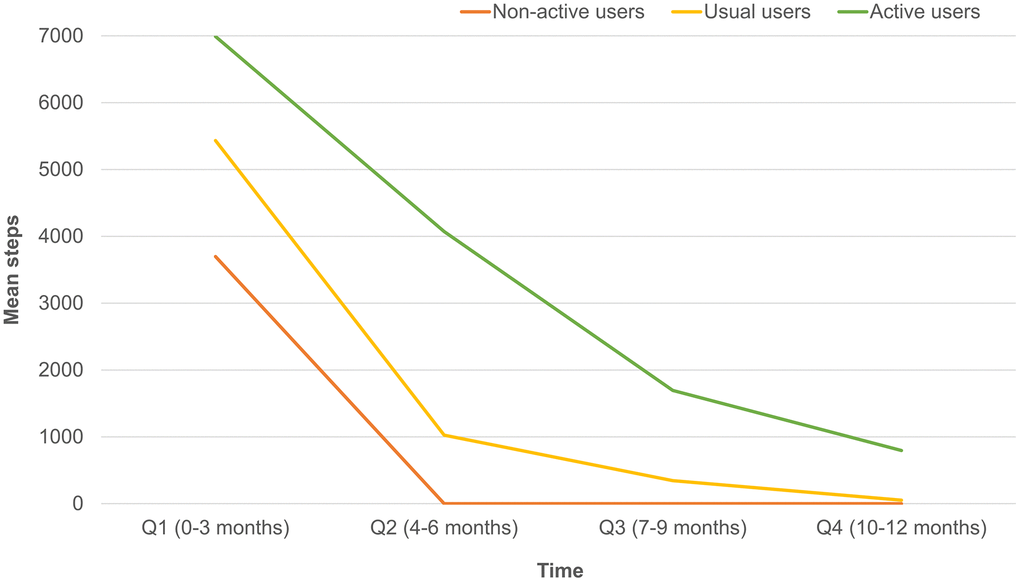
Figure 2. Differences of mean daily steps by quarters in non-active, usual and active users.
Table 2. Multiple linear regression to explore associations between wearable device users and 12-month walking speed changes.
| 12-month differences | Usual user (vs. non-active user) | Active user (vs. non-active user) | |||||||||||||||||||||||||||||||||||||||||||||||||||||||||||||||||||||||||||||||||||||||||||||||||
| Coefficients | Standard error | p | Coefficients | Standard error | p | ||||||||||||||||||||||||||||||||||||||||||||||||||||||||||||||||||||||||||||||||||||||||||||||
| Physical assessment | |||||||||||||||||||||||||||||||||||||||||||||||||||||||||||||||||||||||||||||||||||||||||||||||||||
| Walking speed (m/s) | 0.10 | 0.08 | 0.228 | 0.16 | 0.08 | 0.034* | |||||||||||||||||||||||||||||||||||||||||||||||||||||||||||||||||||||||||||||||||||||||||||||
| Hand grip strength (kg) | 0.16 | 0.48 | 0.743 | 0.10 | 0.45 | 0.828 | |||||||||||||||||||||||||||||||||||||||||||||||||||||||||||||||||||||||||||||||||||||||||||||
| Five chair stand time (second) | -0.30 | 0.33 | 0.366 | -0.32 | 0.31 | 0.305 | |||||||||||||||||||||||||||||||||||||||||||||||||||||||||||||||||||||||||||||||||||||||||||||
| Number of frail phenotypes | 0.17 | 0.11 | 0.131 | 0.10 | 0.10 | 0.354 | |||||||||||||||||||||||||||||||||||||||||||||||||||||||||||||||||||||||||||||||||||||||||||||
| Functional assessment | |||||||||||||||||||||||||||||||||||||||||||||||||||||||||||||||||||||||||||||||||||||||||||||||||||
| SMAF | 0.03 | 0.05 | 0.532 | -0.05 | 0.05 | 0.226 | |||||||||||||||||||||||||||||||||||||||||||||||||||||||||||||||||||||||||||||||||||||||||||||
| MNA-SF | -0.06 | 0.19 | 0.751 | 0.01 | 0.18 | 0.935 | |||||||||||||||||||||||||||||||||||||||||||||||||||||||||||||||||||||||||||||||||||||||||||||
| CESD | -0.13 | 0.48 | 0.796 | -0.20 | 0.46 | 0.655 | |||||||||||||||||||||||||||||||||||||||||||||||||||||||||||||||||||||||||||||||||||||||||||||
| MoCA | -0.36 | 0.34 | 0.289 | -0.61 | 0.32 | 0.054 | |||||||||||||||||||||||||||||||||||||||||||||||||||||||||||||||||||||||||||||||||||||||||||||
| Blood pressure measurements | |||||||||||||||||||||||||||||||||||||||||||||||||||||||||||||||||||||||||||||||||||||||||||||||||||
| Systolic pressure (mmHg) | 0.88 | 2.07 | 0.670 | -0.77 | 1.95 | 0.693 | |||||||||||||||||||||||||||||||||||||||||||||||||||||||||||||||||||||||||||||||||||||||||||||
| Diastolic pressure(mmHg) | 0.15 | 1.26 | 0.905 | -1.13 | 1.19 | 0.343 | |||||||||||||||||||||||||||||||||||||||||||||||||||||||||||||||||||||||||||||||||||||||||||||
| Heart rate (bpm) | 1.66 | 1.58 | 0.293 | 1.00 | 1.49 | 0.500 | |||||||||||||||||||||||||||||||||||||||||||||||||||||||||||||||||||||||||||||||||||||||||||||
| *denotes p<0.05; bold type denotes statistical significance. | |||||||||||||||||||||||||||||||||||||||||||||||||||||||||||||||||||||||||||||||||||||||||||||||||||
| SMAF denotes the Functional Autonomy Measurement System; MNA-SF denotes Short-Form Mini-Nutritional Assessment; CESD denotes Center for Epidemiologic Studies Depression Scale; MoCA denotes the Montreal Cognitive Assessment. | |||||||||||||||||||||||||||||||||||||||||||||||||||||||||||||||||||||||||||||||||||||||||||||||||||
Compared to usual users, active users had significantly higher average daily walking steps, higher weekday and holiday daily walking steps, lower weekday and holiday low step ratios, and higher weekday high step ratio (Table 3). Table 4 showed results of multiple linear regressions on associations between individual parameters obtained from the wearable devices and changes of walking speed. Among all parameters, high holiday step ratio had higher incremental walking speed for 0.5 m/s. Stepwise multinomial logistic regression showed that higher cognitive performance (Odds ratio (OR): 1.3, 95%CI: 1.1-1.5, p=0.005), and fewer education years (OR:0.89, 95%CI: 0.90-0.98, p=0.022) were significantly associated with active wearable device use (Supplementary Table 1). A sensitivity analysis done by using multinomial logistic regression adjusted for age, sex, education, CCI affirmed that MoCA performance (OR: 1.18, 95%CI: 1.02-1.36, p=0.028) was significantly associated with active wearable device use.
Table 3. Parameters of wearable devices between usual and active users.
| Usual + active users | Usual users | Active users | p value | ||||||||||||||||||||||||||||||||||||||||||||||||||||||||||||||||||||||||||||||||||||||||||||||||
| n | 226 | 98 | 128 | ||||||||||||||||||||||||||||||||||||||||||||||||||||||||||||||||||||||||||||||||||||||||||||||||
| Average steps (per 1000 steps) | 6.3±3.2 | 5.5±3.1 | 6.9±3.1 | 0.001** | |||||||||||||||||||||||||||||||||||||||||||||||||||||||||||||||||||||||||||||||||||||||||||||||
| Average weekday steps (per 1000 steps) | 6.5±3.3 | 5.6±3.2 | 7.1±3.2 | 0.001** | |||||||||||||||||||||||||||||||||||||||||||||||||||||||||||||||||||||||||||||||||||||||||||||||
| Average holiday steps (per 1000 steps) | 5.8±3.4 | 5.2±3.7 | 6.3±3.0 | 0.010* | |||||||||||||||||||||||||||||||||||||||||||||||||||||||||||||||||||||||||||||||||||||||||||||||
| Weekday low step ratio | 0.3±0.3 | 0.4±0.3 | 0.2±0.2 | <.001** | |||||||||||||||||||||||||||||||||||||||||||||||||||||||||||||||||||||||||||||||||||||||||||||||
| Holiday low step ratio | 0.3±0.3 | 0.4±0.4 | 0.3±0.2 | 0.007** | |||||||||||||||||||||||||||||||||||||||||||||||||||||||||||||||||||||||||||||||||||||||||||||||
| Weekday high step ratio | 0.2±0.2 | 0.2±0.2 | 0.3±0.2 | 0.048* | |||||||||||||||||||||||||||||||||||||||||||||||||||||||||||||||||||||||||||||||||||||||||||||||
| Holiday high step ratio | 0.2±0.2 | 0.2±0.3 | 0.2±0.2 | 0.510 | |||||||||||||||||||||||||||||||||||||||||||||||||||||||||||||||||||||||||||||||||||||||||||||||
| *denotes p<0.05; **denotes p<0.01, bold type denotes statistical significance. Data showed mean ± SD or number (%). | |||||||||||||||||||||||||||||||||||||||||||||||||||||||||||||||||||||||||||||||||||||||||||||||||||
Table 4. Associations between parameters of wearable device and 12-month walking speed changes.
| Coefficients | Standard error | p | |||||||||||||||||||||||||||||||||||||||||||||||||||||||||||||||||||||||||||||||||||||||||||||||||
| Average steps (per 1000 steps) | 0.03 | 0.01 | 0.020* | ||||||||||||||||||||||||||||||||||||||||||||||||||||||||||||||||||||||||||||||||||||||||||||||||
| Average weekday steps (per 1000 steps) | 0.02 | 0.01 | 0.045* | ||||||||||||||||||||||||||||||||||||||||||||||||||||||||||||||||||||||||||||||||||||||||||||||||
| Average holiday steps (per 1000 steps) | 0.03 | 0.01 | 0.007** | ||||||||||||||||||||||||||||||||||||||||||||||||||||||||||||||||||||||||||||||||||||||||||||||||
| Weekday low step ratio | -0.15 | 0.14 | 0.290 | ||||||||||||||||||||||||||||||||||||||||||||||||||||||||||||||||||||||||||||||||||||||||||||||||
| Holiday low step ratio | -0.25 | 0.12 | 0.040* | ||||||||||||||||||||||||||||||||||||||||||||||||||||||||||||||||||||||||||||||||||||||||||||||||
| Weekday high step ratio | 0.30 | 0.14 | 0.030* | ||||||||||||||||||||||||||||||||||||||||||||||||||||||||||||||||||||||||||||||||||||||||||||||||
| Holiday high step ratio | 0.50 | 0.14 | <.001** | ||||||||||||||||||||||||||||||||||||||||||||||||||||||||||||||||||||||||||||||||||||||||||||||||
| Multiple linear regression adjusted for age, sex, education, body mass index explored individual parameter and 12-month changes of walking speed. | |||||||||||||||||||||||||||||||||||||||||||||||||||||||||||||||||||||||||||||||||||||||||||||||||||
| *denotes p<0.05; **denotes p<0.01, bold type denotes statistical significance. Charlson comorbidity index, CES-D, and SMAF. Bold type denotes statistical significance. | |||||||||||||||||||||||||||||||||||||||||||||||||||||||||||||||||||||||||||||||||||||||||||||||||||
Discussion
The results of the current study clearly identified potential benefits of using wearable devices without specific physical activities programs in the middle-aged and older adults that the utilization of wearable devices significantly prevented walking speed slowing in a 12-month period. Among all participants, weekend warriors (higher high-holiday step ratio) were more likely to have faster walking speed. In general, mean walking steps in weekdays were higher than that in holidays, but active users had higher mean step counts in both weekdays and holidays. Compared to non-active users, cognitive performance was better in active users. Results of this study implied that people with better health and healthy lifestyles were also more likely to use the wearable devices. However, it is also possible that active use of wearable devices may improve users’ lifestyles and their functional performance.
Until now, only a few studies have evaluated the roles of wearable devices utilization in association with health outcomes of older adults. A study of 54 older adults ≥70 years from the primary care setting using pedometers for 12 weeks showed high acceptability and compliance for wearable devices but no significant differences in their step counts [17]. Another study of 130 overweight or obese participants with multimorbidity showed significant improvement of walking speed of 0.08 m/s in 8 weeks goal-setting interventions period [18]. Two other studies echoed the findings, which showed pedometer use with goal-setting program significantly increased daily steps and performance of timed up-and-go tests [14, 19]. These studies indicated that simply using the wearable devices may not change users’ behavior, accompanying intervention programs may be more important. Our previous study also disclosed that using pedometers among 440 community-dwelling older adults with some reinforcement from peers substantially motivated the willingness to adhere to the exercise programs and significantly improved walking speed for 0.06 m/s in 6 months [20].
The results of this current study further affirmed benefits of using wearable devices and extended the above-mentioned findings from the primary care setting or multimorbid participants to the healthy community-living adults. Our study findings suggested that active wearable devices were associated with 0.16 m/s faster walking speed than non-active users. A large pooled cohort study of 34,485 older adults reported that the incremental 0.1 m/s walking speed reduced 12% risk of 10-year mortality [5]. Among usual and active users, every incremental 1,000 average daily steps would increase 0.03 m/s of walking speed in 12 months. Moreover, booster walking steps of holiday warriors could improve walking speed for 0.5 m/s. The potential ceiling effects among active users may explain the differences of walking speed improvement between holiday warriors. In addition, serum levels of IGF-1 were positively associated with active wearable device users after adjustment for physical function (coefficient 22.9, p<0.001 for active users vs. non-active users). Our previous study showed that IGF-1 levels were significantly associated with muscle mass and its performance [21], which may suggest potential etiology for the health benefits of active wearable device use. In the study, gait speed was an independent measure from wearable device, whereas possible of using 5G to estimate gait speed in the future may provide a promising way to depict changes of walking.
Recent evidences linked slowness with impaired cognitive performance by shared neural substrate of hippocampus [22], and disrupted hippocampus-amygdala-cerebellum connections [23]. Although slow walking speed predicted the progression of cognitive declines [24], active wearable device utilization did not substantially improve cognitive performance. However, combined wearable device use and multidomain health promotion activities attenuated physio-cognitive declines of older adults [25], which may reduce the risk of disability, dementia and mortality in the long-term. The wearable device is more than an activity monitoring tool, but also a motivating factor to carry on healthy lifestyles [26]. The behavior of using wearable devices may not trigger the vigorous exercise to hinder cognitive decline, so the combination of multidomain health promotion activities is needed. Substantial dropping usage of wearable device suggested potential difficulties in sustaining benefits from the devices, in which reminders or motivation programs may enhance their adherence [20].
This study showed that participants with better cognitive function, independent of education years, were more likely to be active wearable device users. A recent study of 214 older adults aged ≥65 years in the United States showed that higher education and having fewer chronic conditions were positively associated with wearable device use [27]. Based on the technology acceptance model, perceived ease of use, perceived usefulness, users’ attitudes and behavioral intentions were all important factors for use of wearable devices [28]. Better cognitive performance facilitated older adults in comprehending the above-mentioned factors and tend to become active users. The average daily step counts of 6,284 among participants in this study were higher than previous studies, e.g. 5,138 in multimorbid obese participants, and 5,804 participants with chronic obstructive pulmonary disease [18, 29], but the conventional goal for daily 10,000 steps has been argued as unrealistic target for older people [30]. The current study showed an average daily step count of 7,000 may be a pragmatic goal for older adults, and was also the optimal target of 6,500-8,500 steps to prevent cardiovascular events [31].
Despite all efforts went in this study, there are still some limitations. First, the study did not collect information of personal interests for physical activities and leisure activities, which may confound the results collected from the wearable device. However, major determinants of health literacy such as age, education, and physical function were considered and full adjusted in our model as the previous study [32]. Second, increasing daily step counts were associated with faster walking, but the causal relationship remained unclear and the reverse causality may be a possible interpretation. Third, sex-specific analysis and other subgroup analysis were not conducted due to the limited sample size.
In conclusion, the study concluded the wearable device utilization patterns were associated with subsequent health benefits and increased the daily walking step counts and the walking speed. The benefits of active wearable device use deserve further attentions for the healthcare professionals and policymakers as the tool to promote healthy longevity.
Materials and Methods
Participants and study design
This was a prospective cohort study conducted in Taipei City, Taiwan from November 2017 to April 2019. Participants were invited for participation if they met inclusion criteria as follows: 1) community-living adults aged between 50 and 85 years, 2) not having terminal illness or malignancy needing active treatment, and 3) able to communicate and sign the informed consent. All participants completed face-to-face interview and physical examinations for their demographic characteristics, past and personal history, and functional assessments by well-trained research staff. All participants were provided with the wearable device (Lifebeat, NeuroSky, Inc. CA, USA) to record physical activities by built-in pedometers and to estimate physical activities. The data were linked to the research team through the blue tooth transmission via their mobile phone application for further analysis.
The observational design and reporting format of this study followed STROBE guidelines [33]. The study design and procedures conformed to the principles of the Declaration of Helsinki. All participants were fully informed and provided written informed consent. The Institutional Review Board of National Yang-Ming University approved the study protocol (YM104121F-4).
Parameters collected by the wearable device
All participants were categorized into non-active, usual and active users based on the utilization of their wearable devices and the completeness of data transmission to the research team. Those who used the wearable devices and completed data transmission for > 30 days in the follow-up period (at least once in both weekdays and weekend) were referred as active users; those used wearable devices for more than 3 days but not meeting the above-mentioned criteria were denoted as usual users [34]. Participants who only used the device in the first few days after enrollment without further data input were defined as non-active users.
Average step counts were defined as the mean of accumulated daily steps (per 1,000 steps) by the wearable device. Daily average step counts on weekday and holidays were recorded separately. Average daily steps ≥ 10,000 steps were defined as high daily steps [30], and the frequency of high weekday daily steps and holiday daily steps divided by all observed weekdays and holiday counts were defined as high weekday and holiday ratio, respectively. Those who had average daily step counts lower than one standard deviation of the mean, i.e., 3100 steps per day, were defined as low average daily step counts. Low weekday and holiday ratio of step counts were calculated accordingly.
Outcomes
The main outcome of this study was the differences of usual walking speed during the study period, which was measured by a 6-meter walking test with non-accelerated start and non-decelerated stop. Participants walked at usual pacing along a flat, straight indoor space with a one-meter approach allowed before reaching the start mark and continuing walking past the end of six-meter path for a further meter. Research nurses timed their walking at baseline and 12 months later for comparisons. Secondary outcomes included handgrip strength, performance of 5-time sit-to-stand test and other functional tests. The maximum of three trials measured by a dominant hand at a sitting position with a flexion elbow was recorded as the handgrip strength. For 5-time sit-to-stand test, participants were instructed to stand up as quickly as possible for 5 times from the chair, and the research staff would time the process [35]. All participants also underwent serial functional assessments, including assessments for depressive symptoms, cognitive performance, physical function and nutritional status. The Center for Epidemiologic Studies Depression Scale (CES-D) was used to assess depressive symptoms and components for physical frailty [36]. The Functional Autonomy Measurement System (SMAF) was used to assess activities and instrumental activities of daily living [37], and a negative score indicated the presence of physical disability. The Montreal Cognitive Assessment (MoCA) was employed to evaluate the cognitive performance of all participants [38], and the short-form mini-nutritional assessment (MNA-SF) was used to assess for the nutritional status [39].
Other variables
Demographic data including age, sex, education years, body height, body weight, health behaviors were carefully recorded by the research staff. The Charlson’s comorbidity index was used to estimate the diseases burden [40]. The average of three blood pressure readings under standard measurement procedures was taken for analysis. All participants received venous blood sampling after the 10-hour overnight fast. Serial biomarkers related to cardiometabolic health, hormones and biochemistry were tested for all participants, including fasting glucose, glycolated hemoglobin A1c (HbA1c), total cholesterol, triglyceride, and high density lipoprotein cholesterol (HDL-C), low density lipoprotein cholesterol (LDL-C), insulin level, HOMA-insulin resistance, and uric acid; inflammatory biomarkers (white blood cell, neutrophil to lymphocyte ratio, and platelet to lymphocyte ratio, homocysteine, and high sensitivity C reactive protein (hs-CRP)); age-related hormone (adrenocorticotropic hormone (ACTH), cortisol, growth hormone, insulin-like growth factor 1 (IGF-1), dehydroepiandrosterone-sulfate (DHEA-S), testosterone, sex hormone binding protein), and general biochemistry.
Statistical analysis
Numerical variables were expressed as mean plus/minus standard deviation, and categorical variables were as number (percentage). One-way ANOVA was used to compare numerical differences across different status of wearable devices users, and chi square test was to compare categorical variables. Crude and multivariable linear regressions were used to explore associations between the use of wearable devices and changes of 12-month walking speed, handgrip strength, five times sit-to-stand test, SMAF, MNA-SF, CESD, MoCA and blood pressure measurements. Multivariable logistic regression was used to evaluate independent associated factors for the status of wearable device use. On those usual and active users, parameters of walking steps and patterns of physical activities were compared by student t test and multiple linear regression was used to evaluate their associations and changes of walking speed over 12 months. Youden’s index summarized the ROC analysis statistics was used to determine optimal average daily steps to prevent slowing walking speed [41].
For the analysis of using patterns of wearable devices, we used student t test to compare differences in individual parameters of wearable devices on usual and active users. Multivariable linear regression was used to explore associations between parameters of wearable devices and incremental walking speed among usual and active users. Stepwise multivariable multinomial logistic regression explored independent associated factors of usual and active users.
All analyses were performed using the SAS statistical package, version 9.4 (SAS Institute, Inc., Cary, NC, USA). A p-value from two-sided tests < 0.05, or 95% confidence intervals not spanning the null hypothesis values were considered statistically significant.
Supplementary Materials
Author Contributions
W.J.L. L.N.P. C.H.L. and L.K.C. designed the study and W.J.L. conducted the main statistical analysis and W.J.L. wrote the main manuscript and W.J.L. L.N.P. C.H.L. and L.K.C. provided critical comments on results and discussion. All authors reviewed the manuscript.
Acknowledgments
The authors express their gratitude to the staffs from the National Yang Ming Chiao Tung University for data gathering; Ke-Han Pan and Yun-Hsuan Chan from Acer Inc for data integration and assistance in data analysis, and to all the participants.
Conflicts of Interest
The authors declared no Conflicts of interest.
Funding
This work was supported by the Aging and Health Research Center, National Yang Ming Chiao Tung University, Fubon Financial Holding Co., Ltd., and the Ministry of Science and Technology of Taiwan (MOST 108-2634-F-010-001 and MOST 110-2321-B-010-007).
References
- 1. Kay M, Santos J, Takane M. mHealth: New horizons for health through mobile technologies. World Health Organization. 2011; 64:66–71.
- 2. Collins FS, Varmus H. A new initiative on precision medicine. N Engl J Med. 2015; 372:793–95. https://doi.org/10.1056/NEJMp1500523 [PubMed]
- 3. Chen LK. Integrated Care for Older People: Solutions to Care Fragmentation. Aging Medicine and Healthcare. 2019; 3:94–95. https://doi.org/10.33879/AMH.2019.1921
- 4. Veronese N, Stubbs B, Volpato S, Zuliani G, Maggi S, Cesari M, Lipnicki DM, Smith L, Schofield P, Firth J, Vancampfort D, Koyanagi A, Pilotto A, Cereda E. Association Between Gait Speed With Mortality, Cardiovascular Disease and Cancer: A Systematic Review and Meta-analysis of Prospective Cohort Studies. J Am Med Dir Assoc. 2018; 19:981–88.e7. https://doi.org/10.1016/j.jamda.2018.06.007 [PubMed]
- 5. Studenski S, Perera S, Patel K, Rosano C, Faulkner K, Inzitari M, Brach J, Chandler J, Cawthon P, Connor EB, Nevitt M, Visser M, Kritchevsky S, et al. Gait speed and survival in older adults. JAMA. 2011; 305:50–58. https://doi.org/10.1001/jama.2010.1923 [PubMed]
- 6. Rasmussen LJ, Caspi A, Ambler A, Broadbent JM, Cohen HJ, d’Arbeloff T, Elliott M, Hancox RJ, Harrington H, Hogan S, Houts R, Ireland D, Knodt AR, et al. Association of Neurocognitive and Physical Function With Gait Speed in Midlife. JAMA Netw Open. 2019; 2:e1913123. https://doi.org/10.1001/jamanetworkopen.2019.13123 [PubMed]
- 7. Abellan van Kan G, Rolland Y, Andrieu S, Bauer J, Beauchet O, Bonnefoy M, Cesari M, Donini LM, Gillette Guyonnet S, Inzitari M, Nourhashemi F, Onder G, Ritz P, et al. Gait speed at usual pace as a predictor of adverse outcomes in community-dwelling older people an International Academy on Nutrition and Aging (IANA) Task Force. J Nutr Health Aging. 2009; 13:881–89. https://doi.org/10.1007/s12603-009-0246-z [PubMed]
- 8. Fenton SA, Neogi T, Dunlop D, Nevitt M, Doherty M, Duda JL, Klocke R, Abhishek A, Rushton A, Zhang W, Lewis CE, Torner J, Kitas G, White DK, and Multicenter Osteoarthritis Group. Does the intensity of daily walking matter for protecting against the development of a slow gait speed in people with or at high risk of knee osteoarthritis? An observational study. Osteoarthritis Cartilage. 2018; 26:1181–89. https://doi.org/10.1016/j.joca.2018.04.015 [PubMed]
- 9. Patel MS, Foschini L, Kurtzman GW, Zhu J, Wang W, Rareshide CA, Zbikowski SM. Using Wearable Devices and Smartphones to Track Physical Activity: Initial Activation, Sustained Use, and Step Counts Across Sociodemographic Characteristics in a National Sample. Ann Intern Med. 2017; 167:755–57. https://doi.org/10.7326/M17-1495 [PubMed]
- 10. Shin G, Jarrahi MH, Fei Y, Karami A, Gafinowitz N, Byun A, Lu X. Wearable activity trackers, accuracy, adoption, acceptance and health impact: A systematic literature review. J Biomed Inform. 2019; 93:103153. https://doi.org/10.1016/j.jbi.2019.103153 [PubMed]
- 11. Miyamoto SW, Henderson S, Young HM, Pande A, Han JJ. Tracking Health Data Is Not Enough: A Qualitative Exploration of the Role of Healthcare Partnerships and mHealth Technology to Promote Physical Activity and to Sustain Behavior Change. JMIR Mhealth Uhealth. 2016; 4:e5. https://doi.org/10.2196/mhealth.4814 [PubMed]
- 12. Jo A, Coronel BD, Coakes CE, Mainous AG 3rd. Is There a Benefit to Patients Using Wearable Devices Such as Fitbit or Health Apps on Mobiles? A Systematic Review. Am J Med. 2019; 132:1394–400.e1. https://doi.org/10.1016/j.amjmed.2019.06.018 [PubMed]
- 13. Chan CB, Ryan DA, Tudor-Locke C. Health benefits of a pedometer-based physical activity intervention in sedentary workers. Prev Med. 2004; 39:1215–22. https://doi.org/10.1016/j.ypmed.2004.04.053 [PubMed]
- 14. Snyder A, Colvin B, Gammack JK. Pedometer use increases daily steps and functional status in older adults. J Am Med Dir Assoc. 2011; 12:590–94. https://doi.org/10.1016/j.jamda.2010.06.007 [PubMed]
- 15. Atkins A, Cannell J, Barr C. Pedometers alone do not increase mobility in inpatient rehabilitation: a randomized controlled trial. Clin Rehabil. 2019; 33:1382–90. https://doi.org/10.1177/0269215519838312 [PubMed]
- 16. Adachi T, Kono Y, Iwatsu K, Shimizu Y, Yamada S. Duration of moderate to vigorous daily activity is negatively associated with slow walking speed independently from step counts in elderly women aged 75 years or over: A cross-sectional study. Arch Gerontol Geriatr. 2018; 74:94–99. https://doi.org/10.1016/j.archger.2017.10.003 [PubMed]
- 17. Sugden JA, Sniehotta FF, Donnan PT, Boyle P, Johnston DW, McMurdo ME. The feasibility of using pedometers and brief advice to increase activity in sedentary older women--a pilot study. BMC Health Serv Res. 2008; 8:169. https://doi.org/10.1186/1472-6963-8-169 [PubMed]
- 18. Takahashi PY, Quigg SM, Croghan IT, Schroeder DR, Ebbert JO. Effect of pedometer use and goal setting on walking and functional status in overweight adults with multimorbidity: a crossover clinical trial. Clin Interv Aging. 2016; 11:1099–106. https://doi.org/10.2147/CIA.S107626 [PubMed]
- 19. Talbot LA, Gaines JM, Huynh TN, Metter EJ. A home-based pedometer-driven walking program to increase physical activity in older adults with osteoarthritis of the knee: a preliminary study. J Am Geriatr Soc. 2003; 51:387–92. https://doi.org/10.1046/j.1532-5415.2003.51113.x [PubMed]
- 20. Chen LK, Hwang AC, Lee WJ, Peng LN, Lin MH, Neil DL, Shih SF, Loh CH, Chiou ST, and Taiwan Health Promotion Intervention Study for Elders research group. Efficacy of multidomain interventions to improve physical frailty, depression and cognition: data from cluster-randomized controlled trials. J Cachexia Sarcopenia Muscle. 2020; 11:650–62. https://doi.org/10.1002/jcsm.12534 [PubMed]
- 21. Chen LY, Wu YH, Liu LK, Lee WJ, Hwang AC, Peng LN, Lin MH, Chen LK. Association Among Serum Insulin-Like Growth Factor-1, Frailty, Muscle Mass, Bone Mineral Density, and Physical Performance Among Community-Dwelling Middle-Aged and Older Adults in Taiwan. Rejuvenation Res. 2018; 21:270–77. https://doi.org/10.1089/rej.2016.1882 [PubMed]
- 22. Rosso AL, Verghese J, Metti AL, Boudreau RM, Aizenstein HJ, Kritchevsky S, Harris T, Yaffe K, Satterfield S, Studenski S, Rosano C. Slowing gait and risk for cognitive impairment: The hippocampus as a shared neural substrate. Neurology. 2017; 89:336–42. https://doi.org/10.1212/WNL.0000000000004153 [PubMed]
- 23. Liu LK, Chou KH, Hsu CH, Peng LN, Lee WJ, Chen WT, Lin CP, Chung CP, Wang PN, Chen LK. Cerebellar-limbic neurocircuit is the novel biosignature of physio-cognitive decline syndrome. Aging (Albany NY). 2020; 12:25319–36. https://doi.org/10.18632/aging.104135 [PubMed]
- 24. Hoogendijk EO, Rijnhart JJ, Skoog J, Robitaille A, van den Hout A, Ferrucci L, Huisman M, Skoog I, Piccinin AM, Hofer SM, Muniz Terrera G. Gait speed as predictor of transition into cognitive impairment: Findings from three longitudinal studies on aging. Exp Gerontol. 2020; 129:110783. https://doi.org/10.1016/j.exger.2019.110783 [PubMed]
- 25. Liang CK, Lee WJ, Hwang AC, Lin CS, Chou MY, Peng LN, Lin MH, Chen LK. Efficacy of Multidomain Intervention Against Physio-cognitive Decline Syndrome: A Cluster-randomized Trial. Arch Gerontol Geriatr. 2021; 95:104392. https://doi.org/10.1016/j.archger.2021.104392 [PubMed]
- 26. Strain T, Wijndaele K, Dempsey PC, Sharp SJ, Pearce M, Jeon J, Lindsay T, Wareham N, Brage S. Wearable-device-measured physical activity and future health risk. Nat Med. 2020; 26:1385–91. https://doi.org/10.1038/s41591-020-1012-3 [PubMed]
- 27. Li L, Peng W, Kononova A, Bowen M, Cotten SR. Factors Associated with Older Adults’ Long-Term Use of Wearable Activity Trackers. Telemed J E Health. 2020; 26:769–75. https://doi.org/10.1089/tmj.2019.0052 [PubMed]
- 28. Davis FD, Bagozzi RP, Warshaw PR. User acceptance of computer technology: a comparison of two theoretical models. Management science. 1989; 35:982–1003. https://doi.org/10.1287/mnsc.35.8.982
- 29. Moy ML, Teylan M, Weston NA, Gagnon DR, Garshick E. Daily step count predicts acute exacerbations in a US cohort with COPD. PLoS One. 2013; 8:e60400. https://doi.org/10.1371/journal.pone.0060400 [PubMed]
- 30. Tudor-Locke C, Bassett DR
Jr . How many steps/day are enough? Preliminary pedometer indices for public health. Sports Med. 2004; 34:1–8. https://doi.org/10.2165/00007256-200434010-00001 [PubMed] - 31. Ayabe M, Brubaker PH, Dobrosielski D, Miller HS, Kiyonaga A, Shindo M, Tanaka H. Target step count for the secondary prevention of cardiovascular disease. Circ J. 2008; 72:299–303. https://doi.org/10.1253/circj.72.299 [PubMed]
- 32. Sun X, Shi Y, Zeng Q, Wang Y, Du W, Wei N, Xie R, Chang C. Determinants of health literacy and health behavior regarding infectious respiratory diseases: a pathway model. BMC Public Health. 2013; 13:261. https://doi.org/10.1186/1471-2458-13-261 [PubMed]
- 33. von Elm E, Altman DG, Egger M, Pocock SJ, Gøtzsche PC, Vandenbroucke JP, and STROBE Initiative. The Strengthening the Reporting of Observational Studies in Epidemiology (STROBE) statement: guidelines for reporting observational studies. J Clin Epidemiol. 2008; 61:344–49. https://doi.org/10.1016/j.jclinepi.2007.11.008 [PubMed]
- 34. Mercer K, Giangregorio L, Schneider E, Chilana P, Li M, Grindrod K. Acceptance of Commercially Available Wearable Activity Trackers Among Adults Aged Over 50 and With Chronic Illness: A Mixed-Methods Evaluation. JMIR Mhealth Uhealth. 2016; 4:e7. https://doi.org/10.2196/mhealth.4225 [PubMed]
- 35. Whitney SL, Wrisley DM, Marchetti GF, Gee MA, Redfern MS, Furman JM. Clinical measurement of sit-to-stand performance in people with balance disorders: validity of data for the Five-Times-Sit-to-Stand Test. Phys Ther. 2005; 85:1034–45. [PubMed]
- 36. Radloff LS. The CES-D scale: A self-report depression scale for research in the general population. Applied psychological measurement. 1977; 1:385–401. https://doi.org/10.1177/014662167700100306
- 37. Hebert R, Carrier R, Bilodeau A. The Functional Autonomy Measurement System (SMAF): description and validation of an instrument for the measurement of handicaps. Age Ageing. 1988; 17:293–302. https://doi.org/10.1093/ageing/17.5.293 [PubMed]
- 38. Tsai CF, Lee WJ, Wang SJ, Shia BC, Nasreddine Z, Fuh JL. Psychometrics of the Montreal Cognitive Assessment (MoCA) and its subscales: validation of the Taiwanese version of the MoCA and an item response theory analysis. Int Psychogeriatr. 2012; 24:651–58. https://doi.org/10.1017/S1041610211002298 [PubMed]
- 39. Rubenstein LZ, Harker JO, Salvà A, Guigoz Y, Vellas B. Screening for undernutrition in geriatric practice: developing the short-form mini-nutritional assessment (MNA-SF). J Gerontol A Biol Sci Med Sci. 2001; 56:M366–72. https://doi.org/10.1093/gerona/56.6.m366 [PubMed]
- 40. Charlson ME, Pompei P, Ales KL, MacKenzie CR. A new method of classifying prognostic comorbidity in longitudinal studies: development and validation. J Chronic Dis. 1987; 40:373–83. https://doi.org/10.1016/0021-9681(87)90171-8 [PubMed]
- 41. Youden WJ. Index for rating diagnostic tests. Cancer. 1950; 3:32–35. https://doi.org/10.1002/1097-0142(1950)3:1<32::aid-cncr2820030106>3.0.co;2-3 [PubMed]