


Introduction
The global prevalence of dementia has greatly increased and became a major public health issue [1]. The estimated number of patients with dementia is projected to reach 106 million worldwide by 2050 [1]. Alzheimer’s disease (AD) is the most common type of dementia, with an incidence of 60% to 80% [2], but no preventive or disease-modifying therapies are currently available [1]. Hence, the detection of modifiable risk factors is of critical importance.
Obesity is a well-known risk factor for several cardiometabolic diseases including diabetes and cardiovascular disease, and certain types of cancer; recently, obesity has also emerged as an independent risk factor for AD and other forms of dementia [3–6]. Nevertheless, the relationship between the risk of AD and obesity or metabolic disturbances caused by obesity remains controversial, with inconsistent findings across studies [5, 7–11]. Some epidemiologic studies have suggested that obesity has a role in the development of AD, and this observation could be via several pathological alterations in obesity and insulin resistance, such as chronic inflammation and mitochondrial dysfunction [5, 7]. However, more recent studies have identified obesity as protective against dementia, which contradicts previous associations between obesity and AD [6, 8–11]. Furthermore, previously reported associations between obesity and AD should be carefully interpreted, as states of metabolic unhealthiness, such as hyperglycemia and dyslipidemia, are commonly combined with obesity and would confound the effect of obesity itself on the risk of AD [12].
“Metabolically healthy obese” (MHO) individuals are a subpopulation of obese people with a low burden of overt cardiometabolic abnormalities [13–16]. Several studies have reported that MHO people are neither at increased risk of cardiometabolic disease nor mortality compared with normal-weight controls [17, 18]. The prognostic value of MHO, however, could be largely dependent on health outcomes; indeed, a few recent studies have reported that MHO individuals are at even lower risk of AD than previously thought [2, 19].
However, in the obese population, metabolic health status is a modifiable condition. For instance, in the Multi-Ethnic Study of Atherosclerosis (MESA), nearly half of the participants with MHO at baseline progressed to metabolically unhealthy during the approximately 12-year follow-up period [20]. Another prospective cohort research with a 4-year follow-up found that 14.5% of the people with MHO at initial examination progressed to metabolically unhealthy obesity (MUO), whereas 29.0% of those with MUO at baseline recovered their metabolic health [21]. Although the risk of cardiometabolic complications could be influenced by these phenotypic transitions [20, 22, 23], there have been no data generated regarding the risk of AD according to dynamic changes of obesity and metabolic health status.
Therefore, we designed this study to clarify the implication of obesity and metabolic health on AD risk, taking into account phenotypical changes in obese metabolic health status, using a large-scale population dataset from a national health screening examination.
Results
Clinical and biochemical characteristics of the entire cohort at baseline examination
Our baseline study cohort included 136,847 people aged 60 or above (Figure 1). Table 1 shows the baseline characteristics of the participants categorized by the presence of obesity and the metabolic health status. The prevalences of MHNO, MHO, MUNO, and MUO individuals were 24.1% (n = 33,049), 7.6% (n = 10,445), 39.4% (n = 53,958), and 28.8% (n = 39,395), respectively. MHO subjects had higher levels of TG, LDL-C, and TC, but lower level of HDL-C, as compared to the referent lean and healthy individuals. MHO subjects, on the other hand, had better lipid profiles than MUNO or MUO subjects. More male subjects were included in the metabolically unhealthy groups (MUNO and MUO).
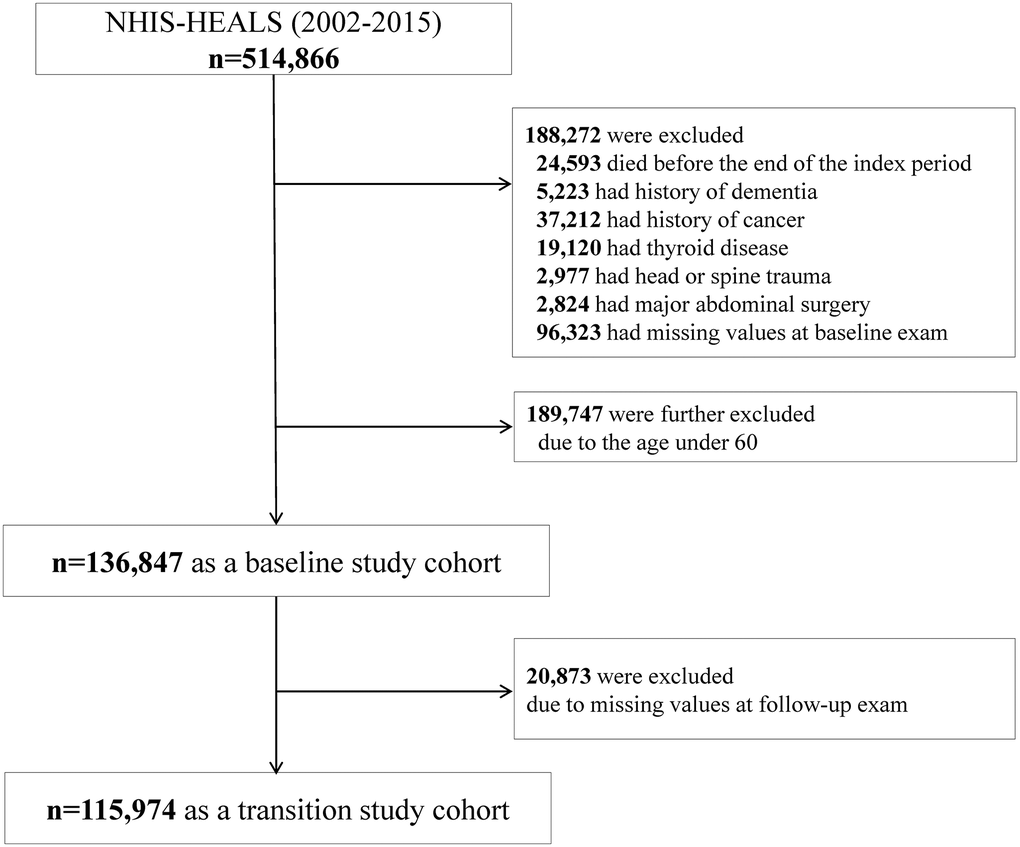
Figure 1. Study enrollment flowchart.
Table 1. Characteristics of study participants according to baseline metabolic health and obesity status.
| Baseline category BMI Metabolic health status | MHNO <25 kg/m2 0–1 risk factors | MHO ≥25 kg/m2 0–1 risk factors | MUNO <25 kg/m2 ≥2 risk factors | MUO ≥25 kg/m2 ≥2 risk factors | P value | ||||||||||||||||||||||||||||||||||||||||||||||||||||||||||||||||||||||||||||||||||||||||||||||
| n | 33, 049 (24.1) | 10, 445 (7.6) | 53, 958 (39.4) | 39, 395 (28.8) | |||||||||||||||||||||||||||||||||||||||||||||||||||||||||||||||||||||||||||||||||||||||||||||||
| Sex (% men) | 55.0 | 45.2 | 49.3 | 45.5 | <.0001 | ||||||||||||||||||||||||||||||||||||||||||||||||||||||||||||||||||||||||||||||||||||||||||||||
| Age (years) | 67.3 ± 6.0a | 66.4 ± 5.4a | 68.0 ± 6.0 | 67.1 ± 5.5 | <.0001 | ||||||||||||||||||||||||||||||||||||||||||||||||||||||||||||||||||||||||||||||||||||||||||||||
| BMI (kg/m2) | 21.9 ± 2.0 | 26.8 ± 1.7 | 22.6 ± 1.8 | 27.2 ± 1.9 | <.0001 | ||||||||||||||||||||||||||||||||||||||||||||||||||||||||||||||||||||||||||||||||||||||||||||||
| WC (cm) | 89.2 ± 6.8 | 87.8 ± 6.4 | 80.8 ± 6.5 | 89.7 ± 6.6 | <.0001 | ||||||||||||||||||||||||||||||||||||||||||||||||||||||||||||||||||||||||||||||||||||||||||||||
| Systolic BP (mmHg) | 122.6 ± 15.1 | 126.0 ± 14.8 | 131.3 ± 15.3 | 133.5 ± 15.0 | <.0001 | ||||||||||||||||||||||||||||||||||||||||||||||||||||||||||||||||||||||||||||||||||||||||||||||
| Diastolic BP (mmHg) | 74.9 ± 9.6 | 76.9 ± 9.6 | 79.5 ± 9.7 | 80.9 ± 9.7 | <.0001 | ||||||||||||||||||||||||||||||||||||||||||||||||||||||||||||||||||||||||||||||||||||||||||||||
| Smoking (%) | <.0001 | ||||||||||||||||||||||||||||||||||||||||||||||||||||||||||||||||||||||||||||||||||||||||||||||||||
| Smoker | 15.0 | 8.8 | 14.3 | 9.9 | |||||||||||||||||||||||||||||||||||||||||||||||||||||||||||||||||||||||||||||||||||||||||||||||
| Non-smoker | 85.0 | 91.2 | 85.7 | 90.1 | |||||||||||||||||||||||||||||||||||||||||||||||||||||||||||||||||||||||||||||||||||||||||||||||
| Drinking (%) | <.0001 | ||||||||||||||||||||||||||||||||||||||||||||||||||||||||||||||||||||||||||||||||||||||||||||||||||
| Non-heavy | 87.4 | 88.3 | 86.5 | 86.7 | |||||||||||||||||||||||||||||||||||||||||||||||||||||||||||||||||||||||||||||||||||||||||||||||
| Heavy | 12.6 | 11.7 | 13.5 | 13.3 | |||||||||||||||||||||||||||||||||||||||||||||||||||||||||||||||||||||||||||||||||||||||||||||||
| Physical activity (%) | <.0001 | ||||||||||||||||||||||||||||||||||||||||||||||||||||||||||||||||||||||||||||||||||||||||||||||||||
| None | 30.1 | 30.2 | 31.5 | 32.3 | |||||||||||||||||||||||||||||||||||||||||||||||||||||||||||||||||||||||||||||||||||||||||||||||
| 1–4 times/week | 36.2 | 36.7 | 35.9 | 37.2 | |||||||||||||||||||||||||||||||||||||||||||||||||||||||||||||||||||||||||||||||||||||||||||||||
| ≥5 times/week | 33.7 | 33.1 | 32.5 | 30.6 | |||||||||||||||||||||||||||||||||||||||||||||||||||||||||||||||||||||||||||||||||||||||||||||||
| Medical history (%) | |||||||||||||||||||||||||||||||||||||||||||||||||||||||||||||||||||||||||||||||||||||||||||||||||||
| Type 2 diabetes | 1.8 | 1.6 | 20.7 | 23.8 | <.0001 | ||||||||||||||||||||||||||||||||||||||||||||||||||||||||||||||||||||||||||||||||||||||||||||||
| HTN | 23.2 | 35.4 | 59.5 | 70.6 | <.0001 | ||||||||||||||||||||||||||||||||||||||||||||||||||||||||||||||||||||||||||||||||||||||||||||||
| Dyslipidemia | 4.3 | 4.3 | 35.8 | 42.2 | <.0001 | ||||||||||||||||||||||||||||||||||||||||||||||||||||||||||||||||||||||||||||||||||||||||||||||
| Income | |||||||||||||||||||||||||||||||||||||||||||||||||||||||||||||||||||||||||||||||||||||||||||||||||||
| Medical aid | 0.3 | 0.4 | 0.4 | 0.5 | <.0001 | ||||||||||||||||||||||||||||||||||||||||||||||||||||||||||||||||||||||||||||||||||||||||||||||
| Low | 37.4 | 36.8 | 38.5 | 38.4 | |||||||||||||||||||||||||||||||||||||||||||||||||||||||||||||||||||||||||||||||||||||||||||||||
| High | 62.2 | 62.9 | 61.1 | 61.1 | |||||||||||||||||||||||||||||||||||||||||||||||||||||||||||||||||||||||||||||||||||||||||||||||
| FPG (mg/dl) | 91.7 ± 13.2 | 92.0 ± 11.9 | 108.3 ± 29.1 | 109.9 ± 28.7 | <.0001 | ||||||||||||||||||||||||||||||||||||||||||||||||||||||||||||||||||||||||||||||||||||||||||||||
| TG (mg/dl) | 97.6 ± 42.9 | 106.0 ± 41.7 | 157.4 ± 93.3 | 171.9 ± 95.7 | <.0001 | ||||||||||||||||||||||||||||||||||||||||||||||||||||||||||||||||||||||||||||||||||||||||||||||
| LDL-C (mg/dl) | 59.6 ± 28.2 | 58.0 ± 27.2 | 52.1 ± 29.0 | 50.3 ± 24.8 | <.0001 | ||||||||||||||||||||||||||||||||||||||||||||||||||||||||||||||||||||||||||||||||||||||||||||||
| HDL-C (mg/dl) | 118.7 ± 33.9 | 124.8 ± 32.7 | 118.8 ± 40.1 | 120.2 ± 40.2 | <.0001 | ||||||||||||||||||||||||||||||||||||||||||||||||||||||||||||||||||||||||||||||||||||||||||||||
| TC (mg/dl) | 196.6 ± 33.4 | 202.9 ± 33.5a | 200.6 ± 40.4a | 203.2 ± 40.7 | <.0001 | ||||||||||||||||||||||||||||||||||||||||||||||||||||||||||||||||||||||||||||||||||||||||||||||
| Results reported as means ± SD, unless otherwise indicated. | |||||||||||||||||||||||||||||||||||||||||||||||||||||||||||||||||||||||||||||||||||||||||||||||||||
| All variables were statistically different among the 4 groups, unless otherwise indicated. | |||||||||||||||||||||||||||||||||||||||||||||||||||||||||||||||||||||||||||||||||||||||||||||||||||
| aNo statistical difference was observed. | |||||||||||||||||||||||||||||||||||||||||||||||||||||||||||||||||||||||||||||||||||||||||||||||||||
| Abbreviations: BMI: body mass index; BP: blood pressure; eGFR: estimated glomerular filtration rate; FPG: fasting plasma glucose; HDL-C: high-density lipoprotein cholesterol; HTN: hypertension; IBD: inflammatory bowel disease; LDL-C: low-density lipoprotein cholesterol; MHO: stable metabolically healthy obesity; MUO: metabolically unhealthy obesity; MUNO: metabolically unhealthy obesity; MHNO: metabolically healthy non-obesity; TC: total cholesterol; TG: triglyceride; WC: waist circumference. | |||||||||||||||||||||||||||||||||||||||||||||||||||||||||||||||||||||||||||||||||||||||||||||||||||
The risk of AD according to baseline metabolic health and obesity status
During the follow-up period (median, 71.5 months; interquartile ranges, 66.0–78.5), 7,043 of the 136,847 individuals (5.1%) developed AD. The crude incidence rate of AD was 4.7% (1,540/33,049) in the MHNO group, 3.6% (374/10,445) in the MHO group, 6.1% (3,272/53,958) in the MUNO group, and 4.7% (1,857/39,395) in the MUO group.
Table 2 demonstrates the risk of AD development according to the metabolic health and obesity status at baseline, without considering phenotypic transitions over time. Multivariable-adjusted HRs (95% CIs) of the MHO, MUNO, and MUO groups for AD were 0.73 (0.65–0.81), 1.28 (1.21–1.36), and 0.96 (0.90–1.03), respectively, relative to the MHNO group after adjusting for confounders (Table 2). Subjects in the MHO group had a significantly lower HR for AD, and MUNO subjects had a higher risk of developing dementia risk than the MHNO group.
Table 2. Risk of AD according to baseline metabolic health and obesity status.
| Baseline category BMI Metabolic health status | MHNO <25 kg/m2 0–1 risk factors | MHO ≥25 kg/m2 0–1 risk factors | MUNO <25 kg/m2 ≥2 risk factors | MUO ≥25 kg/m2 ≥2 risk factors | |||||||||||||||||||||||||||||||||||||||||||||||||||||||||||||||||||||||||||||||||||||||||||||||
| n (% of total) | 17, 812 (24.2) | 10, 445 (7.6) | 53, 958 (39.4) | 39, 395 (28.8) | |||||||||||||||||||||||||||||||||||||||||||||||||||||||||||||||||||||||||||||||||||||||||||||||
| Number of events (%) | 1, 540 (4.66) | 374 (3.58) | 3, 272 (6.06) | 1, 857 (4.71) | |||||||||||||||||||||||||||||||||||||||||||||||||||||||||||||||||||||||||||||||||||||||||||||||
| Crude HR (95% CI) | 1 (ref) | 0.76 (0.68–0.85) | 1.32 (1.24–1.40) | 1.01 (0.94–1.08) | |||||||||||||||||||||||||||||||||||||||||||||||||||||||||||||||||||||||||||||||||||||||||||||||
| Multivariable-adjusted HR (95% CI)a | 1 (ref) | 0.73 (0.65–0.81) | 1.28 (1.21–1.36) | 0.96 (0.90–1.03) | |||||||||||||||||||||||||||||||||||||||||||||||||||||||||||||||||||||||||||||||||||||||||||||||
| aAdjusted for baseline age, sex, income, smoking, alcohol drinking, and physical activities. | |||||||||||||||||||||||||||||||||||||||||||||||||||||||||||||||||||||||||||||||||||||||||||||||||||
| Abbreviations: MHO: stable metabolically healthy obesity; MUO: metabolically unhealthy obesity; MUNO; metabolically unhealthy obesity; MHNO: metabolically healthy non-obesity. | |||||||||||||||||||||||||||||||||||||||||||||||||||||||||||||||||||||||||||||||||||||||||||||||||||
Changes in metabolic phenotype at follow-up examinations
We investigated how obese metabolic health status would change over the follow-up period (Figure 2). Overall, 33.3% of the subjects experienced phenotypic changes during follow-up. In the baseline MHNO, MUNO, and MUO groups, more than half of the subjects maintained their baseline phenotypes at their follow-up visits, while 41.8% of the MHO individuals experienced no phenotype changes (the stable MHO group). In the MHNO group, 33.5% of the subjects were metabolically unhealthy at the end of follow-up: 30.4% became MUNO, and 3.1% became MUO; 3.5% transitioned to the MHO group. Among the individuals who were MUO at baseline, 10.6% recovered their metabolic health without changing their obesity status (i.e., transitioned from the MUO to MHO group).
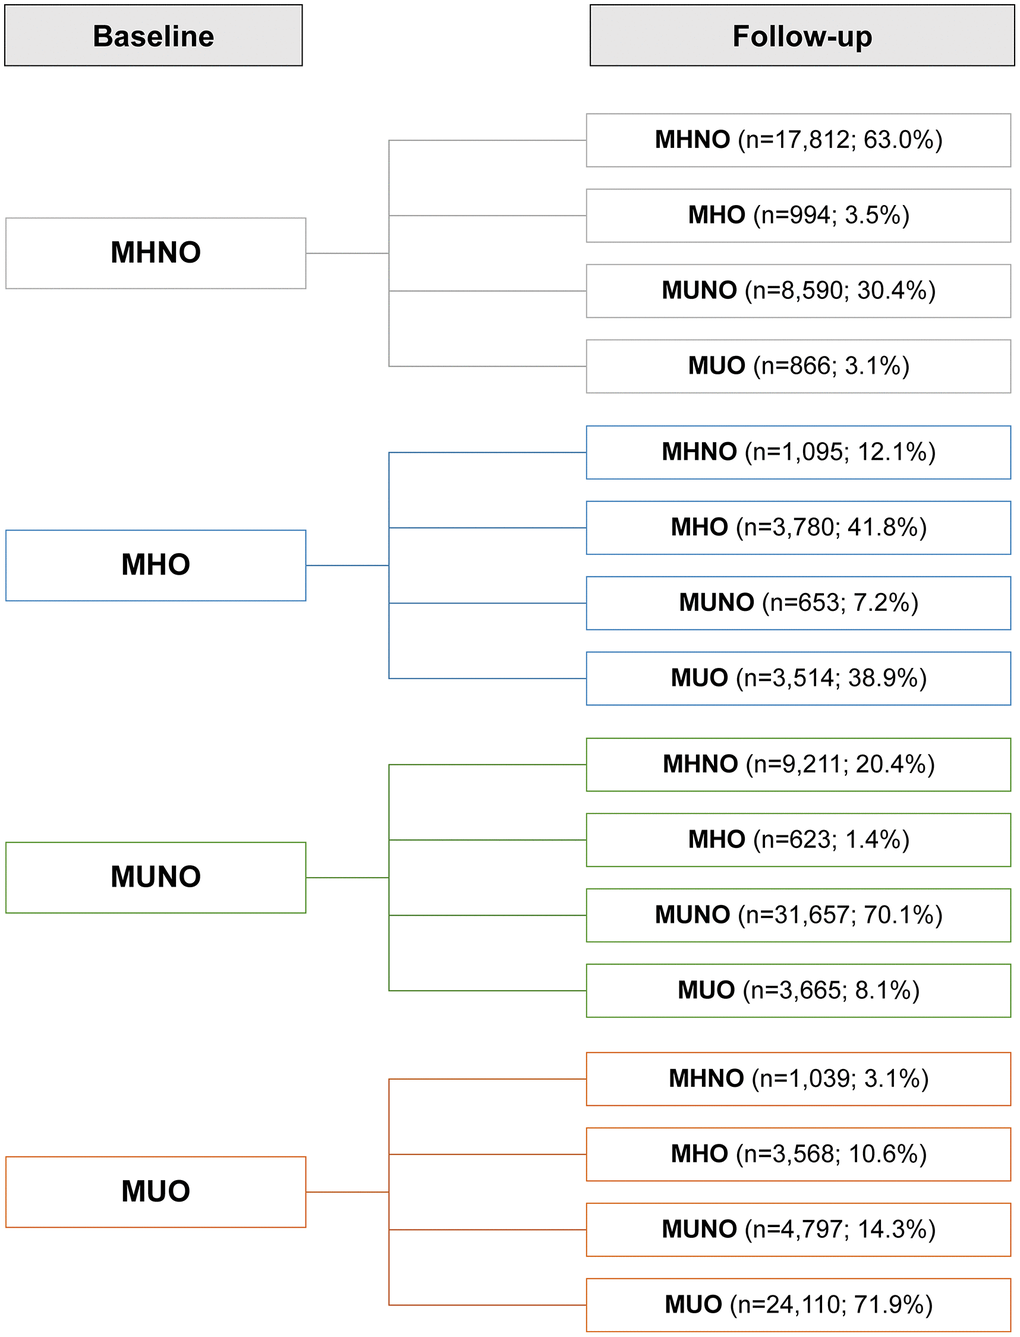
Figure 2. Prevalence of phenotypic transitions at follow-up visits. Abbreviations: MHO: stable metabolically healthy obesity; MUO: metabolically unhealthy obesity; MUNO: metabolically unhealthy obesity; MHNO: metabolically healthy non-obesity.
The risk of AD according to phenotypic transitions in metabolic health and obesity status
Table 3 and Figure 3 show the multivariable-adjusted HRs for AD among the 16 subgroups according to their metabolic and obese phenotypes considering the transitions, using the stable MHNO group as the reference. Compared with the stable MHNO group, the stable MHO group had a significantly lower risk of AD (multivariable-adjusted HR, 0.62; 95% CI, 0.50–0.77). The MHO subjects who experienced phenotypic transitions to any other phenotype were not significantly different from the reference group in terms of AD risk.
Table 3. Risk of AD according to transitions of metabolic health and obesity status.
| Baseline category | MHNO | ||||||||||||||||||||||||||||||||||||||||||||||||||||||||||||||||||||||||||||||||||||||||||||||||||
| Follow-up category | MHNO | MHO | MUNO | MUO | |||||||||||||||||||||||||||||||||||||||||||||||||||||||||||||||||||||||||||||||||||||||||||||||
| n (% of baseline category) | 17, 812 (63.0) | 994 (3.5) | 8, 590 (30.4) | 866 (3.1) | |||||||||||||||||||||||||||||||||||||||||||||||||||||||||||||||||||||||||||||||||||||||||||||||
| Number of events (%) | 661 (3.71) | 20 (2.01) | 434 (5.05) | 36 (4.16) | |||||||||||||||||||||||||||||||||||||||||||||||||||||||||||||||||||||||||||||||||||||||||||||||
| Crude HR (95% CI) | 1 (ref) | 0.52 (0.33–0.81) | 1.36 (1.20–1.53) | 1.08 (0.77–1.51) | |||||||||||||||||||||||||||||||||||||||||||||||||||||||||||||||||||||||||||||||||||||||||||||||
| Multivariable-adjusted HR (95% CI)a | 1 (ref) | 0.52 (0.34–0.82) | 1.36 (1.20–1.53) | 1.08 (0.77–1.51) | |||||||||||||||||||||||||||||||||||||||||||||||||||||||||||||||||||||||||||||||||||||||||||||||
| Baseline category | MHO | ||||||||||||||||||||||||||||||||||||||||||||||||||||||||||||||||||||||||||||||||||||||||||||||||||
| Follow-up category | MHNO | MHO | MUNO | MUO | |||||||||||||||||||||||||||||||||||||||||||||||||||||||||||||||||||||||||||||||||||||||||||||||
| n (% of baseline category) | 1, 095 (12.1) | 3, 780 (41.8) | 653 (7.2) | 3, 514 (38.9) | |||||||||||||||||||||||||||||||||||||||||||||||||||||||||||||||||||||||||||||||||||||||||||||||
| Number of events (%) | 41 (3.74) | 92 (2.43) | 31 (4.75) | 135 (3.84) | |||||||||||||||||||||||||||||||||||||||||||||||||||||||||||||||||||||||||||||||||||||||||||||||
| Crude HR (95% CI) | 0.98 (0.71–1.34) | 0.62 (0.49–0.77) | 1.22 (0.85–1.75) | 0.97 (0.81–1.17) | |||||||||||||||||||||||||||||||||||||||||||||||||||||||||||||||||||||||||||||||||||||||||||||||
| Multivariable-adjusted HR (95% CI)a | 0.98 (0.71–1.34) | 0.62 (0.50–0.77) | 1.23 (0.86–1.76) | 0.97 (0.81–1.17) | |||||||||||||||||||||||||||||||||||||||||||||||||||||||||||||||||||||||||||||||||||||||||||||||
| Baseline category | MUNO | ||||||||||||||||||||||||||||||||||||||||||||||||||||||||||||||||||||||||||||||||||||||||||||||||||
| Follow-up category | MHNO | MHO | MUNO | MUO | |||||||||||||||||||||||||||||||||||||||||||||||||||||||||||||||||||||||||||||||||||||||||||||||
| N (% of baseline category) | 9, 211 (20.4) | 623 (1.4) | 31, 677 (70.1) | 3, 665 (8.1) | |||||||||||||||||||||||||||||||||||||||||||||||||||||||||||||||||||||||||||||||||||||||||||||||
| Number of events (%) | 414 (4.49) | 28 (4.49) | 1,714 (5.41) | 182 (4.97) | |||||||||||||||||||||||||||||||||||||||||||||||||||||||||||||||||||||||||||||||||||||||||||||||
| Crude HR (95% CI) | 1.19 (1.06–1.35) | 1.14 (0.78–1.66) | 1.43 (1.31–1.56) | 1.30 (1.10–1.53) | |||||||||||||||||||||||||||||||||||||||||||||||||||||||||||||||||||||||||||||||||||||||||||||||
| Multivariable-adjusted HR (95% CI)a | 1.19 (1.05–1.35) | 1.14 (0.78–1.67) | 1.43 (1.31–1.57) | 1.29 (1.10–1.53) | |||||||||||||||||||||||||||||||||||||||||||||||||||||||||||||||||||||||||||||||||||||||||||||||
| Baseline category | MUO | ||||||||||||||||||||||||||||||||||||||||||||||||||||||||||||||||||||||||||||||||||||||||||||||||||
| Follow-up category | MHNO | MHO | MUNO | MUO | |||||||||||||||||||||||||||||||||||||||||||||||||||||||||||||||||||||||||||||||||||||||||||||||
| n (% of baseline category) | 1, 039 (3.1) | 3.568 (10.6) | 4, 797 (14.3) | 24, 110 (71.9) | |||||||||||||||||||||||||||||||||||||||||||||||||||||||||||||||||||||||||||||||||||||||||||||||
| Number of events (%) | 50 (4.81) | 87 (2.44) | 275 (5.73) | 961 (3.99) | |||||||||||||||||||||||||||||||||||||||||||||||||||||||||||||||||||||||||||||||||||||||||||||||
| Crude HR (95% CI) | 1.26 (0.94–1.68) | 0.62 (0.50–0.78) | 1.47 (1.28–1.70) | 1.02 (0.92–1.13) | |||||||||||||||||||||||||||||||||||||||||||||||||||||||||||||||||||||||||||||||||||||||||||||||
| Multivariable-adjusted HR (95% CI)a | 1.26 (0.94–1.67) | 0.62 (0.50–0.78) | 1.47 (1.28–1.70) | 1.02 (0.92–1.13) | |||||||||||||||||||||||||||||||||||||||||||||||||||||||||||||||||||||||||||||||||||||||||||||||
| aAdjusted for baseline age, sex, income, smoking, alcohol drinking, and physical activities. | |||||||||||||||||||||||||||||||||||||||||||||||||||||||||||||||||||||||||||||||||||||||||||||||||||
| Abbreviations: MHO: stable metabolically healthy obesity; MUO: metabolically unhealthy obesity; MUNO: metabolically unhealthy obesity; MHNO: metabolically healthy non-obesity. | |||||||||||||||||||||||||||||||||||||||||||||||||||||||||||||||||||||||||||||||||||||||||||||||||||
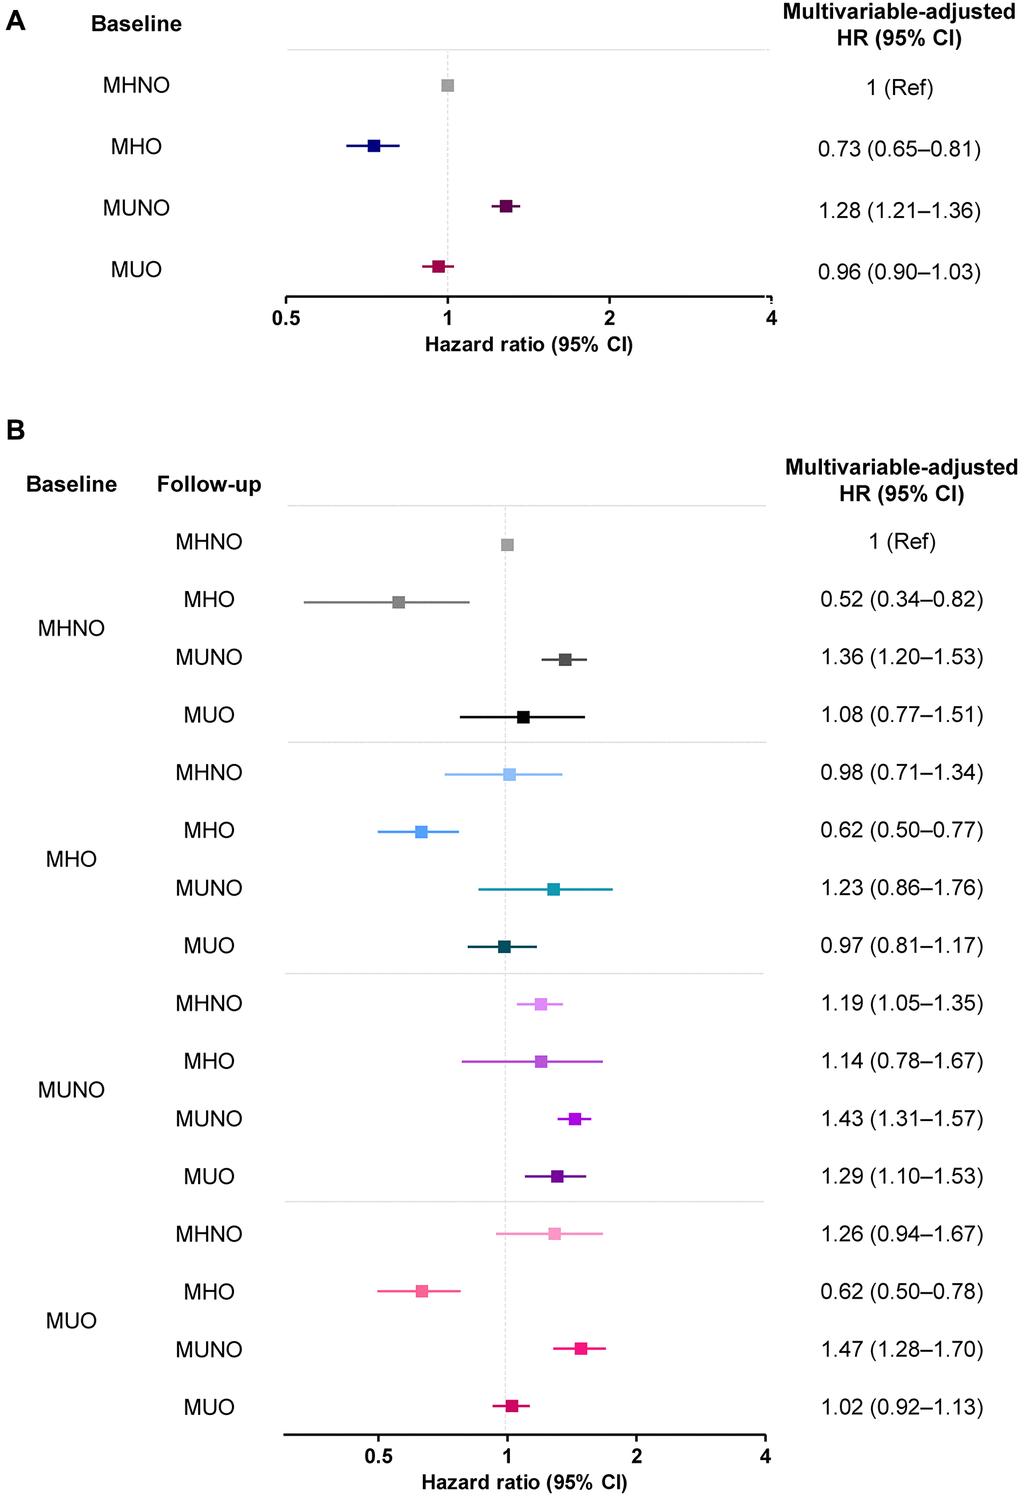
Figure 3. The risk of AD (A) without and (B) with consideration of transition in body mass and metabolic health phenotypes. Abbreviations: MHO: stable metabolically healthy obesity; MUO: metabolically unhealthy obesity; MUNO: metabolically unhealthy obesity; MHNO: metabolically healthy non-obesity.
In the baseline MUO group, the transition to the MHO phenotype significantly lowered the risk of AD (multivariable-adjusted HR, 0.62; 95% CI, 0.50–0.78), while the transition to MUNO status, or the regression of obesity without the improvement of metabolic health, carried a higher risk of AD (multivariable-adjusted HR, 1.47; 95% CI, 1.28–1.70). Similarly, the transition to a MUNO status from an MHNO status or the persistence of a MUNO status also increased the risk of AD development, relative to the risk borne by individuals in the stable MHNO group (multivariable-adjusted HR, 1.36; 95% CI, 1.20–1.53 and multivariable-adjusted HR, 1.29; 95% CI, 1.10–1.53, respectively, Table 3). The risks of AD without and with consideration of transitions in body mass and metabolic health phenotypes are summarized in Figure 3.
Discussion
In this nationwide population-based cohort study, we showed that the risk of AD was significantly reduced among MHO individuals, which was in line with the results of previous studies [2, 19]. Additionally, we analyzed the risk of AD according to phenotypic transitions observed during subsequent biannual examinations. The results showed that the protective tendency against AD was maintained among MHO individuals who maintained their MHO status (multivariable-adjusted HR, 0.62; 95% CI, 0.50–0.77), while this tendency disappeared when the obese metabolic phenotype changed. Importantly, the transition to MHO from MUO lowered the risk of AD compared with the maintenance of a stable MHNO status (multivariable-adjusted HR, 0.62; 95% CI, 0.50–0.78), further supporting the protective effect of the MHO phenotype against AD.
Previous investigations on the relationship between obesity and the development of AD have suggested midlife obesity is related with a 1.7- to 2.0-fold increased risk of dementia and AD [24, 25]. On the contrary, most recent studies have shown that being overweight or obese in old age protects against AD [10, 11, 26–28]. However, these previous studies did not consider metabolic unhealthiness, which frequently accompanies obesity, as a factor that potentially contributes to AD risk [12, 29]. A case–control study in a Western population suggested that AD was associated with the metabolic syndrome after adjusting for age, sex, and location [12]. In contrast, Raffaitin et al. investigated the associations of metabolic syndrome and its individual components with AD risk; they found that the presence of metabolic syndrome did not increase the risk of AD [29]. However, upon further analysis, high waist circumference—one of the components of metabolic syndrome—was inversely associated with AD risk (HR,0.63; 95% CI; 0.43–0.94). This inverse relationship suggested a protective effect of obesity, including in terms of possibly mitigating the negative effects of other metabolic abnormalities on AD development.
Recently, two cohort studies investigated the implications of obesity without metabolic unhealthiness on AD incidence [2, 19]. A Korean study using a nationwide cohort reported that the MHO group was at the lowest risk of AD (HR 0.87; 95% CI, 0.86–0.88) relative to the MHNO group [19]. Similarly, in a longitudinal study of 1,199 European individuals (drawn from the Alzheimer’s Disease Neuroimaging Initiative [ADNI] database) who were initially free of AD, the risk of AD among elderly obese individuals was significantly reduced after correcting for metabolic status (HR, 0.70; 95% CI, 0.56–0.89) [2]. Our study results are in line with the results of these previous studies, which demonstrated significantly lower AD risk among MHO subjects (HR, 0.73; 95% CI, 0.65–0.81; Table 2 and Figure 3A).
However, the clinical implications of an MHO status should also be considered in the context of transitory metabolic health states. According to previous reports, one-third to one-half of MHO patients proceeded to a metabolically unhealthy condition, whereas in a quarter to one-third of MUO patients the metabolic fitness was recovered [21, 30–32]. We found that less than half (41.8%) of the initial MHO cohort maintained their MHO status (Figure 2), while in the initial MUO group, 71.3% maintained their MUO status, and 10.6% transitioned to the MHO phenotype (Figure 2). These transitions, as well as the baseline condition, may have an impact on health outcomes over time. Given the changeable nature of metabolic health, researchers have recently developed novel methodologies for the comprehensive assessment of metabolic health status by tracking its transitions [22, 23, 32, 33].
In the present analysis, we observed that AD risk highly depended on transitions of body mass and metabolic health phenotypes, as well as the baseline status. Specifically, maintenance of the MHO phenotype carried a significantly lower risk of AD development than maintenance of the MHNO phenotype (multivariable-adjusted HR, 0.62; 95% CI, 0.50–0.77). Among MUO subjects at baseline, those who transitioned to the MUNO had a higher risk of AD, and a transition to the MHO phenotype protected subjects from AD (multivariable-adjusted HR, 0.62; 95% CI, 0.50–0.78). The risk was even lower than that associated with a stable MHNO phenotype. Our analysis on the transition of metabolic health and obesity status is evidence of the protective effect of obesity per se against the risk of AD.
As weight loss has been identified as a preclinical indicator of AD [34–36], an inverse association between BMI and the risk of AD has been proposed [37, 38]. According to Suemoto et al., a higher fall in BMI over the first 4 years of the study was related with lower memory scores over the next decade, and poorer memory scores were related with a decrease in BMI, indicating reverse causation [39]. However, they did not take metabolic health into consideration; that is, the independent association of metabolic health with obesity was not evaluated. As dementia, including AD, occurs more frequently in metabolically unhealthy people, analyses are likely to represent the outcomes of metabolically unhealthy individuals if researchers do not consider metabolic health in their research protocols.
Our approach, considering the transition in obese metabolic health status, separately investigated the implication of obesity and weight loss on the risk of AD. In the present analysis, weight loss in the initial MUO group (i.e., MUO to MUNO transition) conferred a high risk of AD development (HR, 1.47; 95% CI, 1.30–1.66; Figure 3B), corroborating the previously demonstrated negative effect of weight loss. However, weight loss in the MHO group (i.e., MHO to MHNO transition) did not increase the risk of developing AD (HR, 0.79; 95% CI, 0.73–1.30; Figure 3B). These results imply that the weight loss, or the inverse association, cannot simply explain the relationship between high BMI and the risk of AD; the MHO phenotype seems to have a protective effect. We investigated the relationship between obesity and AD, considering the phenotypic transition as well as the impact of metabolic health in the obese people. Our approach thus could minimize the possibility of reverse causality.
There are many possible mechanisms explaining the protective effects of the MHO phenotype against the development of AD. Insulin-like growth factor I, which exerts neurotrophic effects on the hippocampus [40], could play a protective role against AD development. Takuya et al. reported that patients with AD had significantly lower IGF-1 concentration than controls without dementia in a case–control study [41]. Similarly, cross-sectional analyses from the Rancho Bernardo Cohort Study demonstrated higher IGF-1 levels to be associated with better cognitive test performance [42]. Significantly low plasma IGF-I has been observed in underweight individuals [43], which could at least partly explain the lower risk of AD in MHO subjects. Additionally, certain adipokines, such as leptin, secreted by adipose tissue may be another explanation [44]. Higher circulating levels of leptin have been associated with a reduced incidence of dementia and AD and with higher brain volume [45–47]. A recent study found that the MHO phenotype was positively associated with CSF-Aβ pathology, and this association remained significant after adjusting for other possible confounders [2], providing another mechanism potentially explaining the beneficial effects of MHO. Further studies are warranted to better understand the mechanisms and potential for interventions.
We observed that the MHO phenotype did not have a protective effect against vascular dementia in our additional analyses (Supplementary Tables 1 and 2). The pathogenesis of vascular dementia is likely associated with stroke, as vascular insufficiency is the primary pathophysiologic mechanism underlying both stroke and vascular dementia [48]. Previous studies have indicated that MHO subjects have a similar or slightly increased risk of stroke relative to MHNO subjects [23, 49–53]. As the pathogenesis of vascular dementia differs from that of AD, the effects of obesity on vascular dementia could also differ from the effects of obesity on AD, as suggested in our additional results, although the small number of events in this study cohort is insufficient for drawing concrete conclusions.
Our study had several limitations to be acknowledged. First, AD and other comorbid conditions were defined using claims data in the nationwide database. There might have been coding errors leading to overestimations or underestimations of disease prevalence. However, to improve diagnostic accuracy, we used both diagnoses based on ICD-10 codes and the prescription of medicines to define the diseases. Second, there was no information regarding apolipoprotein E4 phenotype, the nutritional status including vitamin levels, and thyroid function, all of which are known to be associated with AD [54–58]. Third, given the relatively short follow-up, this study may not have been adequately powered to fully assess interactions. Next, the criteria we used to define metabolic health and obesity were arbitrary. In our analysis, metabolically healthy (<2 risk characteristics) versus unhealthy were defined according to a modified National Cholesterol Education Program-Adult Treatment Panel III (NCEP-ATP III) definition of metabolic syndrome [59]. Since BMI was used as a marker of obesity in the analyses, waist circumference was not used in the definition of metabolic health, and a cutoff point of <2 risk factors was utilized instead of the traditional <3 risk factors to define “metabolically healthy.” In fact, several prior studies used the same definition of MHO as our present study for the same reasons [60, 61]. Additionally, since our data did not include serum insulin levels, we could not use HOMA-IR data to define metabolic health. Lastly, we tried to mitigate reverse causality between AD and body weight by assessing the transition; however, a short-term follow-up of 2 years might not be sufficient to completely rule out reverse causality. Further research with longer follow-up is warranted.
In summary, the present study illustrated different levels of AD risk according to metabolic health and obesity status in an elderly Asian population. The MHO phenotype was associated with a 27% lower risk of AD, and maintenance of the MHO phenotype further reduced the risk to a 38% risk reduction. Transition to the MHO phenotype from the MUO phenotype also carried a protective effect against AD development. Therefore, clinicians should counsel their obese patients about metabolic fitness to help prevent the development of AD.
Materials and Methods
Study population
Data from the Korean National Health Insurance Service-National Health Screening Cohort (NHIS-HEALS), which included 514,866 people who had NHIS health screening checkups between 2002 and 2003. The entire structure and function of the Korean NHIS-HEALS are described in our Supplementary Materials and elsewhere [62]. During the index period of 2 years from January 1, 2009, through December 31, 2010, we assessed the demographic and biochemical data of the health screening cohort. This period was selected as the NHIS-HEALS has been documenting some biochemical measurements which are necessary for defining metabolic health, such as TG and HDL-C, since 2009 [62]. Additionally, the results from the next biannual examinations were used to assess serial changes in the obese and metabolic health status.
The subjects who died (n = 24,593) or had a history of dementia (n = 5,223) before or during the index period were excluded. Patients diagnosed with diseases that can lead to weight changes, either before their enrollment in the study inclusion or during follow-up, were excluded; people with malignancy (n = 37,212), thyroid disease (n = 19,120), head or spine trauma (n = 2,977), or previous major abdominal surgery (n = 2,824) were excluded. Individuals having missing values for the anthropometric or biochemical results were also excluded (n = 96,323). To determine the risk of AD according to late-life metabolic health and obesity, subjects aged ≥60 years were analyzed; people younger than 60 years were excluded (n = 189,747). Finally, 136,847 people were included in our analysis as a baseline study cohort. After the next biannual health examinations, 115,974 people were included in our analysis as a transition study cohort (Figure 1).
The institutional review board of Asan Medical Center approved this study (IRB No. 2020-0611). As this study analyzed the data from the NHIS-HEALS, which were fully anonymized and de-identified, informed consent from each participant was not obtained. This study was approved by the NHIS inquiry commission.
Definitions of metabolic health and obesity states
According to their obese and metabolic healthy status, subjects were categorized into four groups: MHNO, MHO, MUNO, and MUO groups [59, 63]. Criteria used for the definition of obesity and metabolic health are described in our Supplementary Materials.
Definitions of AD and metabolic comorbidities
AD was defined as at least two claims for AD (ICD-10 F00 or G30) with a prescription for anti-dementia drugs, such as rivastigmine, galantamine, memantine, and donepezil hydrochloride [19]. The study subjects were followed until the diagnosis of AD, death, or the end of the study period (December 31, 2015). Patients who were prescribed antidiabetic medications with diagnosis of type 2 diabetes, antihypertensive medications with diagnosis of hypertension and lipid-lowering medications with diagnosis of dyslipidemia were defined as having type 2 diabetes mellitus, hypertension or dyslipidemia, respectively. Definitions of AD and metabolic comorbidities in detail are provided in in our Supplementary Materials.
Covariates
Covariates in the analyses included age, sex, income, smoking habits, alcohol consumption habits, and physical activity. Incomes were categorized as medical aid, lower half, and upper half; smoking habits as non-smoker or past/current smoker; alcohol consumption habits were categorized as none or drinker; and physical activity was categorized according to frequency per week (0, 1–4, or ≥5 times per week).
Statistical analysis
Cox proportional hazards analyses were performed to estimate the hazard ratio (HR) and 95% confidence interval (CI) of AD. The risk of AD was assessed according to baseline metabolic health and obesity status, with the MHNO group as the reference. The risk of incident AD was further analyzed with consideration of the transitions in the metabolic healthy and obesity status, with reference to the stable MHNO group. All statistical analyses were performed using SAS Enterprise Guide software (version 7.1, SAS Institute, Inc., Cary, NC, USA). Detailed methods of statistical analysis are further described in our Supplementary Materials.
Author Contributions
CHJ conceived this study. YKC and CHJ contributed to the design of the study. YKC, HSK, and JL conducted data collection. YJK conducted the analysis. JYP, WJL, YKC, YJK, and CHJ interpreted the results. YKC wrote the initial draft of the manuscript, with revisions by all authors. The final manuscript was approved by all authors.
Acknowledgments
This work was supported by a grant (2015-583) from the Asan Institute of Life Sciences, Republic of Korea, and by a grant (C.H. Jung, 2020F-2) from the Korean Diabetes Association. This work was also supported by a grant (Y.K. Cho, 2020F-Hyangseol) from the Korean Diabetes Association. These funding sources had no roles in the design of the study; the collection, analysis, and interpretation of data; the writing of the article; or the decision to submit the article for publication.
Conflicts of Interest
The authors declare that they have no conflicts interests related to this study.
Funding
This work was supported by a grant (2015-583) from the Asan Institute of Life Sciences, Republic of Korea, and by a grant (C.H. Jung, 2020F-2) from the Korean Diabetes Association. This work was also supported by a grant (Y.K. Cho, 2020F-Hyangseol) from the Korean Diabetes Association. These funding sources had no roles in the design of the study; the collection, analysis, and interpretation of data; the writing of the article; or the decision to submit the article for publication.
References
- 1. Prince M, Bryce R, Albanese E, Wimo A, Ribeiro W, Ferri CP. The global prevalence of dementia: a systematic review and metaanalysis. Alzheimers Dement. 2013; 9:63–75.e2. https://doi.org/10.1016/j.jalz.2012.11.007 [PubMed]
- 2. Ma LZ, Huang YY, Wang ZT, Li JQ, Hou XH, Shen XN, Ou YN, Dong Q, Tan L, Yu JT, and Alzheimer′s Disease Neuroimaging Initiative. Metabolically healthy obesity reduces the risk of Alzheimer's disease in elders: a longitudinal study. Aging (Albany NY). 2019; 11:10939–51. https://doi.org/10.18632/aging.102496 [PubMed]
- 3. Calle EE, Thun MJ, Petrelli JM, Rodriguez C, Heath CW
Jr . Body-mass index and mortality in a prospective cohort of U.S. adults. N Engl J Med. 1999; 341:1097–105. https://doi.org/10.1056/nejm199910073411501 [PubMed] - 4. Calle EE, Rodriguez C, Walker-Thurmond K, Thun MJ. Overweight, obesity, and mortality from cancer in a prospectively studied cohort of U.S. adults. N Engl J Med. 2003; 348:1625–38. https://doi.org/10.1056/nejmoa021423 [PubMed]
- 5. Anstey KJ, Cherbuin N, Budge M, Young J. Body mass index in midlife and late-life as a risk factor for dementia: a meta-analysis of prospective studies. Obes Rev. 2011; 12:e426–37. https://doi.org/10.1111/j.1467-789X.2010.00825.x [PubMed]
- 6. Yu JH, Han K, Park S, Cho H, Lee DY, Kim JW, Seo JA, Kim SG, Baik SH, Park YG, Choi KM, Kim SM, Kim NH. Incidence and Risk Factors for Dementia in Type 2 Diabetes Mellitus: A Nationwide Population-Based Study in Korea. Diabetes Metab J. 2020; 44:113–24. https://doi.org/10.4093/dmj.2018.0216 [PubMed]
- 7. Chuang YF, An Y, Bilgel M, Wong DF, Troncoso JC, O'Brien RJ, Breitner JC, Ferruci L, Resnick SM, Thambisetty M. Midlife adiposity predicts earlier onset of Alzheimer's dementia, neuropathology and presymptomatic cerebral amyloid accumulation. Mol Psychiatry. 2016; 21:910–15. https://doi.org/10.1038/mp.2015.129 [PubMed]
- 8. Dahl AK, Löppönen M, Isoaho R, Berg S, Kivelä SL. Overweight and obesity in old age are not associated with greater dementia risk. J Am Geriatr Soc. 2008; 56:2261–66. https://doi.org/10.1111/j.1532-5415.2008.01958.x [PubMed]
- 9. Emmerzaal TL, Kiliaan AJ, Gustafson DR. 2003-2013: a decade of body mass index, Alzheimer's disease, and dementia. J Alzheimers Dis. 2015; 43:739–55. https://doi.org/10.3233/JAD-141086 [PubMed]
- 10. Fitzpatrick AL, Kuller LH, Lopez OL, Diehr P, O'Meara ES, Longstreth WT
Jr , Luchsinger JA. Midlife and late-life obesity and the risk of dementia: cardiovascular health study. Arch Neurol. 2009; 66:336–42. https://doi.org/10.1001/archneurol.2008.582 [PubMed] - 11. Hughes TF, Borenstein AR, Schofield E, Wu Y, Larson EB. Association between late-life body mass index and dementia: The Kame Project. Neurology. 2009; 72:1741–46. https://doi.org/10.1212/WNL.0b013e3181a60a58 [PubMed]
- 12. Razay G, Vreugdenhil A, Wilcock G. The metabolic syndrome and Alzheimer disease. Arch Neurol. 2007; 64:93–96. https://doi.org/10.1001/archneur.64.1.93 [PubMed]
- 13. Phillips CM. Metabolically healthy obesity: definitions, determinants and clinical implications. Rev Endocr Metab Disord. 2013; 14:219–27. https://doi.org/10.1007/s11154-013-9252-x [PubMed]
- 14. Primeau V, Coderre L, Karelis AD, Brochu M, Lavoie ME, Messier V, Sladek R, Rabasa-Lhoret R. Characterizing the profile of obese patients who are metabolically healthy. Int J Obes (Lond). 2011; 35:971–81. https://doi.org/10.1038/ijo.2010.216 [PubMed]
- 15. Stefan N, Kantartzis K, Machann J, Schick F, Thamer C, Rittig K, Balletshofer B, Machicao F, Fritsche A, Häring HU. Identification and characterization of metabolically benign obesity in humans. Arch Intern Med. 2008; 168:1609–16. https://doi.org/10.1001/archinte.168.15.1609 [PubMed]
- 16. Jung CH, Lee MJ, Kang YM, Hwang JY, Kim EH, Park JY, Kim HK, Lee WJ. The risk of chronic kidney disease in a metabolically healthy obese population. Kidney Int. 2015; 88:843–50. https://doi.org/10.1038/ki.2015.183 [PubMed]
- 17. Stefan N, Häring HU, Hu FB, Schulze MB. Metabolically healthy obesity: epidemiology, mechanisms, and clinical implications. Lancet Diabetes Endocrinol. 2013; 1:152–62. https://doi.org/10.1016/s2213-8587(13)70062-7 [PubMed]
- 18. Samocha-Bonet D, Dixit VD, Kahn CR, Leibel RL, Lin X, Nieuwdorp M, Pietiläinen KH, Rabasa-Lhoret R, Roden M, Scherer PE, Klein S, Ravussin E. Metabolically healthy and unhealthy obese--the 2013 Stock Conference report. Obes Rev. 2014; 15:697–708. https://doi.org/10.1111/obr.12199 [PubMed]
- 19. Lee JY, Han K, Han E, Kim G, Cho H, Kim KJ, Lee BW, Kang ES, Cha BS, Brayne C, Lee YH. Risk of Incident Dementia According to Metabolic Health and Obesity Status in Late Life: A Population-Based Cohort Study. J Clin Endocrinol Metab. 2019; 104:2942–52. https://doi.org/10.1210/jc.2018-01491 [PubMed]
- 20. Mongraw-Chaffin M, Foster MC, Anderson CAM, Burke GL, Haq N, Kalyani RR, Ouyang P, Sibley CT, Tracy R, Woodward M, Vaidya D. Metabolically Healthy Obesity, Transition to Metabolic Syndrome, and Cardiovascular Risk. J Am Coll Cardiol. 2018; 71:1857–65. https://doi.org/10.1016/j.jacc.2018.02.055 [PubMed]
- 21. Lee SH, Yang HK, Ha HS, Lee JH, Kwon HS, Park YM, Yim HW, Kang MI, Lee WC, Son HY, Yoon KH. Changes in Metabolic Health Status Over Time and Risk of Developing Type 2 Diabetes: A Prospective Cohort Study. Medicine (Baltimore). 2015; 94:e1705. https://doi.org/10.1097/md.0000000000001705 [PubMed]
- 22. Cho YK, Lee J, Kim HS, Park JY, Lee WJ, Kim YJ, Jung CH. Impact of Transition in Metabolic Health and Obesity on the Incident Chronic Kidney Disease: A Nationwide Cohort Study. J Clin Endocrinol Metab. 2020; 105:dgaa033. https://doi.org/10.1210/clinem/dgaa033 [PubMed]
- 23. Cho YK, Kang YM, Yoo JH, Lee J, Park JY, Lee WJ, Kim YJ, Jung CH. Implications of the dynamic nature of metabolic health status and obesity on risk of incident cardiovascular events and mortality: a nationwide population-based cohort study. Metabolism. 2019; 97:50–56. https://doi.org/10.1016/j.metabol.2019.05.002 [PubMed]
- 24. Whitmer RA, Gunderson EP, Barrett-Connor E, Quesenberry CP
Jr , Yaffe K. Obesity in middle age and future risk of dementia: a 27 year longitudinal population based study. BMJ. 2005; 330:1360. https://doi.org/10.1136/bmj.38446.466238.E0 [PubMed] - 25. Kivipelto M, Ngandu T, Fratiglioni L, Viitanen M, Kåreholt I, Winblad B, Helkala EL, Tuomilehto J, Soininen H, Nissinen A. Obesity and vascular risk factors at midlife and the risk of dementia and Alzheimer disease. Arch Neurol. 2005; 62:1556–60. https://doi.org/10.1001/archneur.62.10.1556 [PubMed]
- 26. Atti AR, Palmer K, Volpato S, Winblad B, De Ronchi D, Fratiglioni L. Late-life body mass index and dementia incidence: nine-year follow-up data from the Kungsholmen Project. J Am Geriatr Soc. 2008; 56:111–16. https://doi.org/10.1111/j.1532-5415.2007.01458.x [PubMed]
- 27. Buchman AS, Schneider JA, Wilson RS, Bienias JL, Bennett DA. Body mass index in older persons is associated with Alzheimer disease pathology. Neurology. 2006; 67:1949–54. https://doi.org/10.1212/01.wnl.0000247046.90574.0f [PubMed]
- 28. Ye BS, Jang EY, Kim SY, Kim EJ, Park SA, Lee Y, Hong CH, Choi SH, Yoon B, Yoon SJ, Na HR, Lee JH, Jeong JH, et al. Unstable Body Mass Index and Progression to Probable Alzheimer's Disease Dementia in Patients with Amnestic Mild Cognitive Impairment. J Alzheimers Dis. 2016; 49:483–91. https://doi.org/10.3233/JAD-150556 [PubMed]
- 29. Raffaitin C, Gin H, Empana JP, Helmer C, Berr C, Tzourio C, Portet F, Dartigues JF, Alpérovitch A, Barberger-Gateau P. Metabolic syndrome and risk for incident Alzheimer's disease or vascular dementia: the Three-City Study. Diabetes Care. 2009; 32:169–74. https://doi.org/10.2337/dc08-0272 [PubMed]
- 30. Hamer M, Bell JA, Sabia S, Batty GD, Kivimäki M. Stability of metabolically healthy obesity over 8 years: the English Longitudinal Study of Ageing. Eur J Endocrinol. 2015; 173:703–08. https://doi.org/10.1530/EJE-15-0449 [PubMed]
- 31. Bell JA, Hamer M, Sabia S, Singh-Manoux A, Batty GD, Kivimaki M. The natural course of healthy obesity over 20 years. J Am Coll Cardiol. 2015; 65:101–02. https://doi.org/10.1016/j.jacc.2014.09.077 [PubMed]
- 32. Kim JA, Kim DH, Kim SM, Park YG, Kim NH, Baik SH, Choi KM, Han K, Yoo HJ. Impact of the Dynamic Change of Metabolic Health Status on the Incident Type 2 Diabetes: A Nationwide Population-Based Cohort Study. Endocrinol Metab (Seoul). 2019; 34:406–14. https://doi.org/10.3803/EnM.2019.34.4.406 [PubMed]
- 33. Nam KH, Yun HR, Joo YS, Kim J, Lee S, Lee C, Park KS, Park JT, Chang TI, Kang EW, Yoo TH, Kang SW, Han SH. Changes in obese metabolic phenotypes over time and risk of incident chronic kidney disease. Diabetes Obes Metab. 2018; 20:2778–91. https://doi.org/10.1111/dom.13458 [PubMed]
- 34. Müller S, Preische O, Sohrabi HR, Gräber S, Jucker M, Dietzsch J, Ringman JM, Martins RN, McDade E, Schofield PR, Ghetti B, Rossor M, Graff-Radford NR, et al. Decreased body mass index in the preclinical stage of autosomal dominant Alzheimer's disease. Sci Rep. 2017; 7:1225. https://doi.org/10.1038/s41598-017-01327-w [PubMed]
- 35. Johnson DK, Wilkins CH, Morris JC. Accelerated weight loss may precede diagnosis in Alzheimer disease. Arch Neurol. 2006; 63:1312–17. https://doi.org/10.1001/archneur.63.9.1312 [PubMed]
- 36. Knopman DS, Edland SD, Cha RH, Petersen RC, Rocca WA. Incident dementia in women is preceded by weight loss by at least a decade. Neurology. 2007; 69:739–46. https://doi.org/10.1212/01.wnl.0000267661.65586.33 [PubMed]
- 37. Tolppanen AM, Ngandu T, Kåreholt I, Laatikainen T, Rusanen M, Soininen H, Kivipelto M. Midlife and late-life body mass index and late-life dementia: results from a prospective population-based cohort. J Alzheimers Dis. 2014; 38:201–09. https://doi.org/10.3233/JAD-130698 [PubMed]
- 38. Stewart R, Masaki K, Xue QL, Peila R, Petrovitch H, White LR, Launer LJ. A 32-year prospective study of change in body weight and incident dementia: the Honolulu-Asia Aging Study. Arch Neurol. 2005; 62:55–60. https://doi.org/10.1001/archneur.62.1.55 [PubMed]
- 39. Suemoto CK, Gilsanz P, Mayeda ER, Glymour MM. Body mass index and cognitive function: the potential for reverse causation. Int J Obes (Lond). 2015; 39:1383–89. https://doi.org/10.1038/ijo.2015.83 [PubMed]
- 40. Bianchi VE, Locatelli V, Rizzi L. Neurotrophic and Neuroregenerative Effects of GH/IGF1. Int J Mol Sci. 2017; 18:2441. https://doi.org/10.3390/ijms18112441 [PubMed]
- 41. Watanabe T, Miyazaki A, Katagiri T, Yamamoto H, Idei T, Iguchi T. Relationship between serum insulin-like growth factor-1 levels and Alzheimer's disease and vascular dementia. J Am Geriatr Soc. 2005; 53:1748–53. https://doi.org/10.1111/j.1532-5415.2005.53524.x [PubMed]
- 42. Al-Delaimy WK, von Muhlen D, Barrett-Connor E. Insulinlike growth factor-1, insulinlike growth factor binding protein-1, and cognitive function in older men and women. J Am Geriatr Soc. 2009; 57:1441–46. https://doi.org/10.1111/j.1532-5415.2009.02343.x [PubMed]
- 43. Yamamoto H, Kato Y. Relationship between plasma insulin-like growth factor I (IGF-I) levels and body mass index (BMI) in adults. Endocr J. 1993; 40:41–45. https://doi.org/10.1507/endocrj.40.41 [PubMed]
- 44. Doehner W, Clark A, Anker SD. The obesity paradox: weighing the benefit. Eur Heart J. 2010; 31:146–48. https://doi.org/10.1093/eurheartj/ehp339 [PubMed]
- 45. Lee EB. Obesity, leptin, and Alzheimer's disease. Ann N Y Acad Sci. 2011; 1243:15–29. https://doi.org/10.1111/j.1749-6632.2011.06274.x [PubMed]
- 46. Beccano-Kelly D, Harvey J. Leptin: a novel therapeutic target in Alzheimer's disease? Int J Alzheimers Dis. 2012; 2012:594137. https://doi.org/10.1155/2012/594137 [PubMed]
- 47. Lieb W, Beiser AS, Vasan RS, Tan ZS, Au R, Harris TB, Roubenoff R, Auerbach S, DeCarli C, Wolf PA, Seshadri S. Association of plasma leptin levels with incident Alzheimer disease and MRI measures of brain aging. JAMA. 2009; 302:2565–72. https://doi.org/10.1001/jama.2009.1836 [PubMed]
- 48. Kalaria RN. The pathology and pathophysiology of vascular dementia. Neuropharmacology. 2018; 134:226–39. https://doi.org/10.1016/j.neuropharm.2017.12.030 [PubMed]
- 49. Caleyachetty R, Thomas GN, Toulis KA, Mohammed N, Gokhale KM, Balachandran K, Nirantharakumar K. Metabolically Healthy Obese and Incident Cardiovascular Disease Events Among 3.5 Million Men and Women. J Am Coll Cardiol. 2017; 70:1429–37. https://doi.org/10.1016/j.jacc.2017.07.763 [PubMed]
- 50. Sánchez-Iñigo L, Navarro-González D, Fernández-Montero A, Pastrana-Delgado J, Martínez JA. Risk of incident ischemic stroke according to the metabolic health and obesity states in the Vascular-Metabolic CUN cohort. Int J Stroke. 2017; 12:187–91. https://doi.org/10.1177/1747493016672083 [PubMed]
- 51. Byun AR, Kwon S, Lee SW, Shim KW, Lee HS. Metabolic health is more closely associated with prevalence of cardiovascular diseases or stroke than obesity: A cross-sectional study in Korean populations. Medicine (Baltimore). 2016; 95:e3902. https://doi.org/10.1097/MD.0000000000003902 [PubMed]
- 52. Li Z, Guo X, Liu Y, Zhang N, Chang Y, Chen Y, Sun Y, Abraham MR. Metabolism rather than obesity is associated with ischemic stroke: a cross-sectional study in rural Northeastern China. Springerplus. 2016; 5:1419. https://doi.org/10.1186/s40064-016-3088-2 [PubMed]
- 53. Lee HJ, Choi EK, Lee SH, Kim YJ, Han KD, Oh S. Risk of ischemic stroke in metabolically healthy obesity: A nationwide population-based study. PLoS One. 2018; 13:e0195210. https://doi.org/10.1371/journal.pone.0195210 [PubMed]
- 54. Mahieux F, Couderc R, Moulignier A, Bailleul S, Podrabinek N, Laudet J. Apolipoprotein E4: phenotype in patients with Alzheimer's disease. Ann Neurol. 1994; 35:506–07. https://doi.org/10.1002/ana.410350424 [PubMed]
- 55. Wada M, Noda Y, Shinagawa S, Chung JK, Sawada K, Ogyu K, Tarumi R, Tsugawa S, Miyazaki T, Yamagata B, Graff-Guerrero A, Mimura M, Nakajima S, and Alzheimer’s Disease Neuroimaging Initiative. Effect of Education on Alzheimer's Disease-Related Neuroimaging Biomarkers in Healthy Controls, and Participants with Mild Cognitive Impairment and Alzheimer's Disease: A Cross-Sectional Study. J Alzheimers Dis. 2018; 63:861–69. https://doi.org/10.3233/JAD-171168 [PubMed]
- 56. Wang HX, Wahlin A, Basun H, Fastbom J, Winblad B, Fratiglioni L. Vitamin B(12) and folate in relation to the development of Alzheimer's disease. Neurology. 2001; 56:1188–94. https://doi.org/10.1212/wnl.56.9.1188 [PubMed]
- 57. Ertilav E, Barcin NE, Ozdem S. Comparison of Serum Free and Bioavailable 25-Hydroxyvitamin D Levels in Alzheimer's Disease and Healthy Control Patients. Lab Med. 2021; 52:219–25. https://doi.org/10.1093/labmed/lmaa066 [PubMed]
- 58. Quinlan P, Horvath A, Eckerström C, Wallin A, Svensson J. Altered thyroid hormone profile in patients with Alzheimer's disease. Psychoneuroendocrinology. 2020; 121:104844. https://doi.org/10.1016/j.psyneuen.2020.104844 [PubMed]
- 59. Expert Panel on Detection, Evaluation, and Treatment of High Blood Cholesterol in Adults. Executive Summary of The Third Report of The National Cholesterol Education Program (NCEP) Expert Panel on Detection, Evaluation, And Treatment of High Blood Cholesterol In Adults (Adult Treatment Panel III). JAMA. 2001; 285:2486–97. https://doi.org/10.1001/jama.285.19.2486 [PubMed]
- 60. Arnlöv J, Ingelsson E, Sundström J, Lind L. Impact of body mass index and the metabolic syndrome on the risk of cardiovascular disease and death in middle-aged men. Circulation. 2010; 121:230–36. https://doi.org/10.1161/CIRCULATIONAHA.109.887521 [PubMed]
- 61. Hinnouho GM, Czernichow S, Dugravot A, Batty GD, Kivimaki M, Singh-Manoux A. Metabolically healthy obesity and risk of mortality: does the definition of metabolic health matter? Diabetes Care. 2013; 36:2294–300. https://doi.org/10.2337/dc12-1654 [PubMed]
- 62. Seong SC, Kim YY, Park SK, Khang YH, Kim HC, Park JH, Kang HJ, Do CH, Song JS, Lee EJ, Ha S, Shin SA, Jeong SL. Cohort profile: the National Health Insurance Service-National Health Screening Cohort (NHIS-HEALS) in Korea. BMJ Open. 2017; 7:e016640. https://doi.org/10.1136/bmjopen-2017-016640 [PubMed]
- 63. WHO Expert Consultation. Appropriate body-mass index for Asian populations and its implications for policy and intervention strategies. Lancet. 2004; 363:157–63. https://doi.org/10.1016/s0140-6736(03)15268-3 [PubMed]